iBankCoin
Home / Tag Archives: $SPY (page 3)

Tag Archives: $SPY

Choppy Waters Alert

The markets were fairly quiet overnight and staged a small rally in the early am hours which is how being faded back.  Price is consolidating ahead of the US open and I suspect more chop is in store before we see any directional conviction today.

We are currently trading near yesterday’s VPOC which tells me little in the way of development occurred overnight.  Instead the markets seemed to tread water, waiting to hear the next development out of the United States.

Early on, buy flow has a slight edge and if the market can put in a higher low here premarket we may get some additional vertical development by the bulls.  Overall however, the situation has become much more choppy and indecisive.

I have highlighted a few scenarios and key levels on the following market profile charts:

ES_MarketProfile_10042013

Comments »

Day Three: Sellers After Hours

This is the third day I have woken up to assess sell flow in the overnight markets.  The S&P rejected the large distribution we built into last week’s close which had a value area low at 1686.25.  It came in the form of a rally that failed to take out the intraday high.  Instead price fizzled out into the bell and eventually sold off hard after hours.

As aggressive at the evening sellers were, their order flow did not take out yesterday’s RTH low at 1673.25.  Instead it stopped and turned on a dime one tick above the low.  Since then we have snapped back and are trading sideways and the globex volume profile shows balance.

Early on the important manner is who pushes first.  We have a low volume node at 1682 (o/n high) which looks vulnerable if some buyers come in early on.

My overall analysis is that if no aggressive selling comes in and we hold yesterday’s low, the stage is setting up for a rally.

I have highlighted some upside targets and a few scenarios on the following market profile charts:

ES_MarketProfile_10032013

Comments »

Heavy Selling Overnight

The overnight action in the S&P saw a wave a selling rip though overnight pressing prices over 15 handles off the high.  Since then price has rotated higher a bit and we are currently trading about 8 handles below yesterday’s close.

Early on price is negotiating an interesting level right here from 1681 – 1683 which was a huge volume cave during yesterday’s trade.  I am interested to see who dictates price away from the range and the directional conviction they carry with their trade.  It could certainly be the hand tip during the morning session.

With a gap of less than 10 handles, it is prudent to keep the gap trade in your contextual mind during today’s session.  The sellers hold the momentum edge currently and it would not surprise me to see another push lower from them early on.  But it is important to consider the possibility of trapping shorts on that move and the implications it has on a potential gap fill.

I have highlighted a price levels of interest and a few scenarios on the following market profile charts:

ES_MarketProfile_10022013

Comments »

Follow Through Turns To Fizzle

The S&P was able to follow through on the strength that entered the market late yesterday afternoon.  Huge volume poured into the market near the bell, pressing us into the upper quadrant and above the VPOC.  Since then the market has fizzled a bit and is mostly trading sideways about 1.5 points above yesterday’s close.

Since gapping lower Sunday evening the market has been slowly climbing back toward Da Vinci’s brush which was the naming we used for the very large value distribution that formed during the second half of last week.  The question now is how we treat this value.  Can we get back inside it and sustain trade for more than an hour?  If yes, there is an 80% probability we will rotate the entire area.  If instead we test 1686.25 and the market sharply rejects price, we may be in store for a more broad based correction.  We may even reject the area initially but find sellers cannot follow through on the rejection but instead run out of gas.  These are three scenarios you must consider when observing a large balance of trade.

Overnight we printed two TPO distributions, but a relatively Gaussian volume distribution suggesting we are finding balance in the marketplace.  We saw a sharp buying tail on Monday morning that bulls do not want to see given up which starts at 1671.  Trading back below that level shows definite weakness from a once otherwise strong buyer.

I have highlighted these levels and a few scenarios on the following market profile charts:

ES_MarketProfile_10012013

Comments »

There Is a Bid Under This Market

Price is/was/will always be the final arbiter, but I like to use cumulative volume delta to peer a little deeper into order flow. Check out the below graph, the below line is averaging the delta (volume at offer – volume at bid) to smooth the behavior out so I can better observe the trend.

Since the 26th, more orders are taking place at the offer than the bid suggesting aggressive buyers are more active than aggressive sellers.  Perhaps the developing shape, wall-o-worry, is leading the market.  Perhaps buyers are getting too far ahead of themselves and will blow their buying power before an actual move.  Nevertheless, the bid is present:

ES_BID

Comments »

Month End Gap Management

Futures opened weak Sunday evening amidst headlines of a government shutdown.  Whether or not this established news flow is the reason for the gap lower, or if instead some other macro characteristic fundamentally changed over the weekend I cannot say.  What we do know is today is the final day of the month and we are coming into it with a 15 handle gap in the S&P.

These so called pro gaps are named as such due to their quirky behavior and proclivity to defy smaller gap-like tendencies.  Simply buying the open with the expectation of the gap filling higher is a fools endeavor unless said fool possesses very deep pockets and radical risk tolerance.  Instead one would be keen to closely observe the first half hour of trade and do their best to classify the opening type and the implications it has on both buyer and seller conviction.

Early on, my initial hypothesis is for sellers to push and attempt to drive lower on the gap.  However to my eye the task seems daunting.  There have been three rotations lower since the intial gap down and in their sum they have only achieved four handles of rotation.  The market keeps bumping its head on 1676.  Should the buyers breach this price and sustain trade, we would be well on our way toward navigating this overhead gap.  Watch for head fakes!

Down below, I am keying off of two support levels dating back to the early days of September: nearby 1669.50 and the ghoulish 1666.  Should the market furiously slash though these levels early this week, it may be prudent to raise cash levels and consider hedging.

I have highlighted a scenario and price levels on the following market profile charts:

ESMP_09302013


Comments »

Coiling and Balancing

The /ES is working on coming into balance, and that process has continued overnight.  Overnight there were seven handles of range but it took place within yesterdays range.  Price was unable to take out prior day highs (or lows) as it auctioned through the night.  Instead we saw a quiet auction taking place within the confines of our lower distribution.

Early on we may see sellers working back into the market to close any overnight gap back down to 1686.25.  This level also marks the value area low set by both distributions yesterday.  If bulls want to effectively impede the sell flow, they can start by holding value and setting a higher low.

Overall my expectation is for continued choppiness which means we are in a trading environment conducive to intraday Bossram Alpha signals.  The key is patience and letting the market come to your target entry points—think Braveheart holding the line alongside his army.

I have highlighted a few scenarios and price levels of interest on the following market profile charts:

ES_MarketProfile_09262013

Comments »

Clear Sentiment Emerges from The Fog

This morning took a bit of extra chart work to get the right context built.  I want to sum my thoughts very briefly before turning your attention to the following chart diagnostics for the S&P 500 and what they suggest about the sentiment of the overall market.

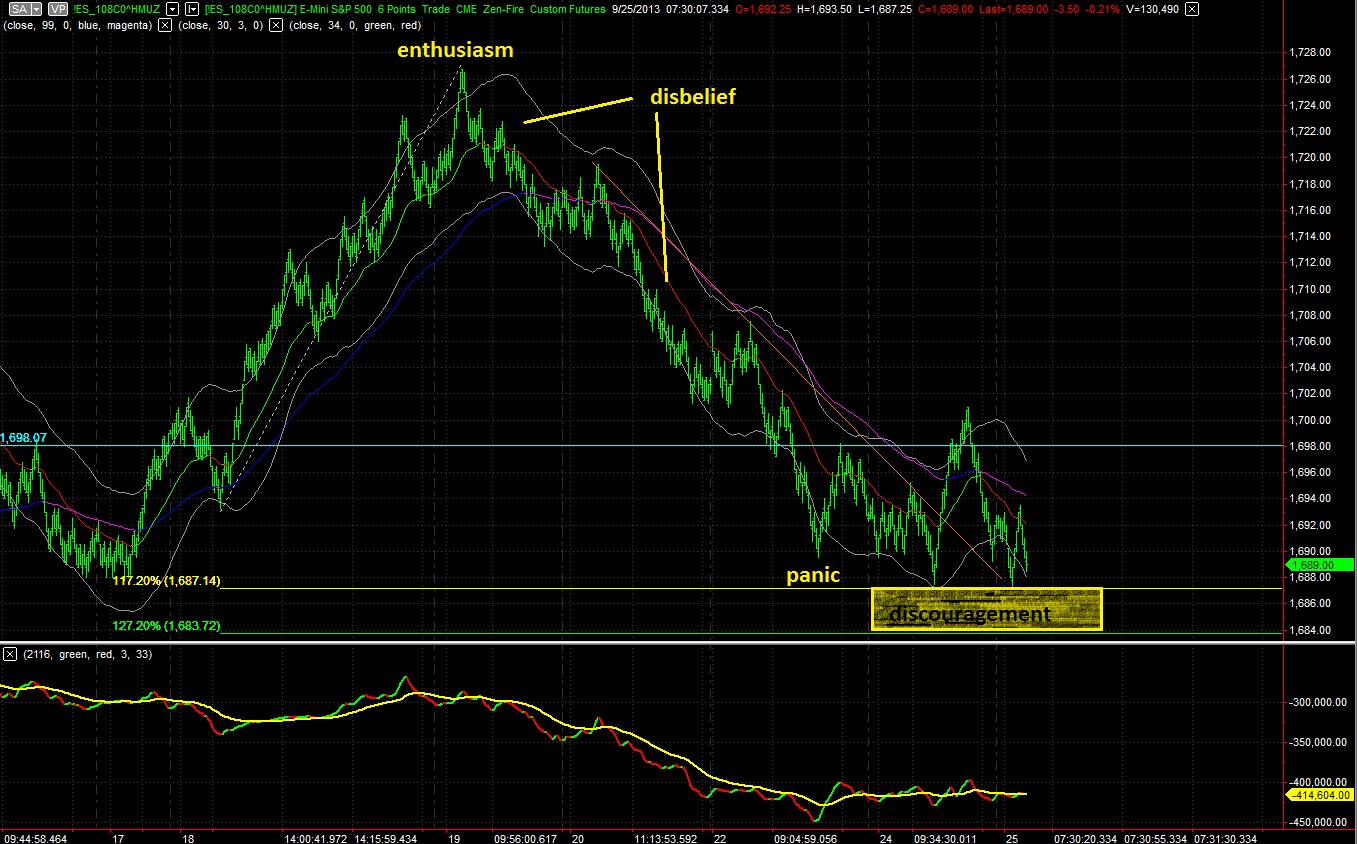
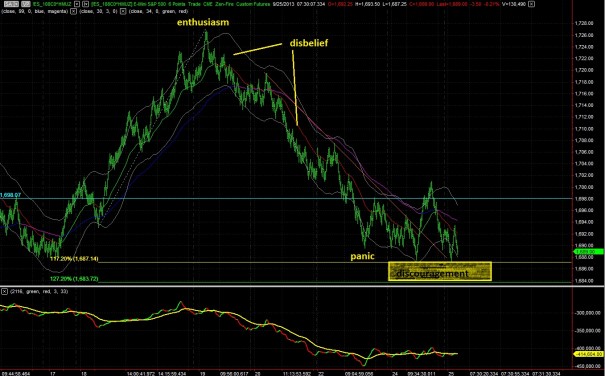
First I present a bar chart with some sentiment commentary.  You may recall this chart’s similarity to the frequently referenced Option Addict sentiment chart.  To my eyes we are working through discouragement, which is a buying opportunity as long as we do not blast through the lows:

ES_Sentiment_09252013

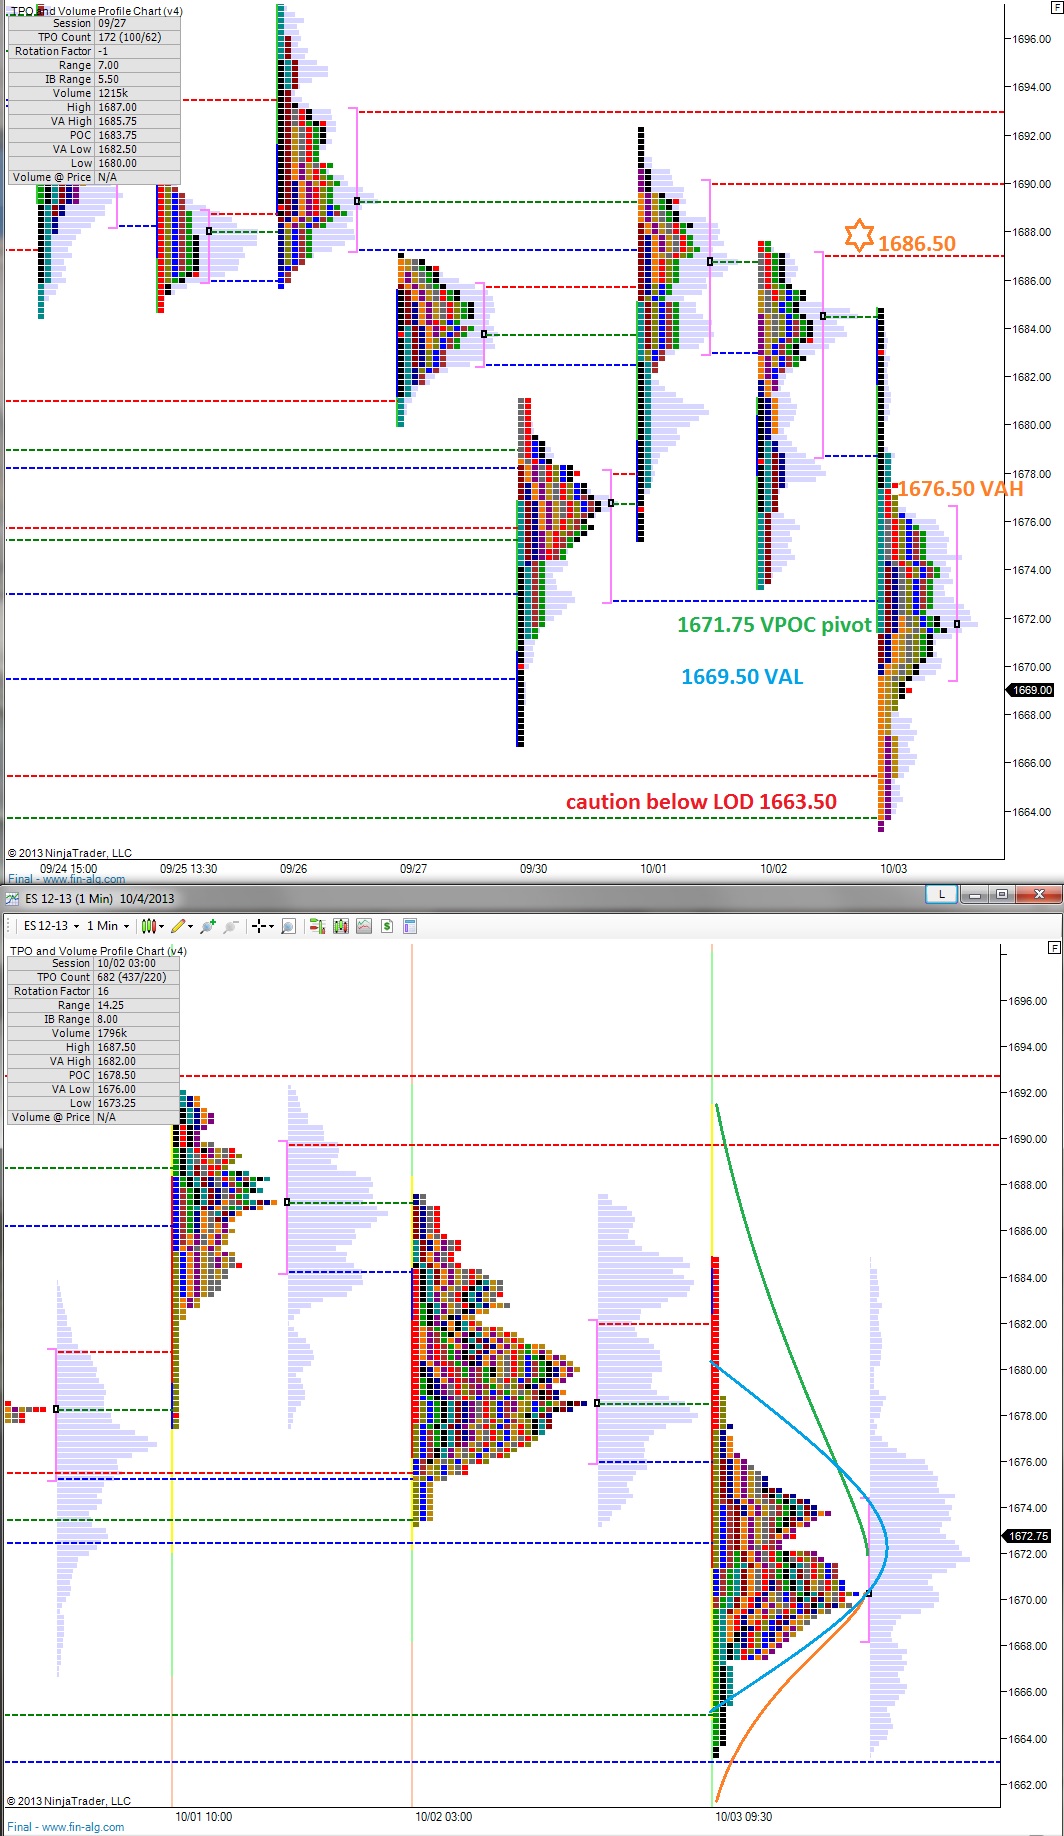
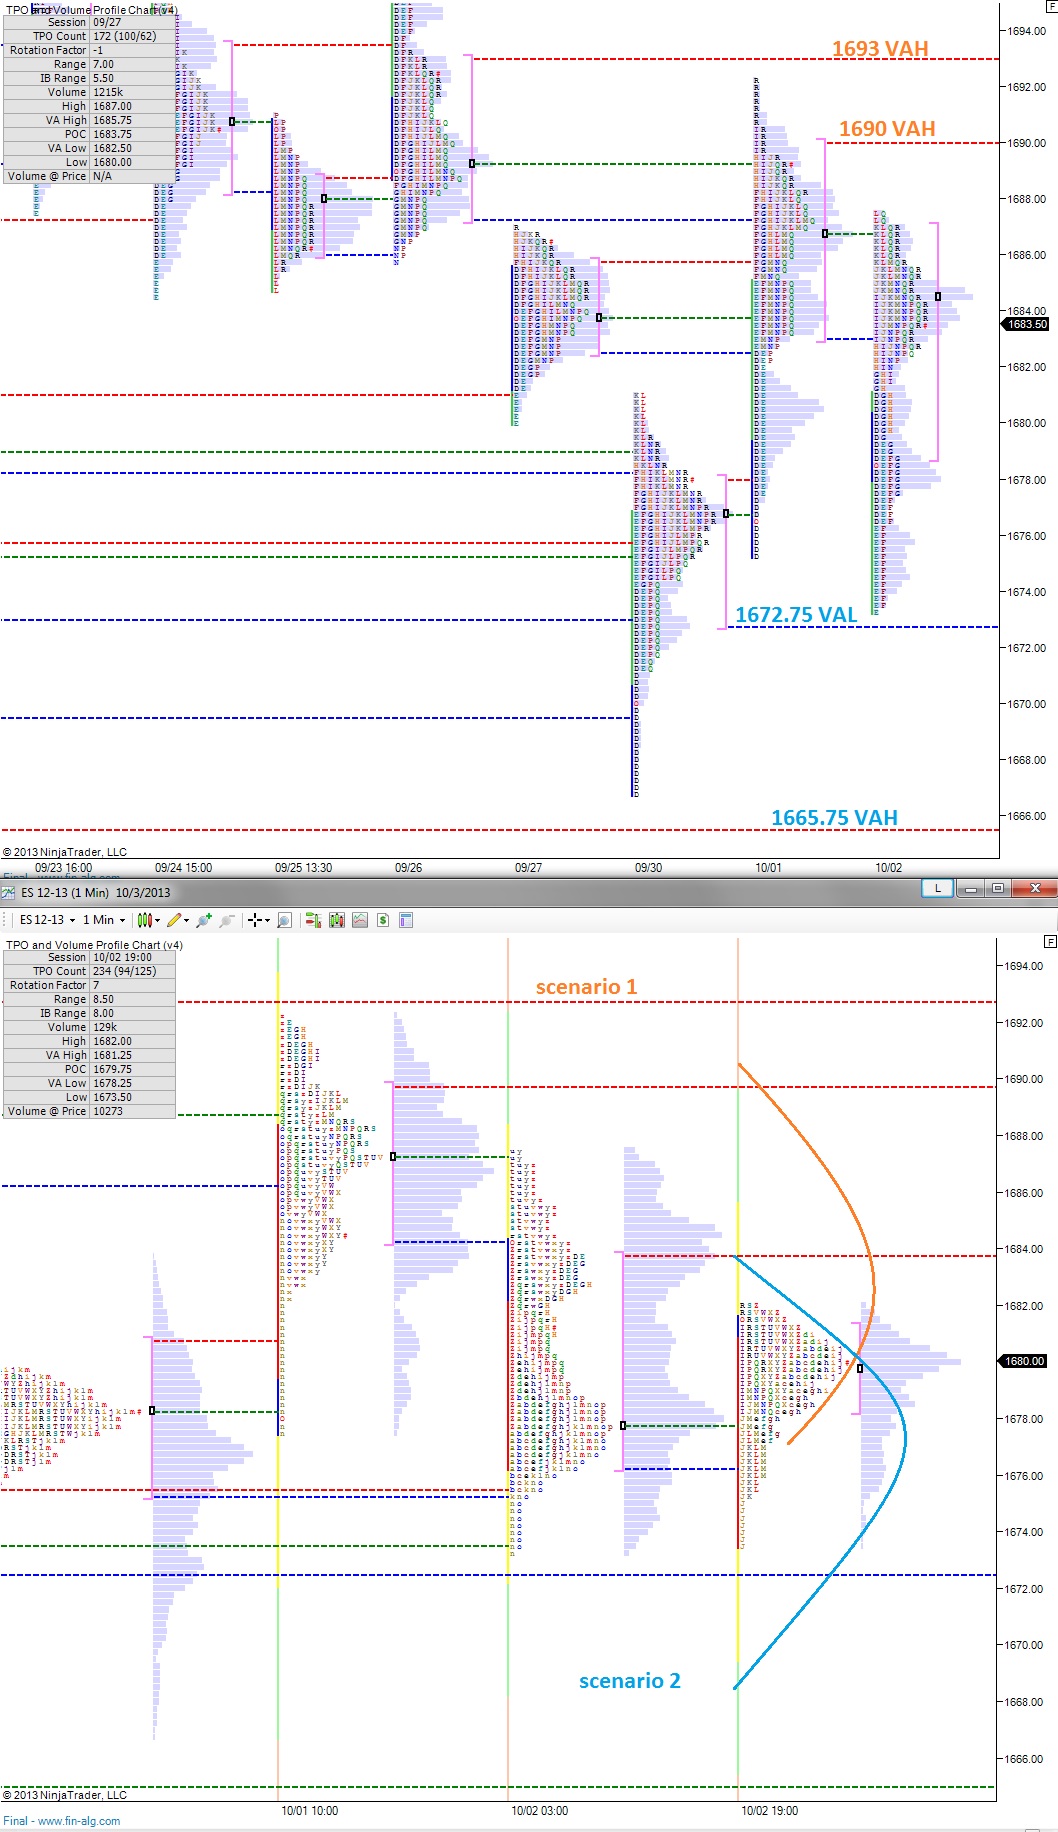
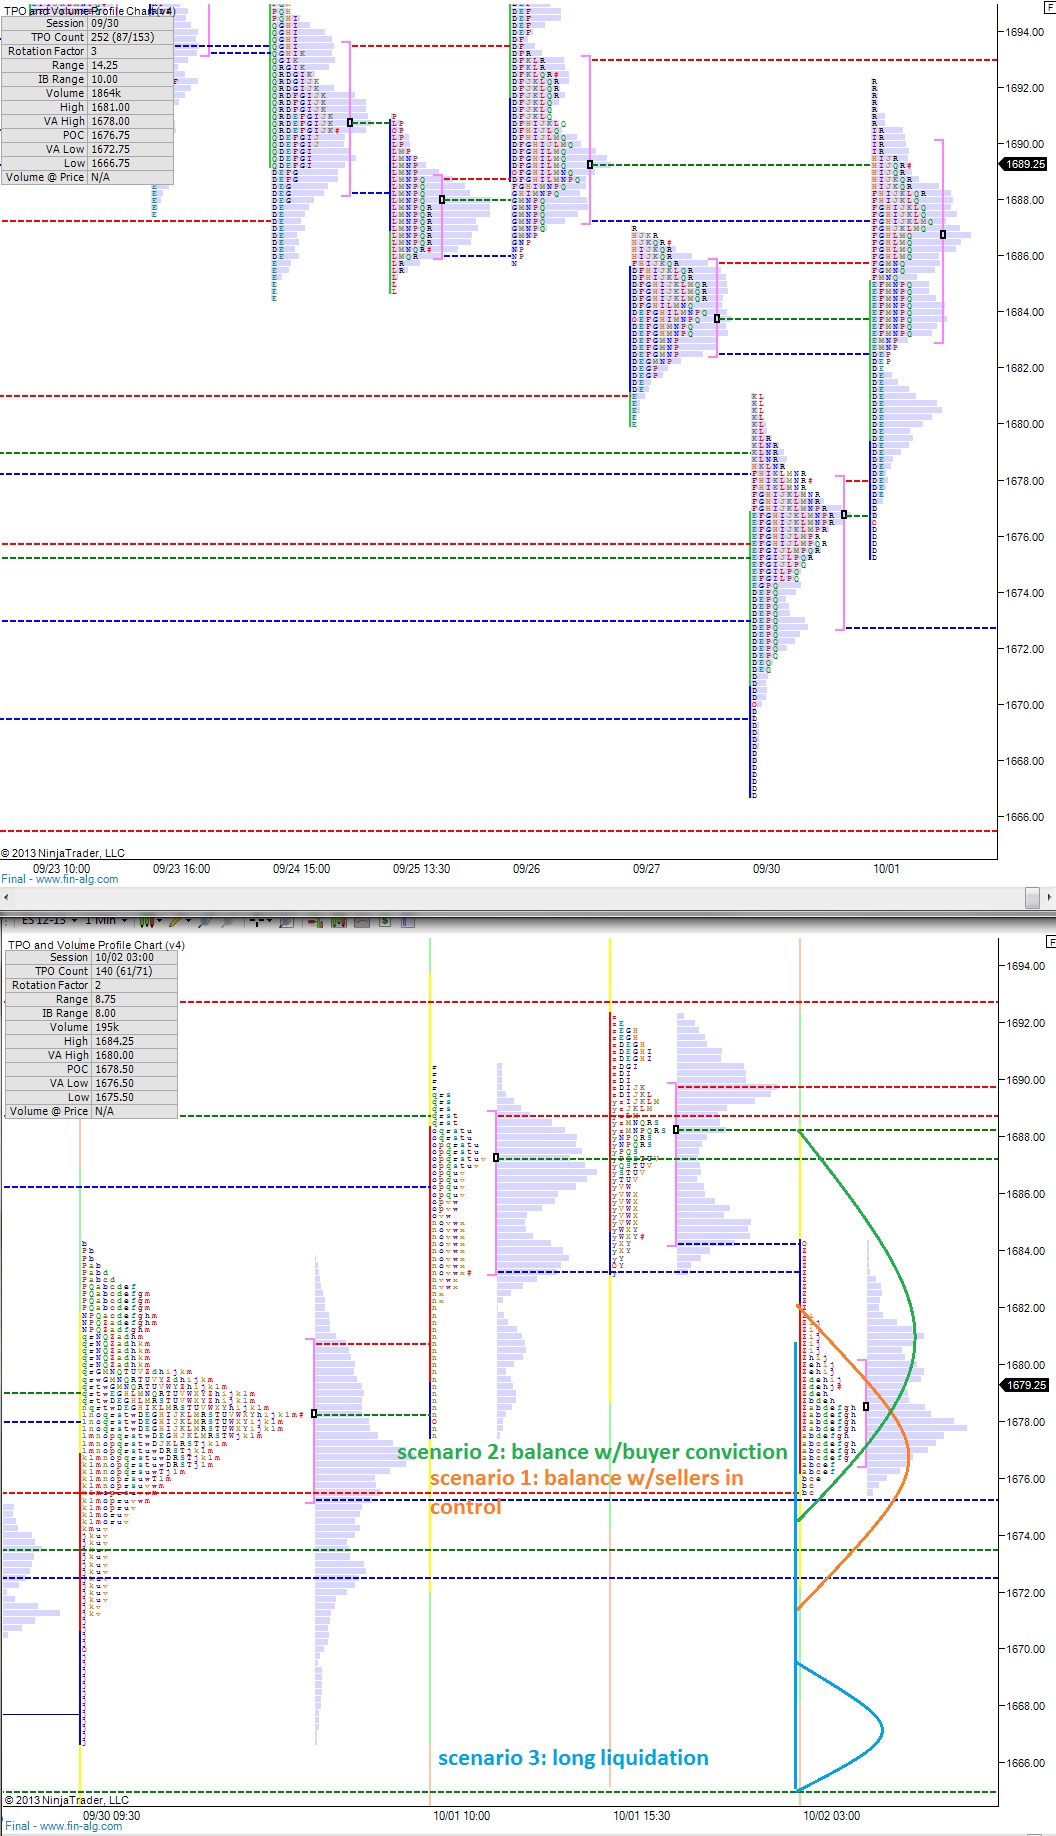
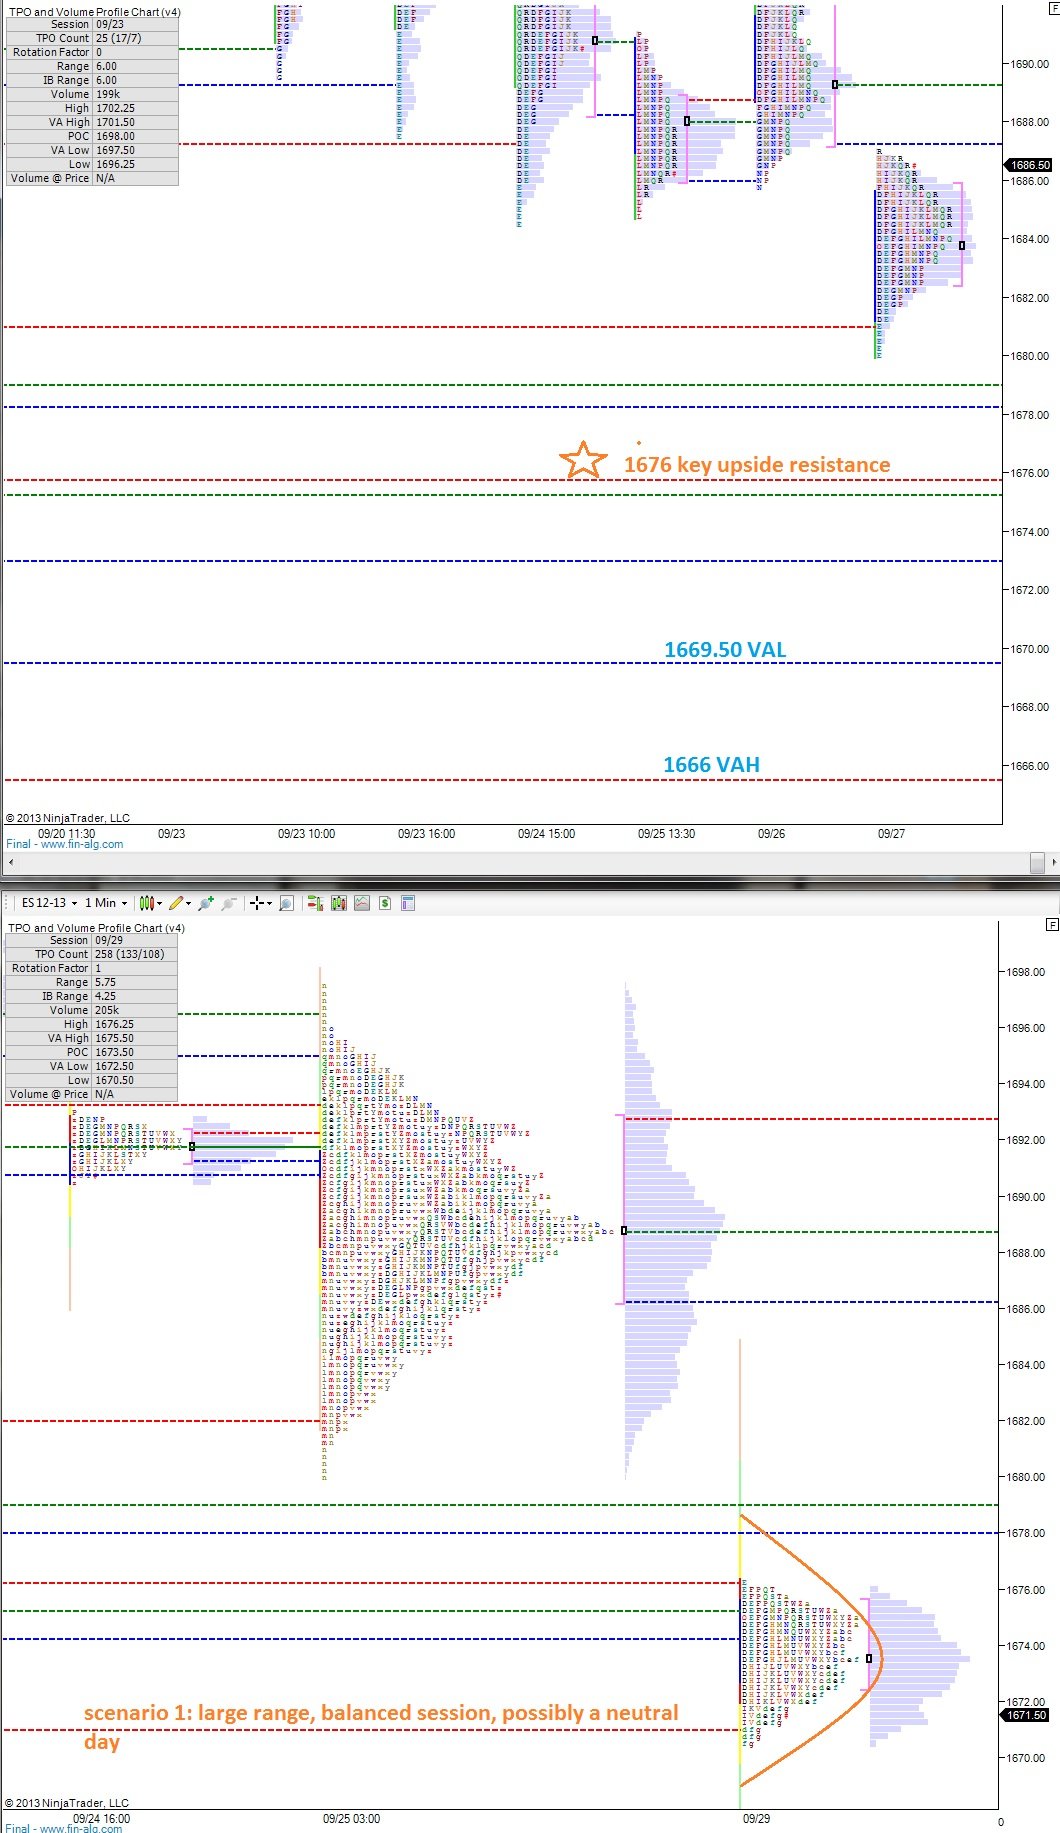
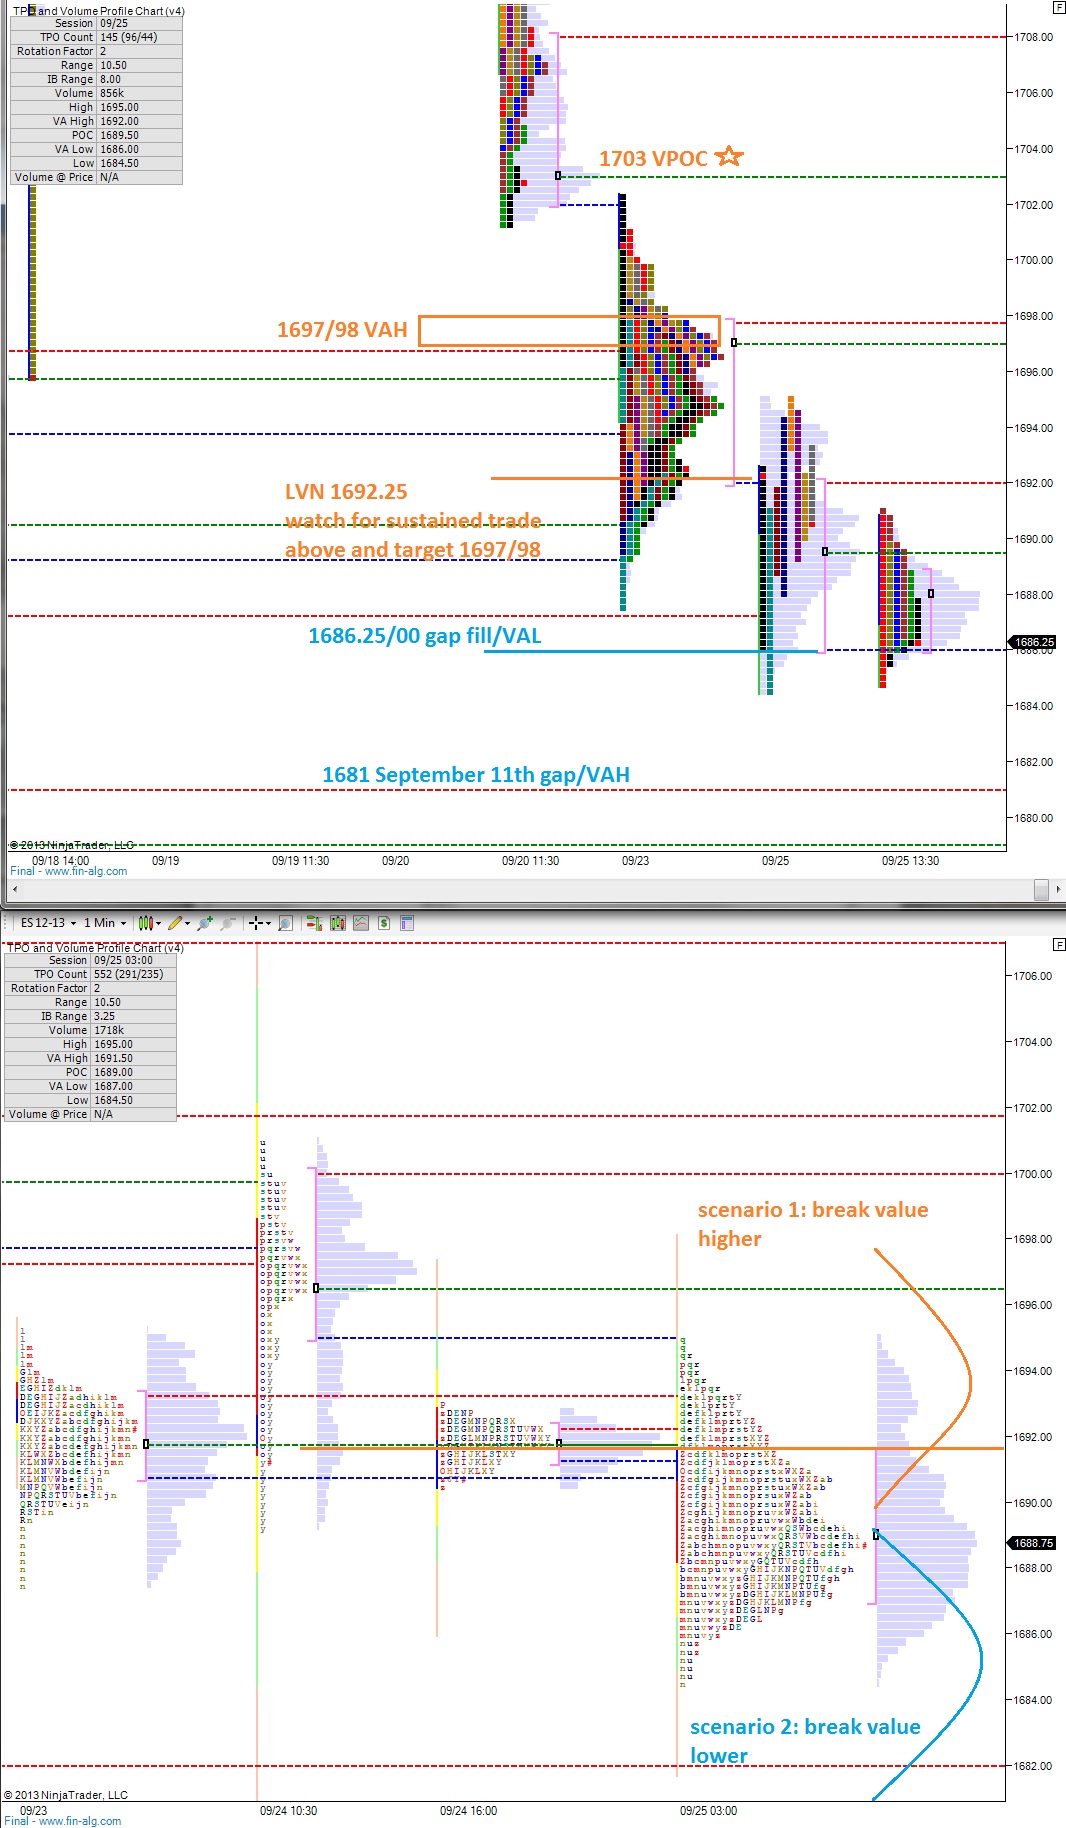
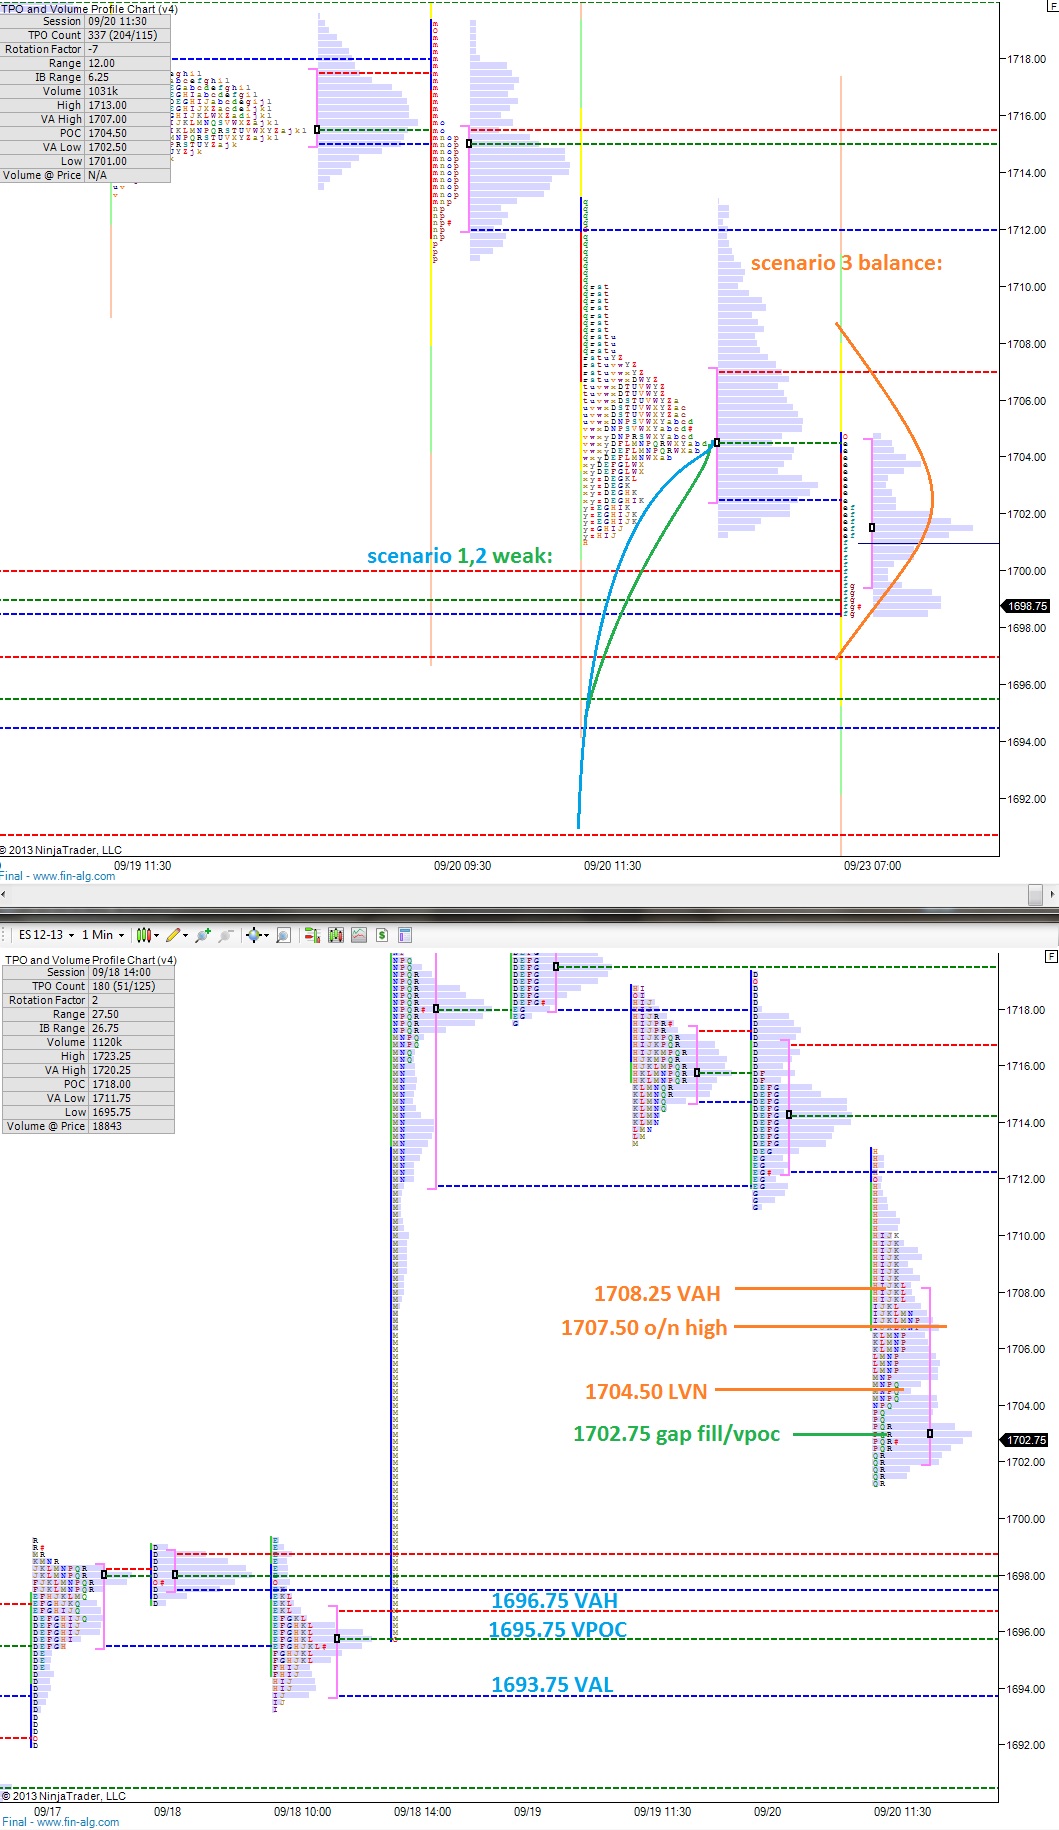
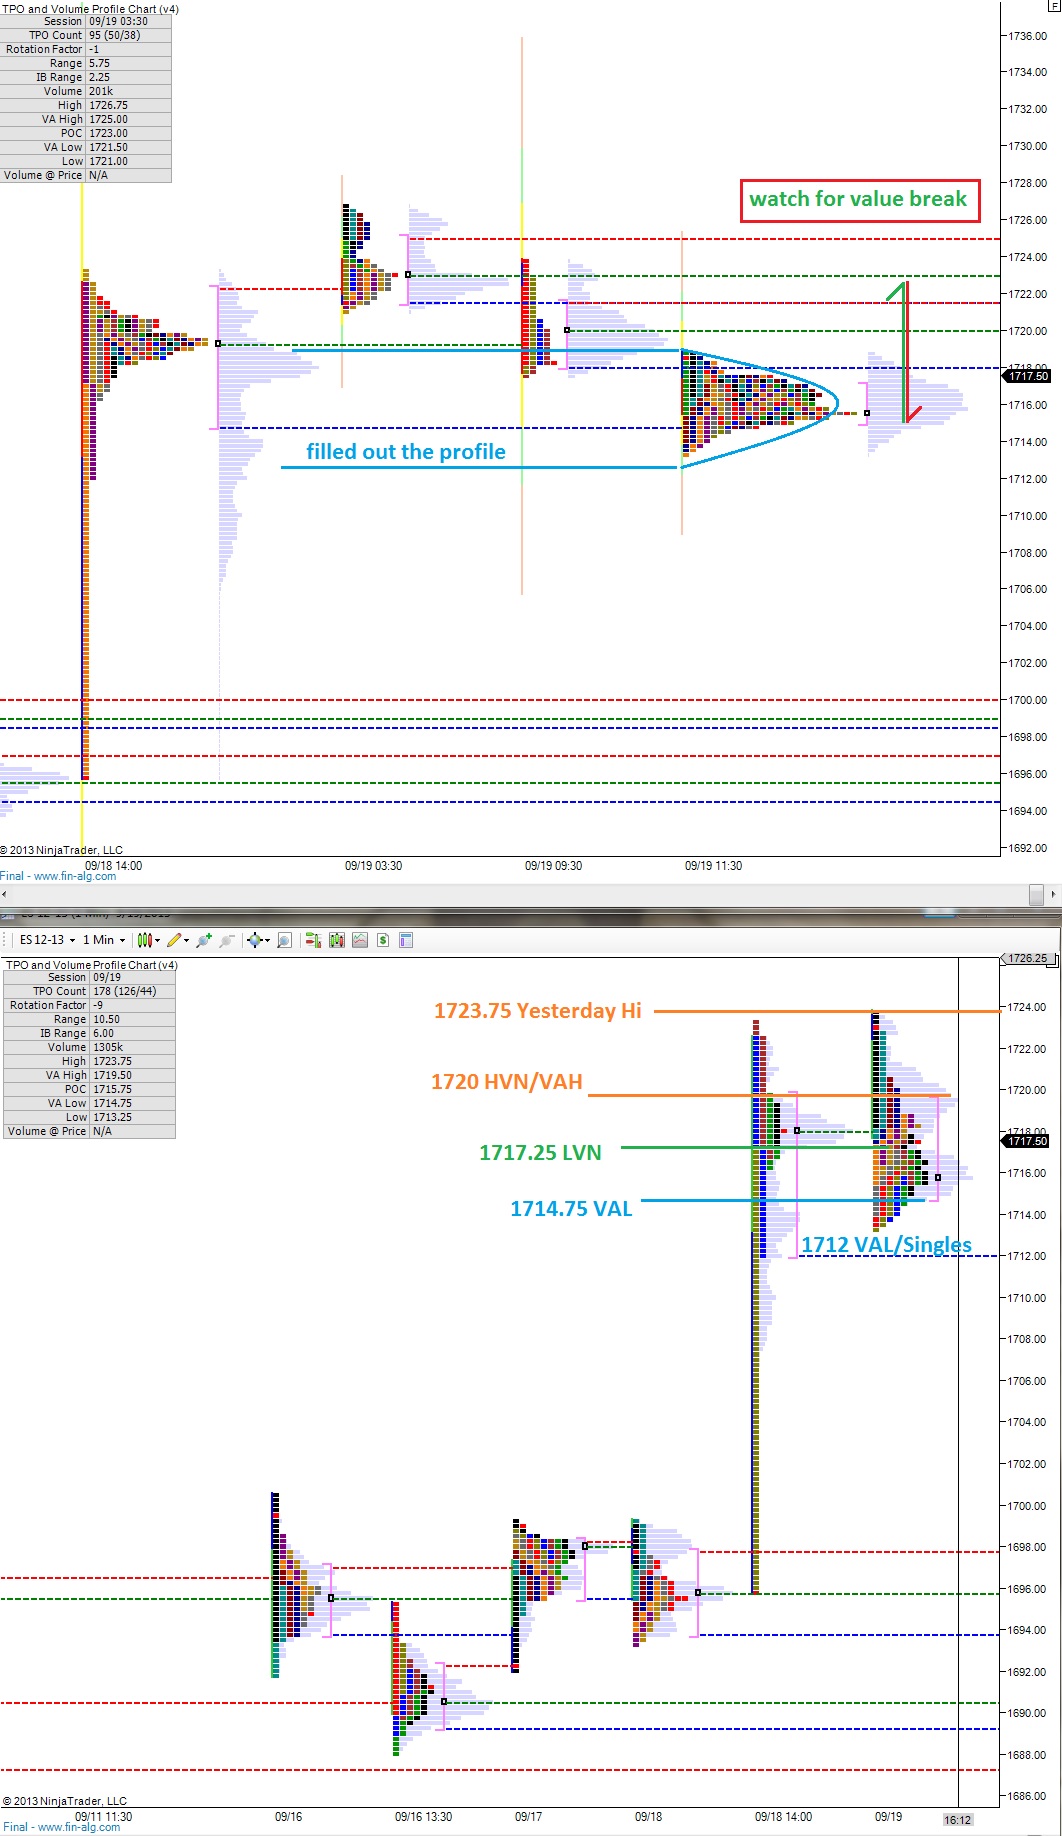
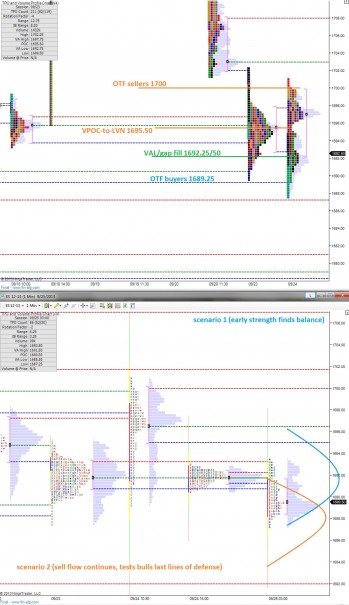
Next I present my usual daily profile analysis, both on the 24 hour profile and the RTH profile.  I like the RTH profile more for defining areas to do business, inflection points, etc.  I use the 24 hour chart to map out a few potential scenarios on the day.  I have only listed two scenarios of setting value in a balanced manner.  If we achieve the high or low of either scenario in short order, it opens the door for a third or fourth scenario of trending.  Keep that in mind when you observe the following market profile charts:

ES_MarketProfile_09252013

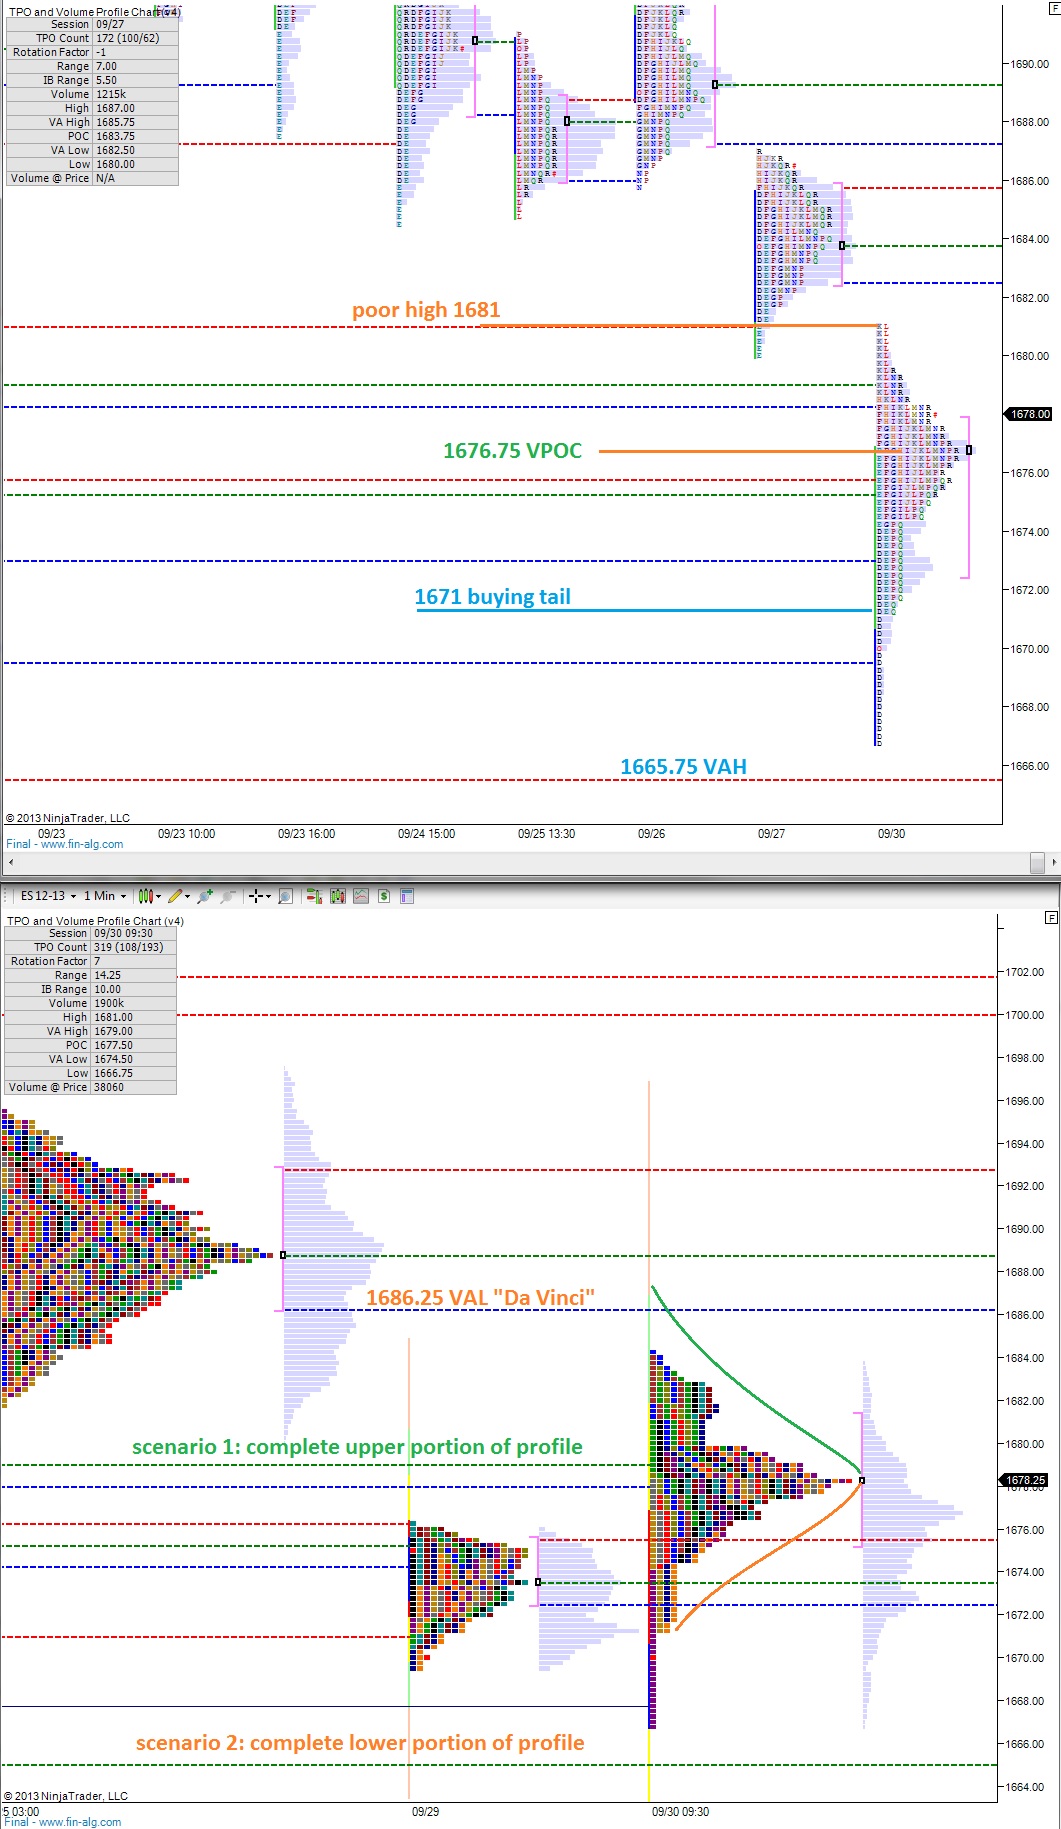
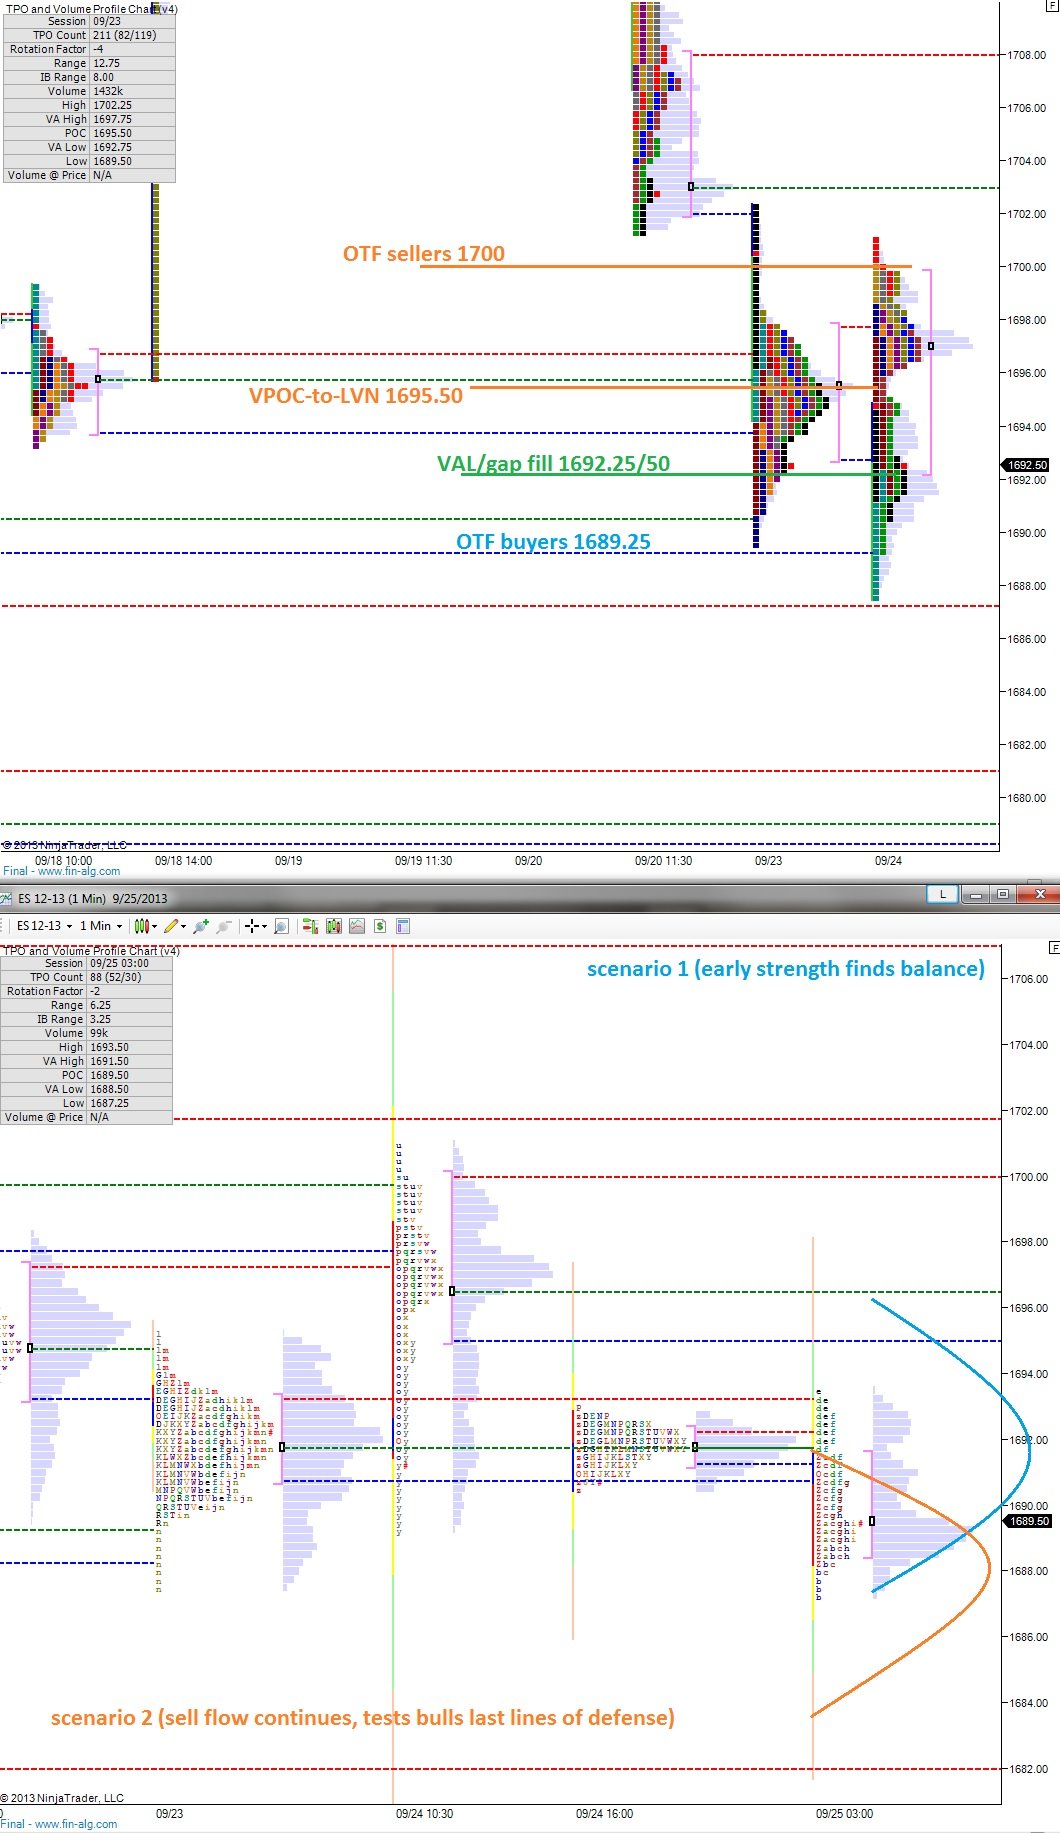
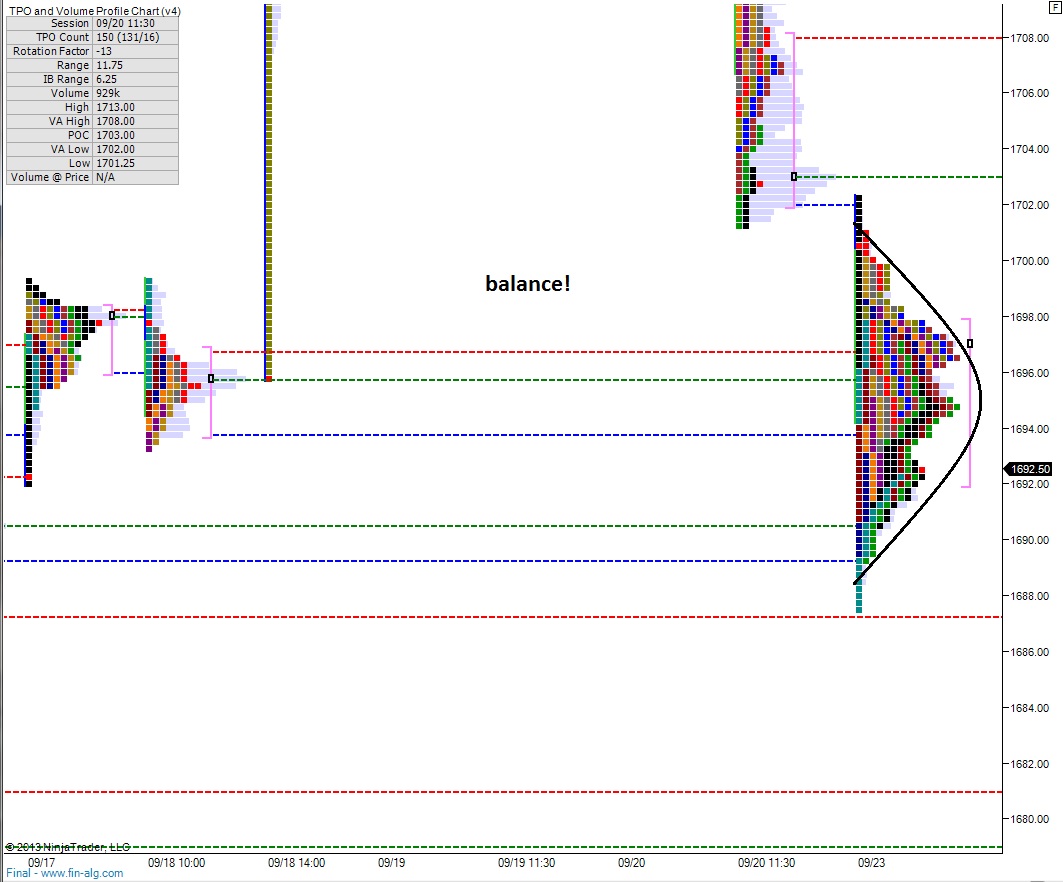
Finally, when I was working the above RTH charts, I found it very interesting that the volume point of control from Monday formed a rather extreme low volume node yesterday.  It is quite the contrasting treatment of 1695.50, yes?  So I merged the two profiles together and it gave me the right picture.  We have, in fact, balanced out:

ES_MarketProfile_0925b2013

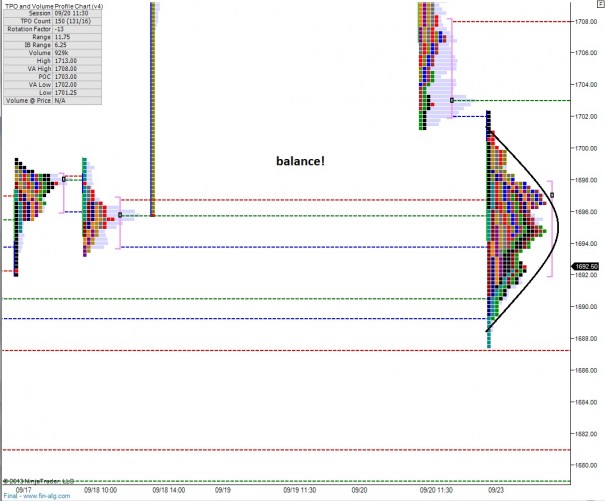
Therefore we must closely observe how the market treats the VAH and VAL of this combined profile.  It will give us a clear picture of the buyer/sellers conviction and capacity to dictate the direction of the tape.  I am considering reducing long exposure if price is accepted (traded greater than ~1hr) below 1684, otherwise I see 1684 as a buying opportunity and any trading above these levels as peddle to the metal long.


Comments »

Weakness Carries Over Into Early Monday Morning

The S&P is on the move still.  The weak Friday action is continuing as US markets come online this frosty Monday morning.

The futures gapped higher a bit Sunday evening and methodically rotated the gap off before initially holding the Friday lows.  Around 5am price took out the overnight highs and was met by sharp-reactive selling which makes 1707.50 an interesting level to monitor today.

The selling is accelerating as a write, and it has effectively erased all of the gains from the no Taper Fed announcement.  Therefore, the broad index will have an overhang of supply as we start the week.

After a fairly long period of quiet consolidation both before and after the Fed last Wednesday, the S&P certainly seems out of balances which could increase intraday opportunities for the astute trader.

I have highlighted key price zones to measure sentiment upon today, and also a few profile scenarios on the following market profile charts:

ES_MarketProfile_09232013

Comments »

Tranquility Ahead of Quadruple Witching

Overnight the markets were very tranquil, perhaps even complacent on an international scale after yesterday’s consolidation tape.  If you look back to 09/18 and the volume profile it produced, you can see how we settled the unfinished business of filling in the volume cavern.

What is important now is which way we break from yesterday’s value.  We may even see a head fake.  But I will be looking for an hour or more of trade above or below yesterday’s value as acceptance away from the value and a cue going into the weekend.

I have highlighted the value area high and low on the second volume profile chart.  The prices below 1712 are very slippery due to the thin profile.

ES_MarketProfile_09202013

Comments »