iBankCoin
Home / Tag Archives: $SPY (page 2)

Tag Archives: $SPY

Sellers To Push First

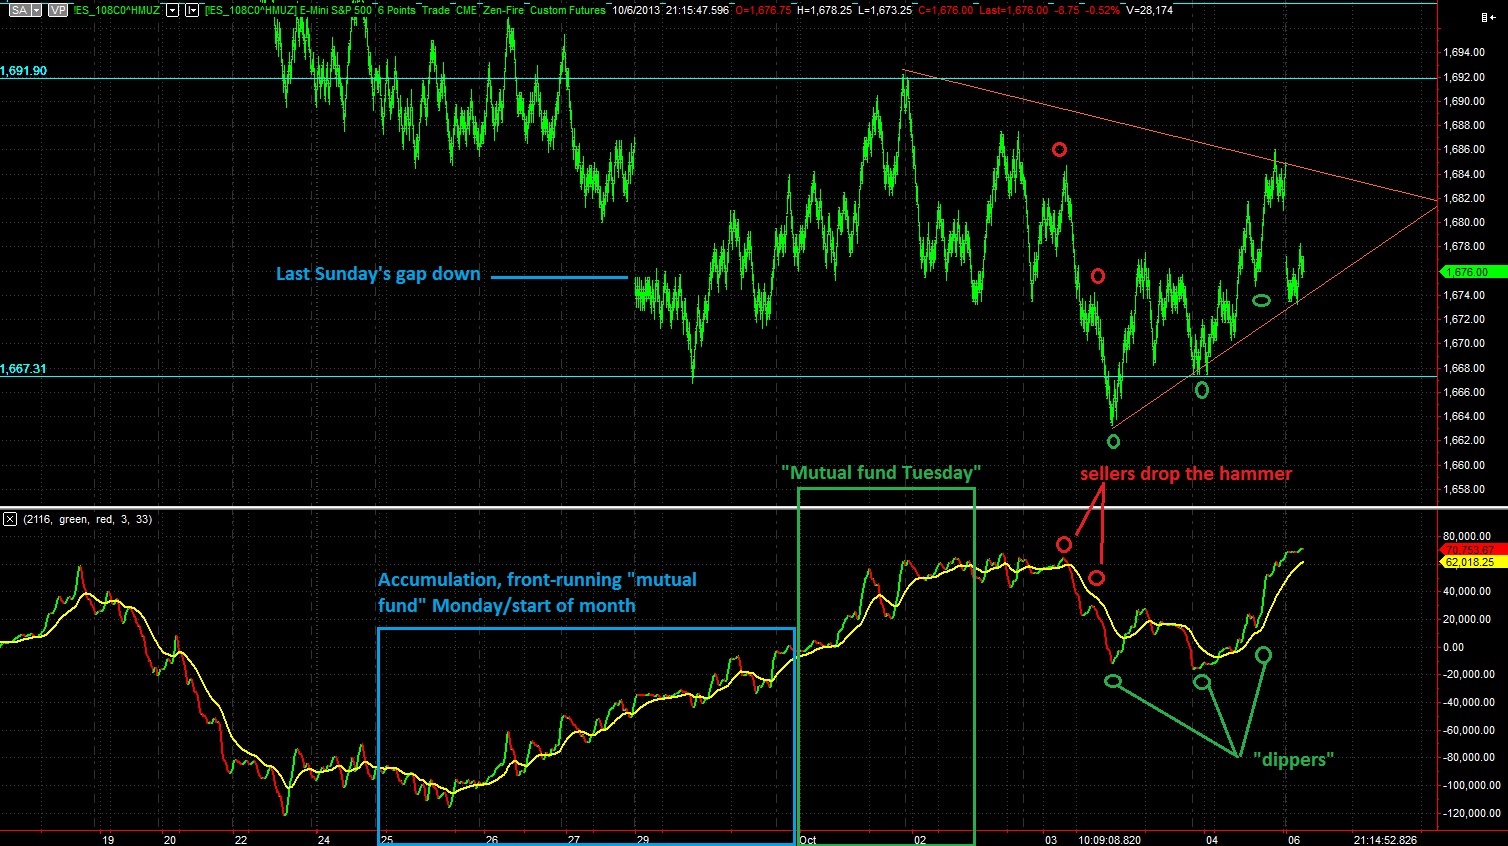
The index futures went for a rip yesterday evening, for a detailed rundown of “the why” check out @chessNwine’s coverage of the event.

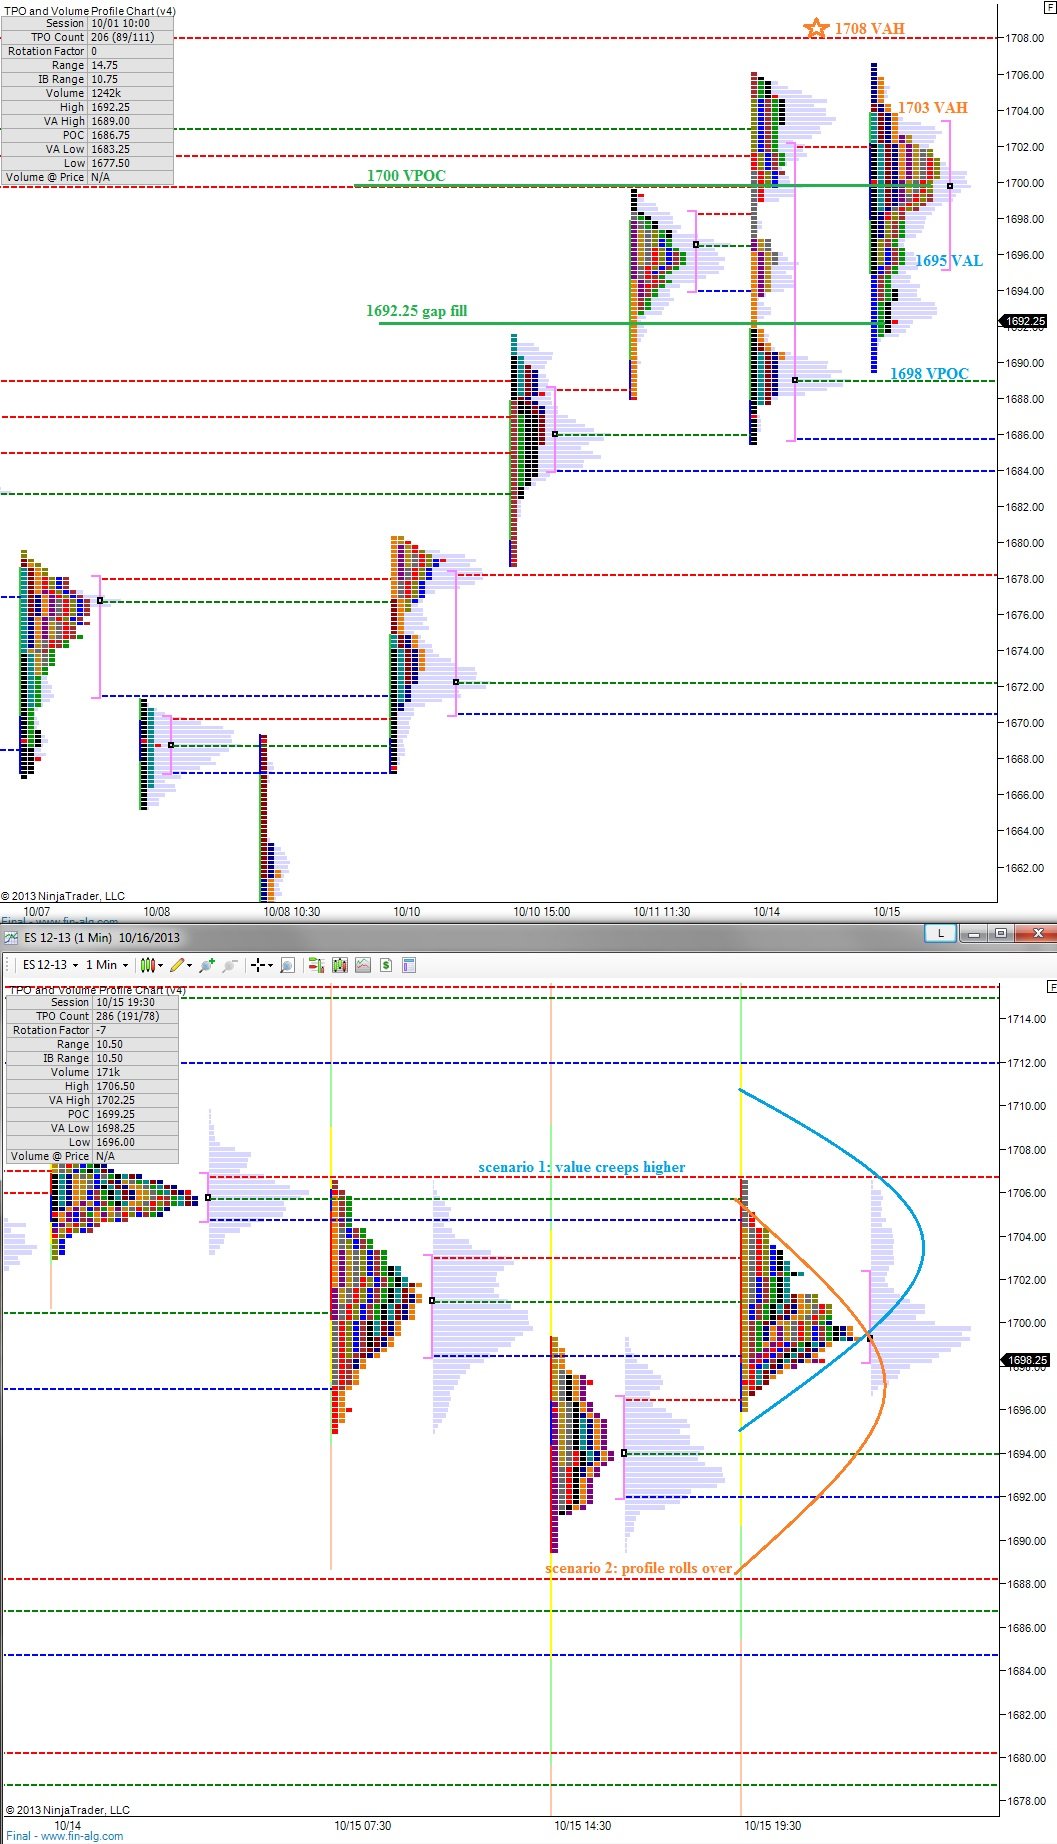
Since then we have mostly faded lower, in a rather gentle manner as the stock market continues its complacency in the face of the dramatic events unfolding in Washington DC.  AS the early AM strolls on, the sellers are making an earnest attempt to get momentum back in their favor and with a decent push soon they could regain control.  I suspect sellers will push the gap fill trade down to 1692.25 before we see what is next for the market.

The overnight profile suggests balance and acceptance which is a solid sign of the longs given the velocity in which we returned to these elevated levels.  However, should we fall out of balance, the prices below look slippery and fast.

Yesterday’s RTH printed a “neutral day” with range extension on both sides of the initial balance.  It settled lower suggesting the sellers had more control of the auction.  These neutral prints tend to occur near inflection points so it is important to not overly discount the power of the sellers here.

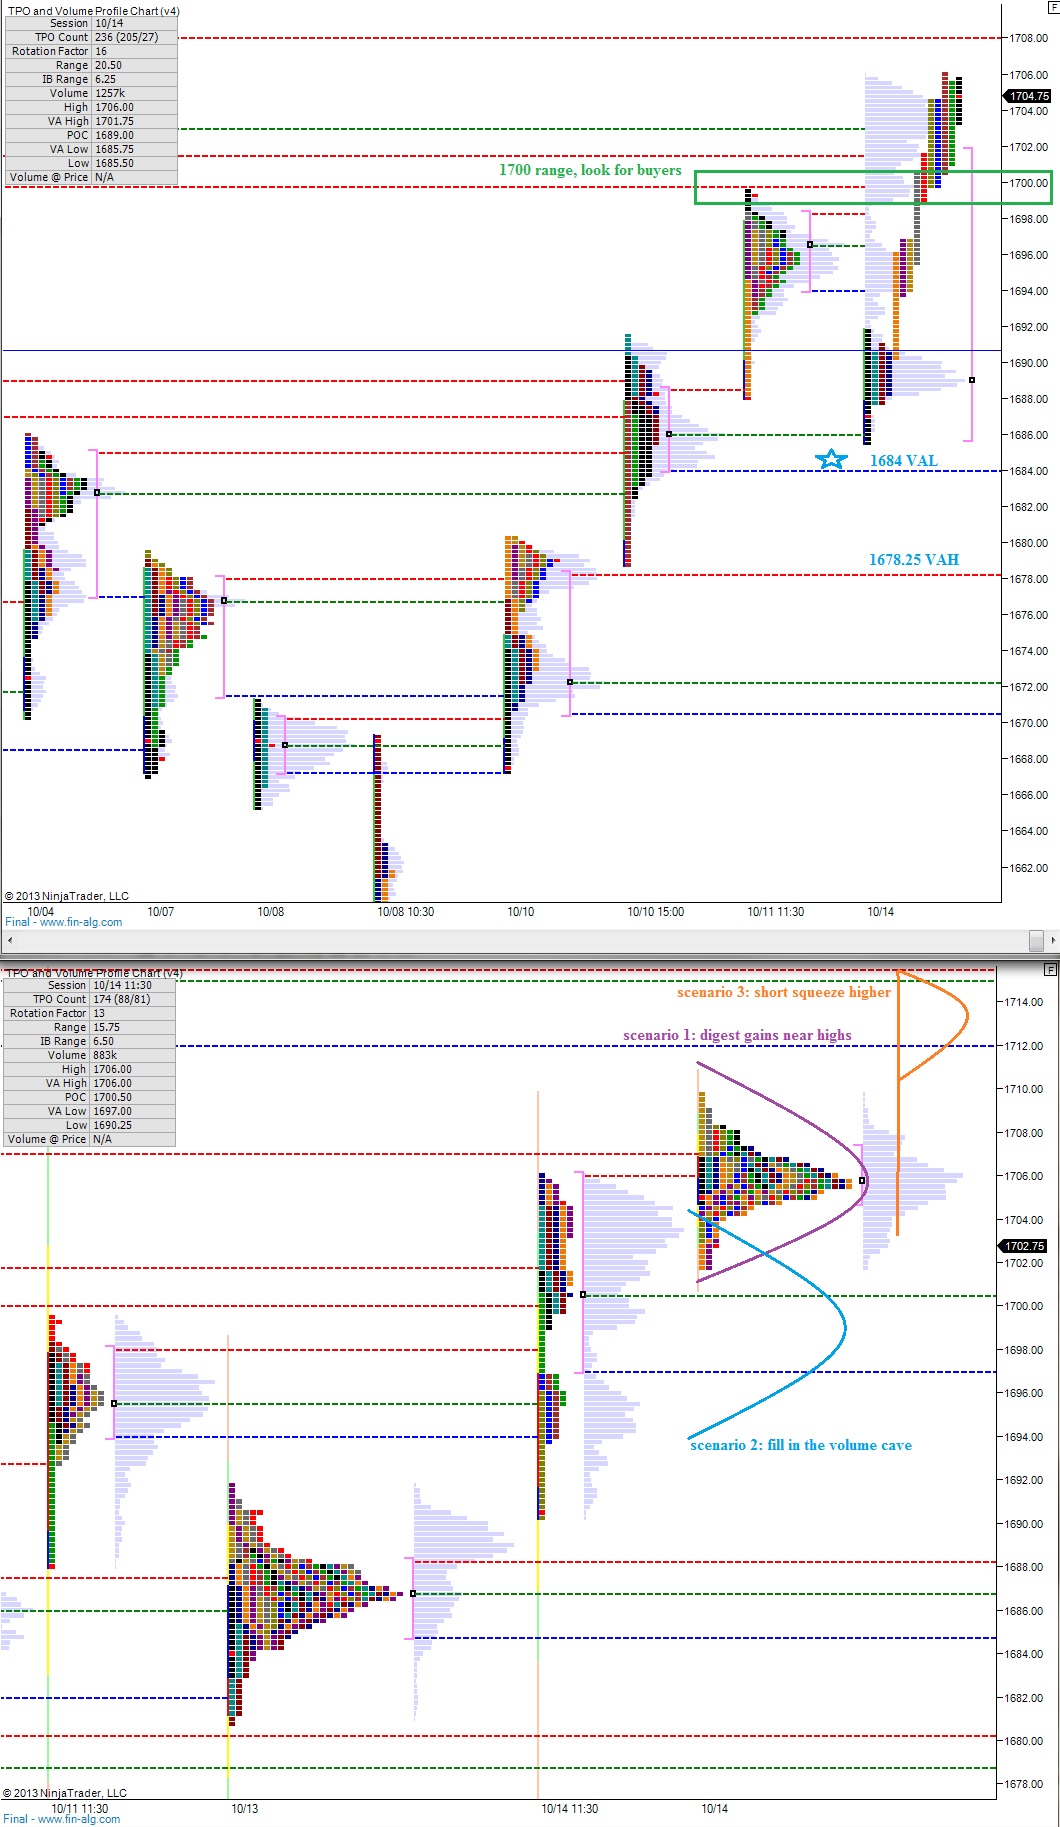
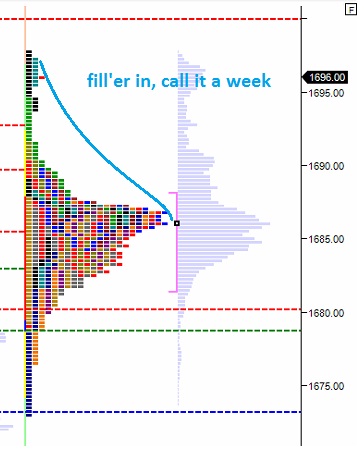
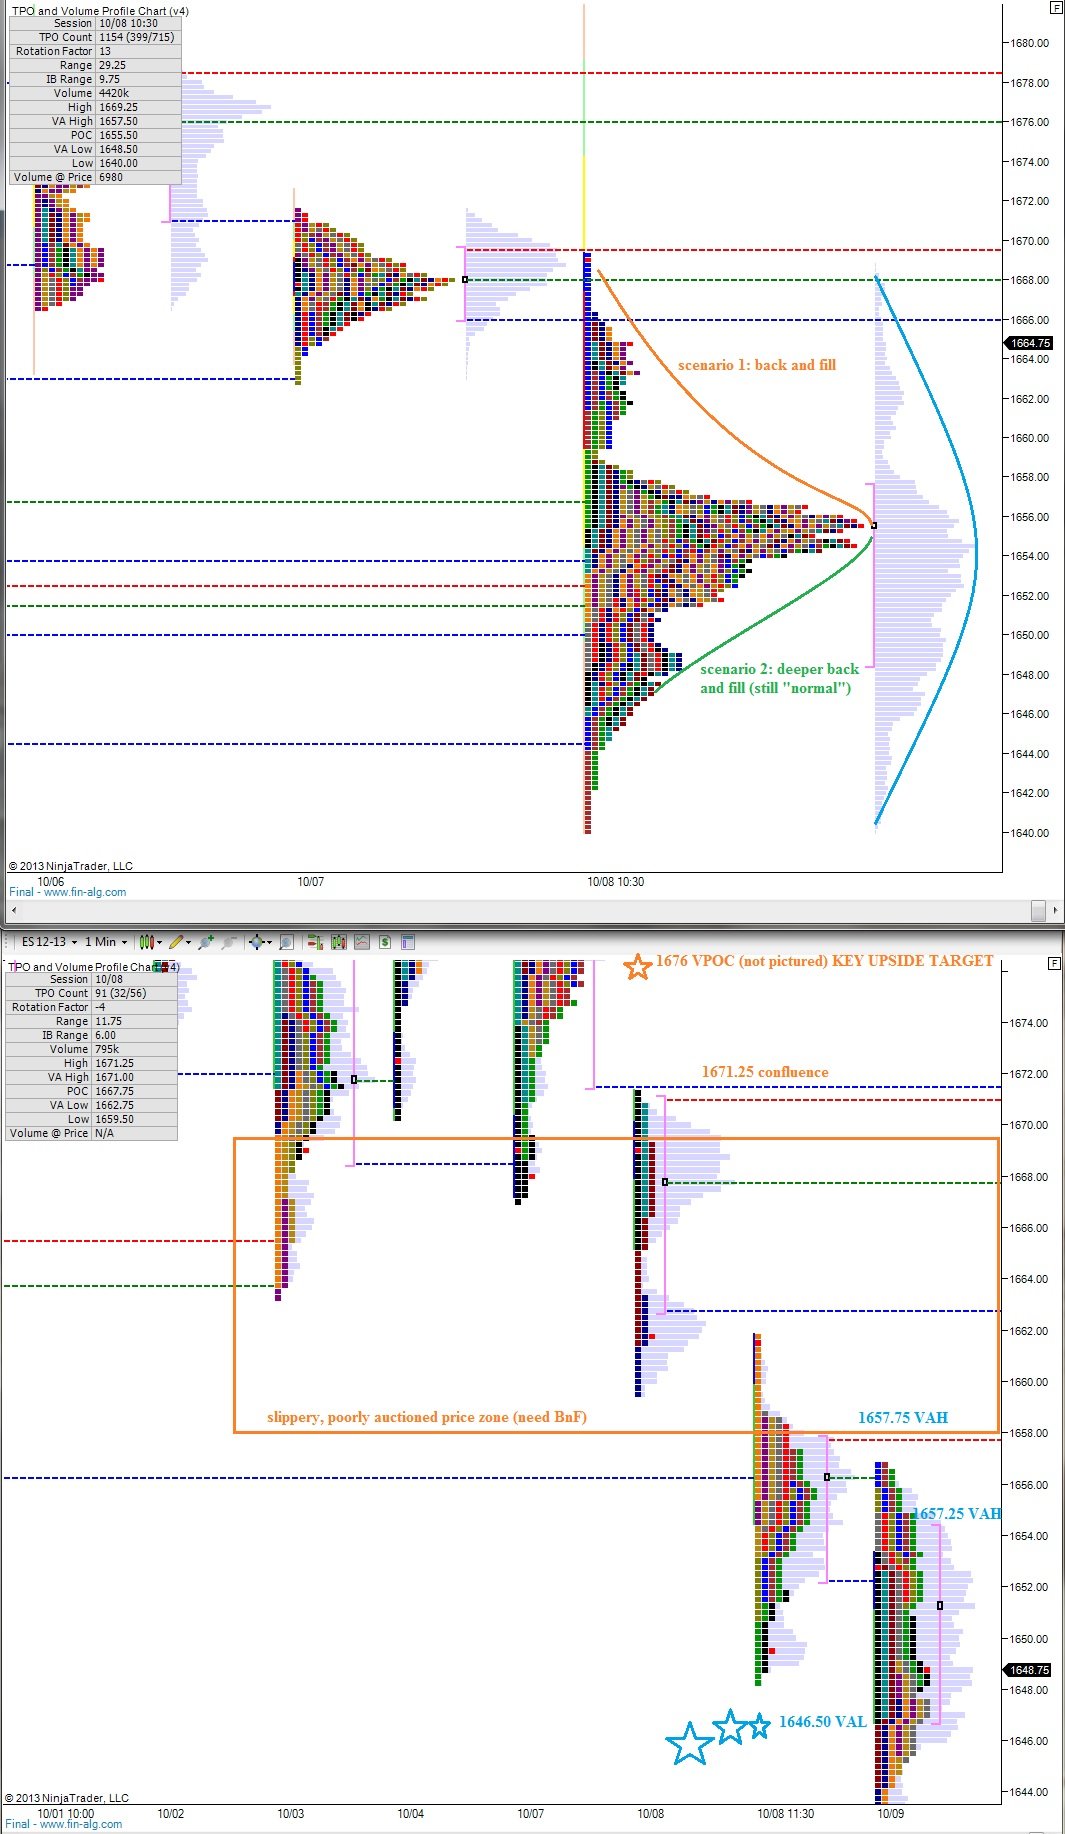
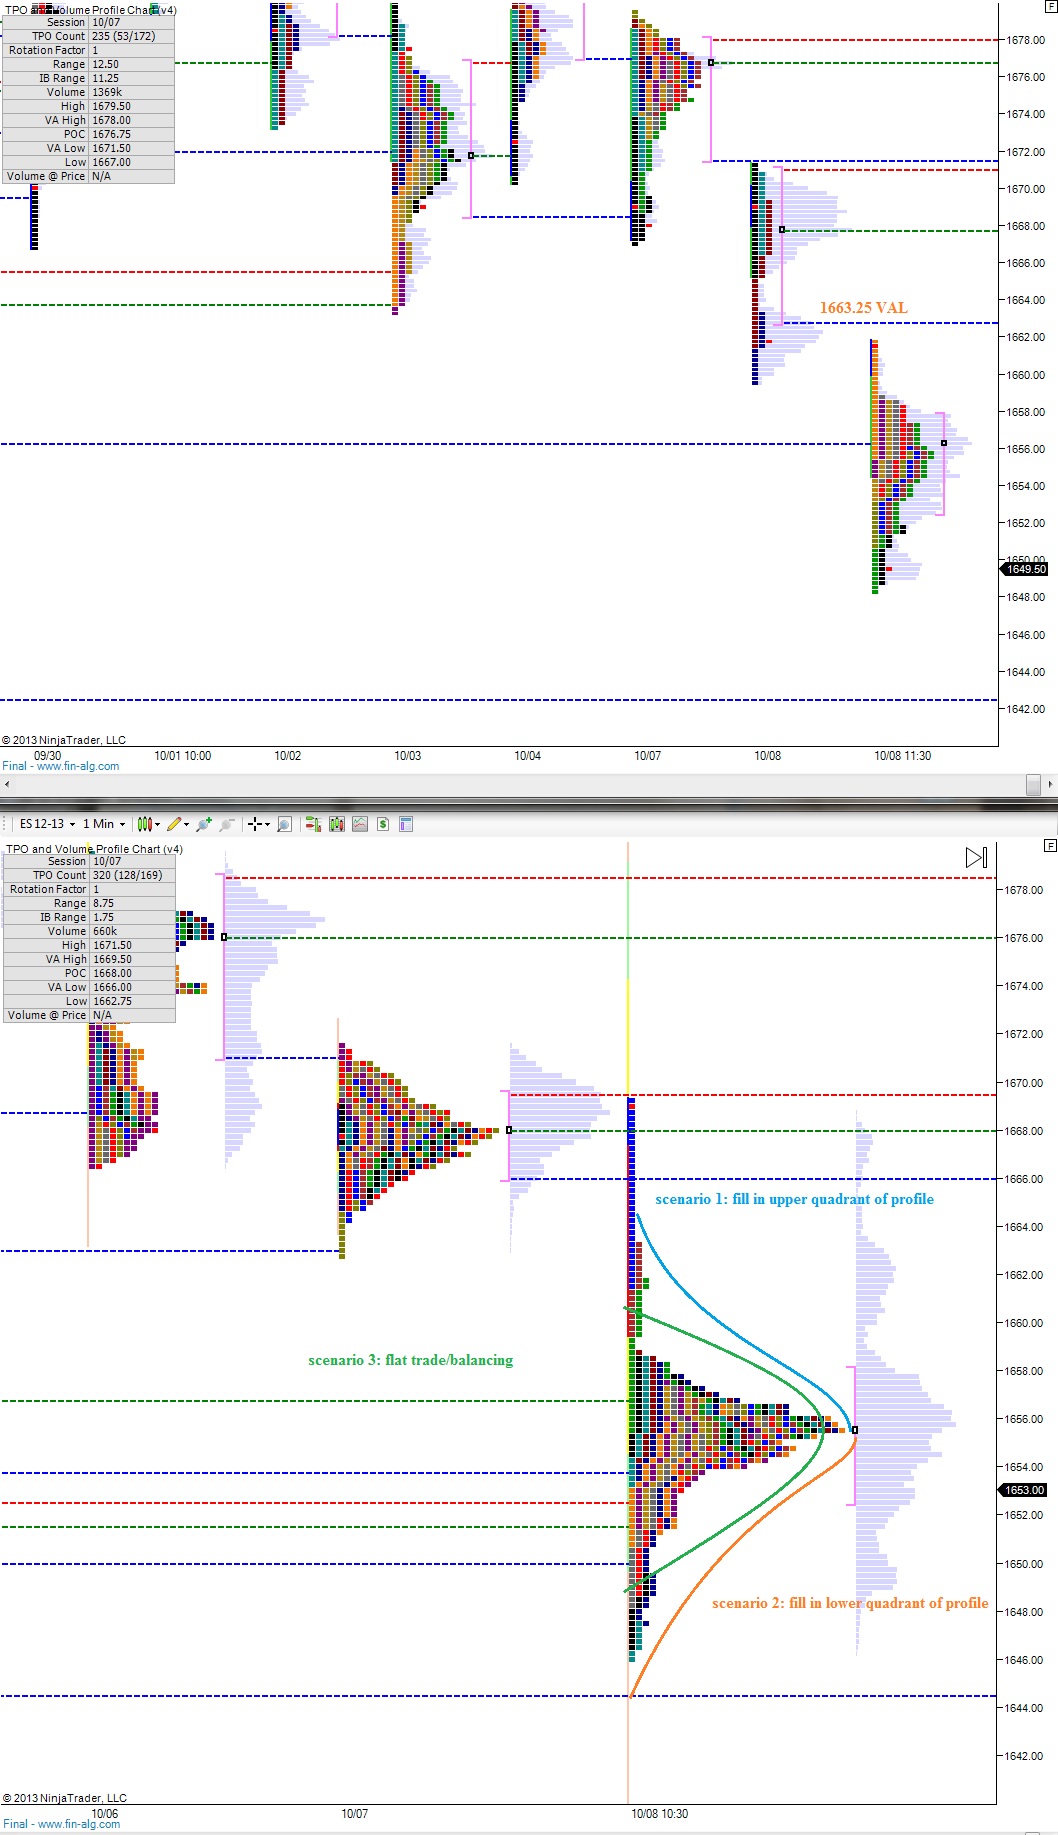
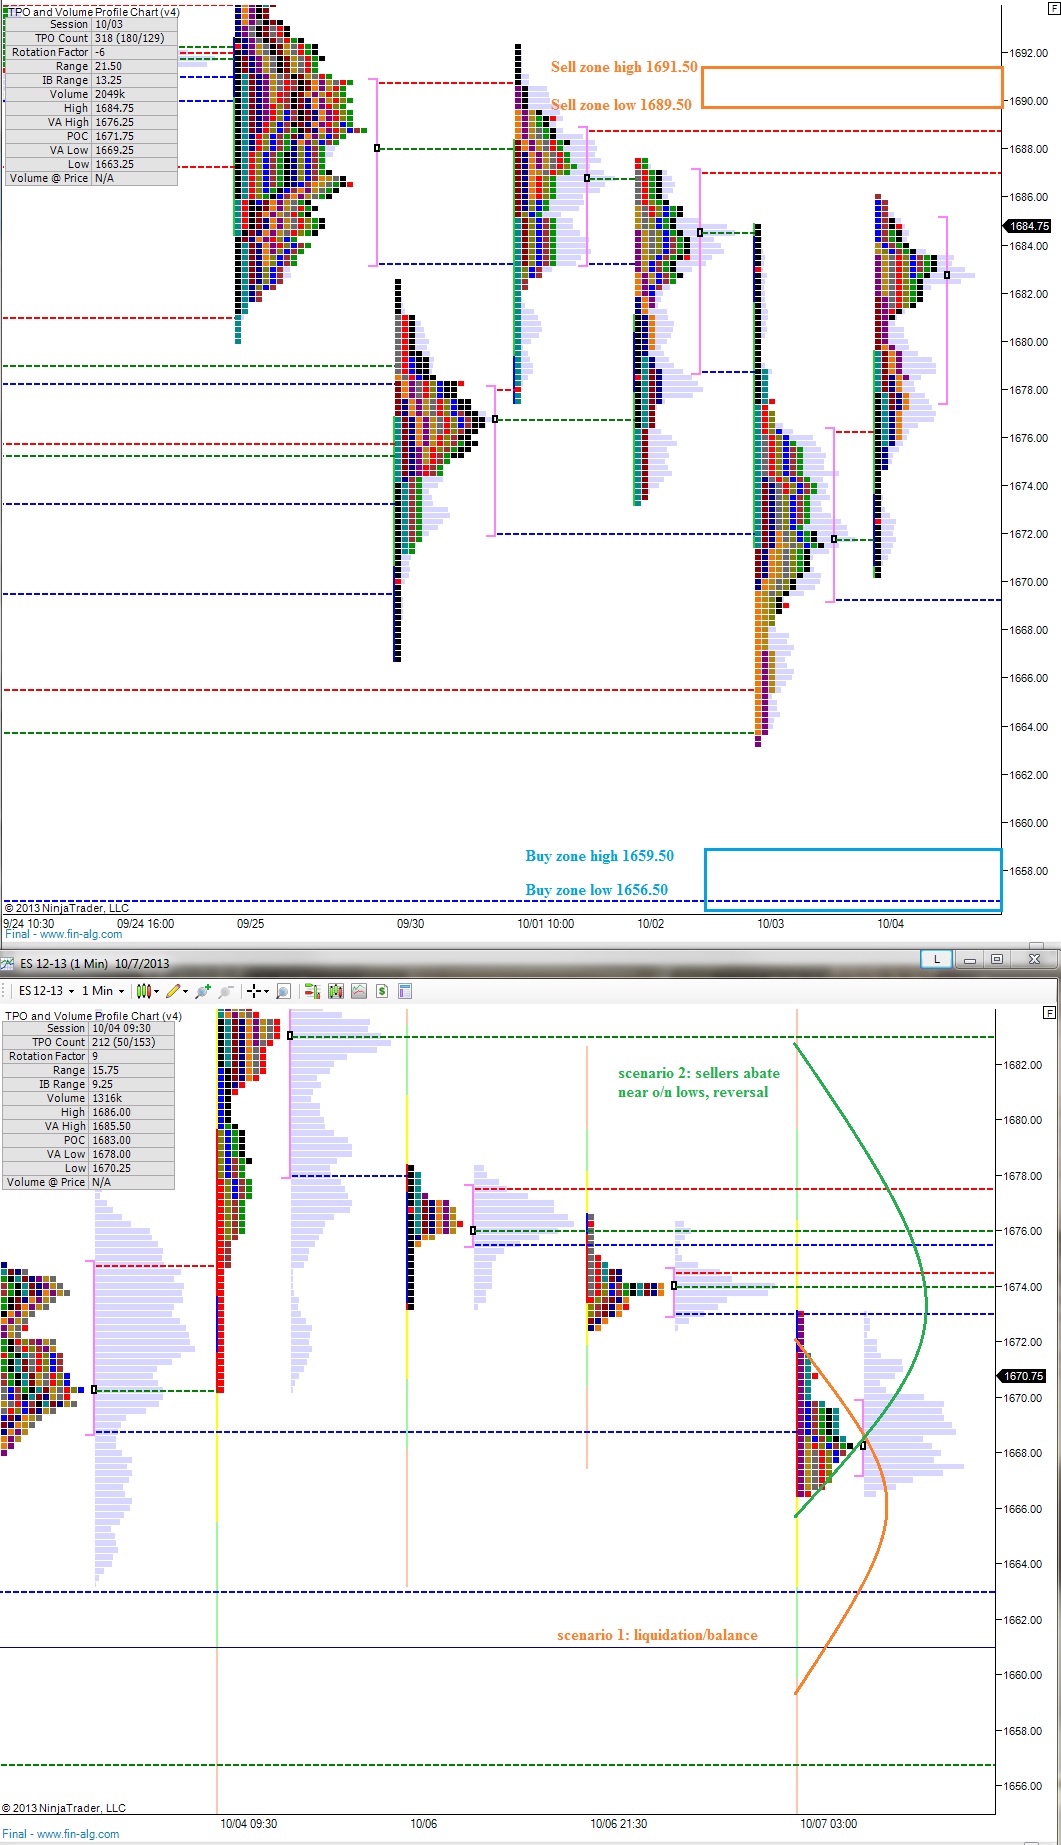
I have highlighted key price levels and a few potential scenarios on the following market profile charts:

ES_MarketProfile_10162013


Comments »

Holding Strong

The overnight S&P market featured a bit of follow through strength early in the evening before balancing out near the highs of yesterday.  Yesterday was an interesting kind of trend day.  It earns the title of trend day since it never made a new low during any TPO period.  The trend day featured a bit more overlap than your standard trend day, and the day also started with a normal auction as opposed to a strong opening drive.  Overall this type of day suggests buyers gained conviction after watching the first hour and a half of trade and subsequently drove prices higher for the remainder of the session.

The balanced overnight market is currently exploring the low-end of current value which may lead to responsive buying early on.  An early test of the 1700 range (1700.50 – 1699) would provide an early puzzle piece to today’s auction.  There is a low volume pocket below these prices spanning all the way down to 1696.  A lack of responsive buying at the 1700 range could lead to a swift trade to the 1696 level.

Some digestion of the recent bull progress may be in store today, but overall control of momentum is back in the buyer’s hands.  The control comes into question below 1684.

I have highlighted these price levels and a few scenarios on the following market profile charts:

ES_MarketProfile_10115013

Comments »

Third Time’s The Charm

The first characteristic I notice when reviewing the market profiles printed last week is the fragmented nature of the distributions.  Price is bouncing all over the place while it explores buyers and sellers in search of the perfect price.  As we dive into earnings during October with Washington DC dramatics occurring, the market is having a difficult time establishing value.

We gapped lower Sunday evening for the third week in a row.  The previous two occurrences saw follow though to the downside before buyers showed up to buy the dip and press us above the gap point.  Will the third gap lower yield a solid victory for the sellers?

Price formed a wedge overnight as it worked higher into the gap.  As the USA comes online, we are seeing an early attempt to break down from the wedge.  The market is still very choppy in terms of momentum control early on, with no clear victor during the overnight trade.

The profile suggests a relatively balanced overnight trade with an overhead shelf at 1688.  This is the price where we shot higher last Friday before balancing out over the weekend.

I have mapped out a few scenarios and price levels of opportunity on the following market profile charts:

ES_MarketProfile_10114013

Comments »

Big Moves Overnight

The market rotated all over the place last night, trading about 13 handles lower from yesterday’s close before finding some buyers.  Since then and throughout the course of the evening the market rotated higher in a very orderly manner to regain the lost ground and managed to print a new swing high around midnight.

The overnight high at 1689 is interesting because we typically do not print the high water mark of a rotation during the overnight hours.  This is a bit of context that cues us we may see higher prices during an RTH session before heading lower.  However, there is no timing associated with this context.  It may happen today or next week and there is always the possibility it never gets breached at all, but it does exist.

The S&P coiled up over the early am hours and appears poised for a quick move early on.  After that occurs, my expectation is for a consolidation day.  Bulls would love a quiet market which resides primarily in the upper quadrant of yesterday’ large candle.  And that is my core expectation on the day.

However, emotions continue to run high and this is a choppy environment with asset correlations creeping up, so it is important to prepare for sudden moves.  I have highlighted a few price levels below on the RTH profile chart, and buyers do not want to see trade sustained below yesterday’s VPOC at 1672.25.  That would indicate value was unable to migrate higher with prices and that the true value of the market is not as high as price.

I have highlighted these prices and a few scenarios on the following market profile charts:

ES_MarketProfile_10112013

Comments »

Back and Fill P.2

We started seeing the early signs of balance forming yesterday which prompted us we are trading in a back-and-fill environment.  The beauty of market profile is the same as your favorite swimsuit super model—symmetry.  Nature has the fascinating ability to form near-perfect symmetry everywhere from plants to galaxies.

So when we began observing an incomplete, but early forming balance (read symmetrical bell curve) we had a contextual cake to begin baking.  We saw a fantastic distribution forming last week too after the selloff.  What is important when building these concepts is not only anticipating its formation, but also watching how the market behaves post formation.

Our last formation broke lower.  Perhaps this one will do the opposite.

On my bar chart, I again see an inverse head and shoulder pattern.  It forms as follows:

Left shoulder – 10/08, 16:30 – 1647

Head – 10/09, 11:26 – 1640

Right shoulder – 10/09, 17:14 – 1647

Neck – 1657

MM target – 1674

Again, nature is offering us symmetry.  Does that guarantee we trade in a straight line to 1674?  Of course not, we are still backing and filling.  But the formation is in place and our second favorite mathematician  Fibonacci and our market profiles point to a major upside target of 1676 on the next rotation higher.

The market is attempting to establish value in a volatile environment.  A huge seller could come in and change all of this.  But sans large sell flow, by vision for today is backing and filling with an eventual attempt to rotate higher.

Note: A breakdown below 1646.50 could jeopardize this entire formation.  Caution if trade sustains below this level.

I have highlighted the forming distribution via a few scenarios and also important price levels on the following market profile charts:

ES_MarketProfile_10102013

Comments »

Back and Fill

The markets caught a bit of a bounce during the early evening hours of last night’s globex session from the Yellen news and perhaps also from the Alcoa earnings beat.

The move recaptured about eleven handles of yesterday’s downside before stalling out.  It appears not that aggressive sellers stalled the move, but instead that beleaguered buyers were not overly enthusiastic about the new developments.  As we approach US cash open, the market is seeing a bit of selling creep back onto the tape.

On the 24 hour profile, I see the early formations of balance which may induce some “back and fill” type trading.  However, on the bar charts, I am observing the early signs of an inverse head and shoulder pattern with an upside target of 1667.

The bar chart formation paired with the over reactive nature of yesterday’s trade suggest to my eye a mean revision-type bounce higher is more likely today.

Upside targets are 1660 then the measured move target of 1667 during today’s trade

I have highlighted these levels, a few other areas of opportunity, and also the back and fill scenarios on the following market profile charts:

ES_MarketProfile_10092013

Comments »

Value Migrating Down

The hard selling into the bell yesterday continued on into the early overnight hours.  The action was effective at breaking consolidating prices to the downside and testing recent lows.  We are seeing a bit of buy strength working into the market as the US comes online and it will be interesting to see how we handle it upon opening.

There is currently a gap in place below which could lend itself to a fill do to its close proximity to our current prices.  Should we then lose 1667 intraday, I believe that sets the stage for a leg lower.

Downside target continues to be the range from 1659.25 to 1657.00.  Should we see strength coming into the market, I will be looking for reactive selling first at 1676 then at 1690.  The sellers lose control over 1692.

The overnight profile suggests balance via printing a near-perfect bell curve.  The move away from here may start with a head fake and then price slashing through the entire range quickly.

I have highlighted a few scenarios and the migration of value on the following market profile charts:

ES_MarketProfile_10082013

Comments »

Playing The Outside of The Field

This week I will be more actively trading the order flow in the /NQ contract.  However I still see an opportunity to trade the /ES, but my goal is to hone in on one good trade idea, a fade from the outside of the range, and only take one or two trades a day.

Last night I highlighted a consolidation formation occurring in the /ES and it has begun breaking down.  The primary support has not yet been taken out, but we are in a momentum environment where it looks vulnerable.  Although the move away from this consolidation will pack serious energy, I see an opportunity to fade the move, even if only for 2-3 handles.

I have highlighted that opportunity on the following market profile chart and also I highlighted a few possible scenarios on the second market profile chart below:

ES_MarketProfile_10072013

Comments »

The Market Needs More Power

As I have discussed in the past, one of my favorite data to gather and track is cumulative volume delta (CVD) on the front-month index futures.  Considering the S&P futures are the most liquid financial instrument in the world it is important evaluate the volume a bit further.

CVD = volume traded at offer – volume traded at bid

Taking a look at the price action to start the month in conjunction with a moving average of the CVD offers us interesting insight into the overall market behavior.

The futures opened trade last Sunday in a similar fashion to tonight’s gap lower.

You can see pressure being exerted on the offer early in the week, especially when Tuesday hit and all the hot new money was put to work.  Unfortunately, all of the power exertion was effective at only retracing into the upper bracket of our prior range.  Like our distant relatives would study the stars and name constellations, the near-perfect distribution of volume formed during our prior range was named Da Vinci’s Brush.   All that buy flow was capable of testing value area high and nothing more.  There we found a patient, quiet seller resting on the offer.  Actually, the seller may have been large enough absorb all of Monday’s buy flow.  A whale, if you will.

It seems as if the more aggressive sellers caught the scent of this whale around the third and began pressing hard on the bid.  The selling force was enough to reject the Da Vinci range and send us to new lows where again, we found dip buyers.

So we know where the buyers are and where the sellers are. Most importantly we know their battle lines are converging.  The victor has much to gain with volatility on the rise.

The seller, our whale, feels bigger and more patient than the buy flow.  If the buyers are to pull a victory this week, we are going to need more power.  However this market has been unforgiving to bears all year long.  We have distracted minds watching the bureaucrats and political emotions are running high.  The overall climate is a combustible mixture much more volatile than a Tesla Model S battery.

Gentleman, you should take action according the how the following consolidation resolves:

ES_Sentiment_10062013

Comments »