iBankCoin
Home / Tag Archives: $SPY (page 4)

Tag Archives: $SPY

Baking a Contextual Cake

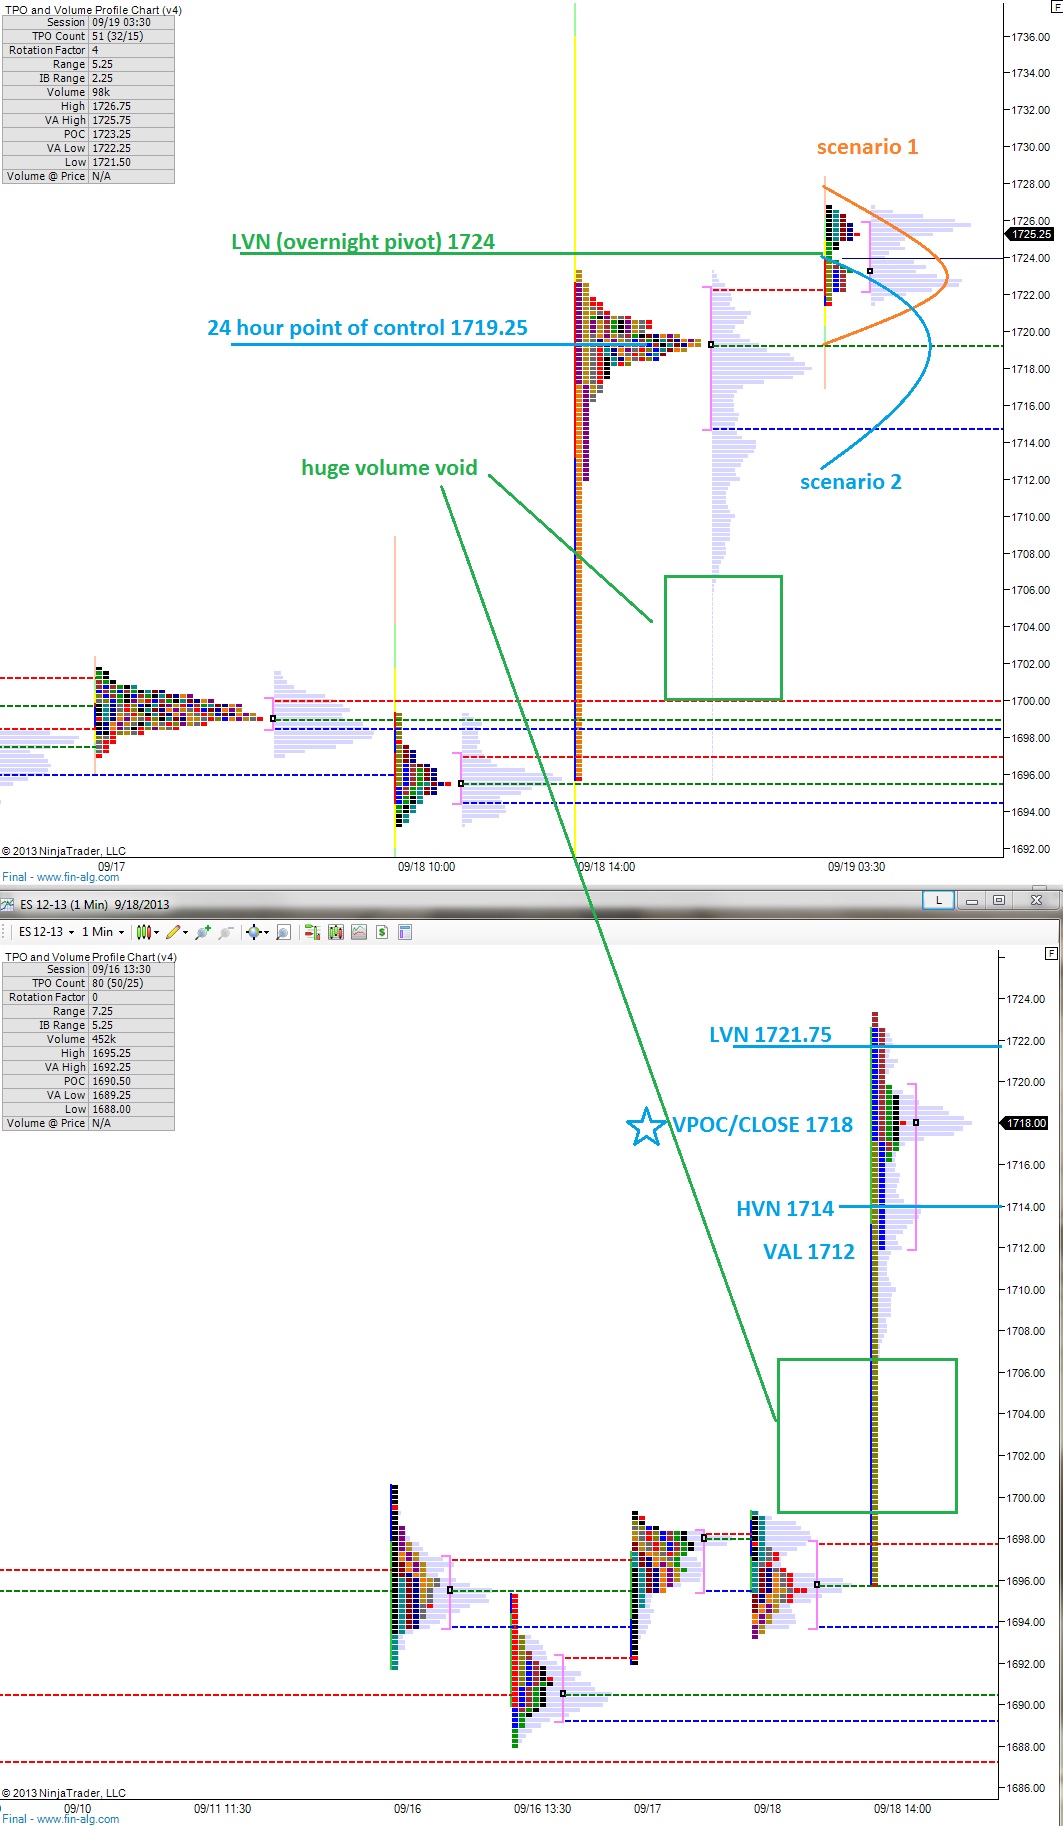
The overnight session featured follow through strength in the S&P, creating a contextual piece of unfinished business.  Making swing highs/lows outside of regular trading hours is a very uncommon occurrence, thus we can build an expectation into our trading mindset today that the overnight high is vulnerable.

The velocity of the order flow at 2pm yesterday left some unfinished business below too in the form of a cavernous, toothy profile.  These types of volume voids tend to behave as magnets because nature abhors a vacuum. However, much like pressing two magnets with the same polarity together, you can find these caves initially behaving as hot plate-esque support.

The overnight profile suggests a lack of balance with two well defined distributions and a low volume node separating them.  It suggests other time frame (OTF) traders were active overnight, and the buy orders continued to flow at a greater force then could be abated by selling until 6am.

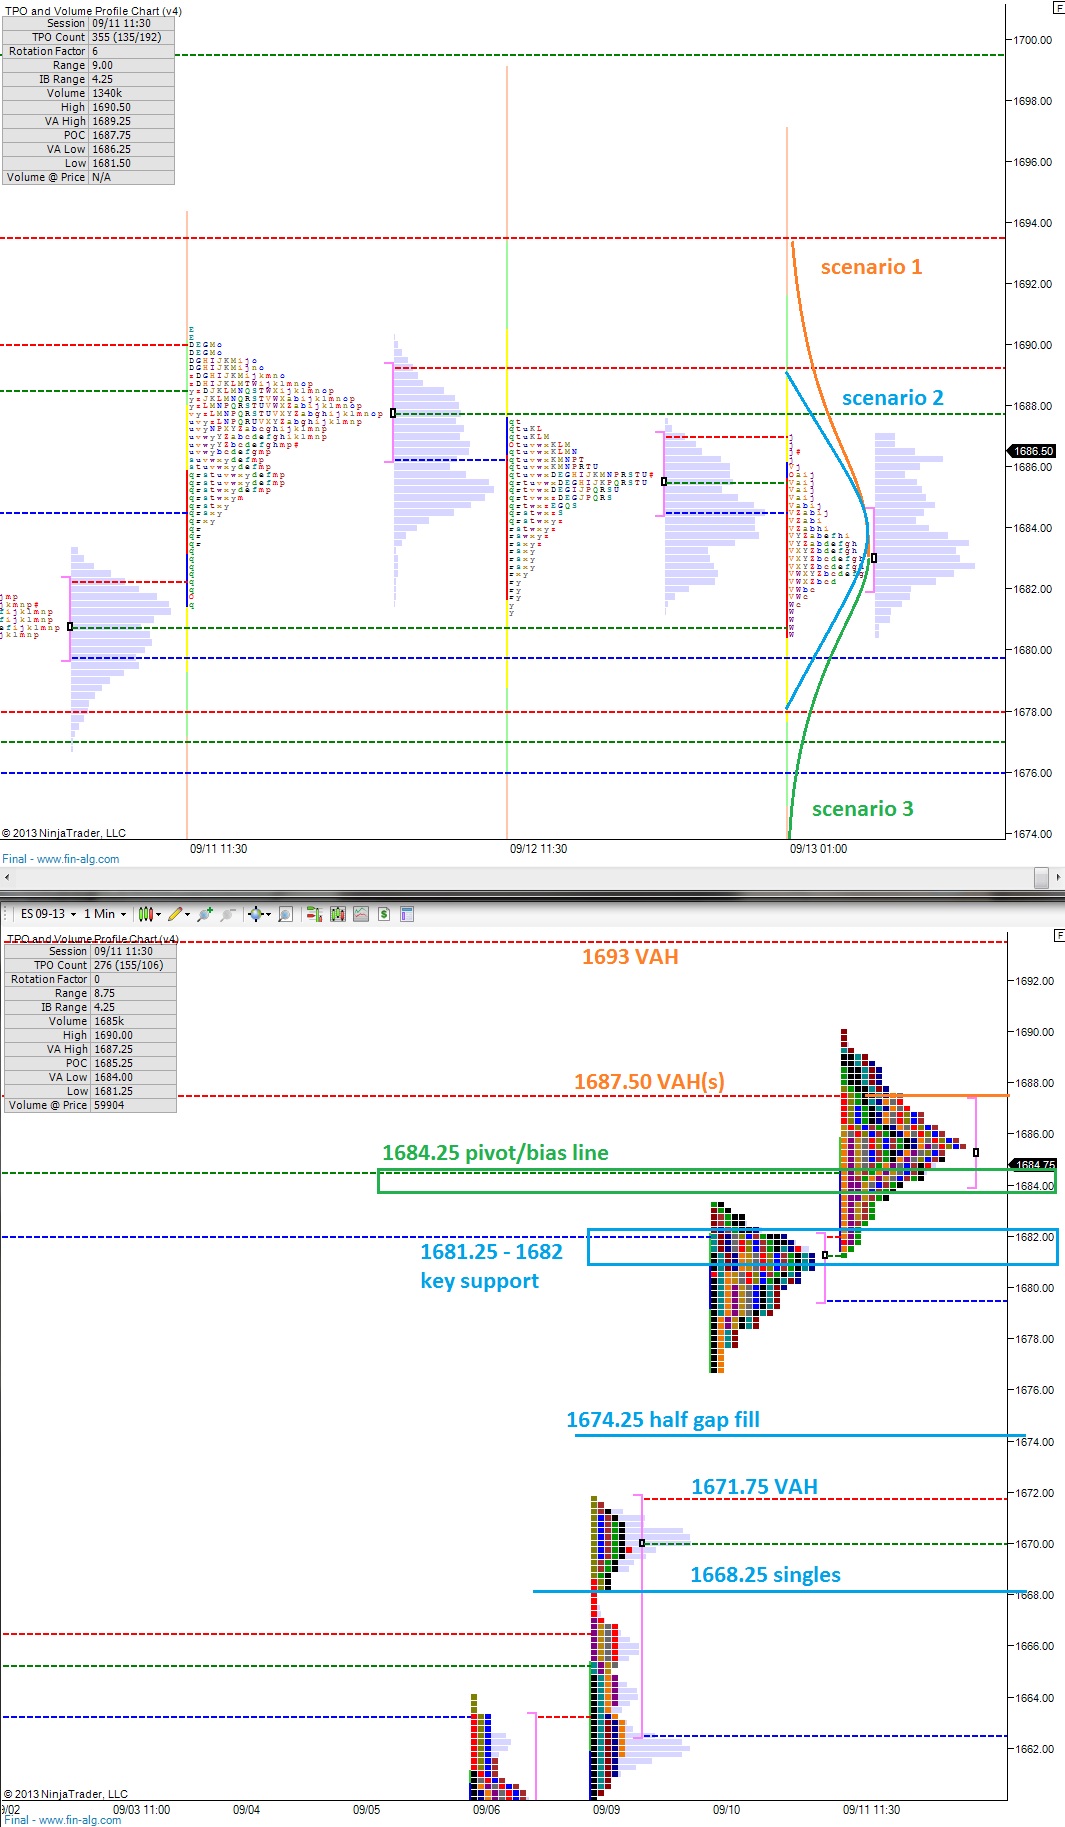
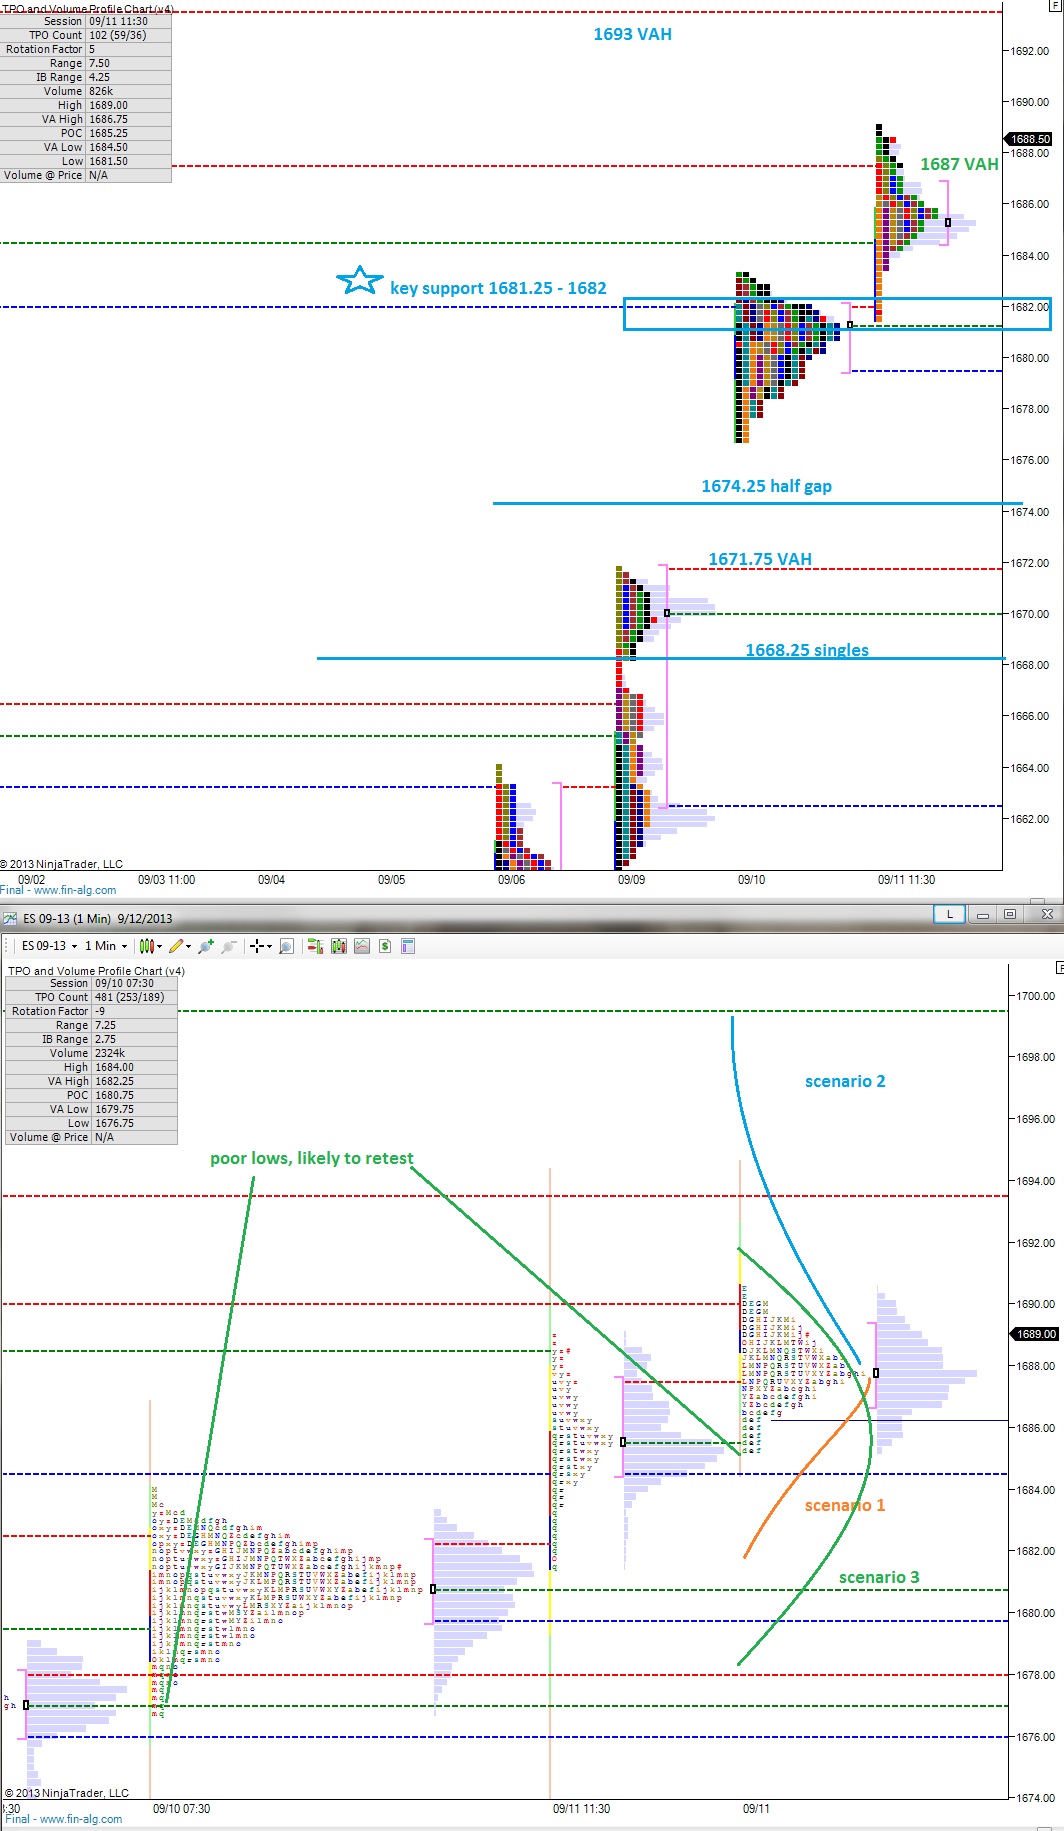
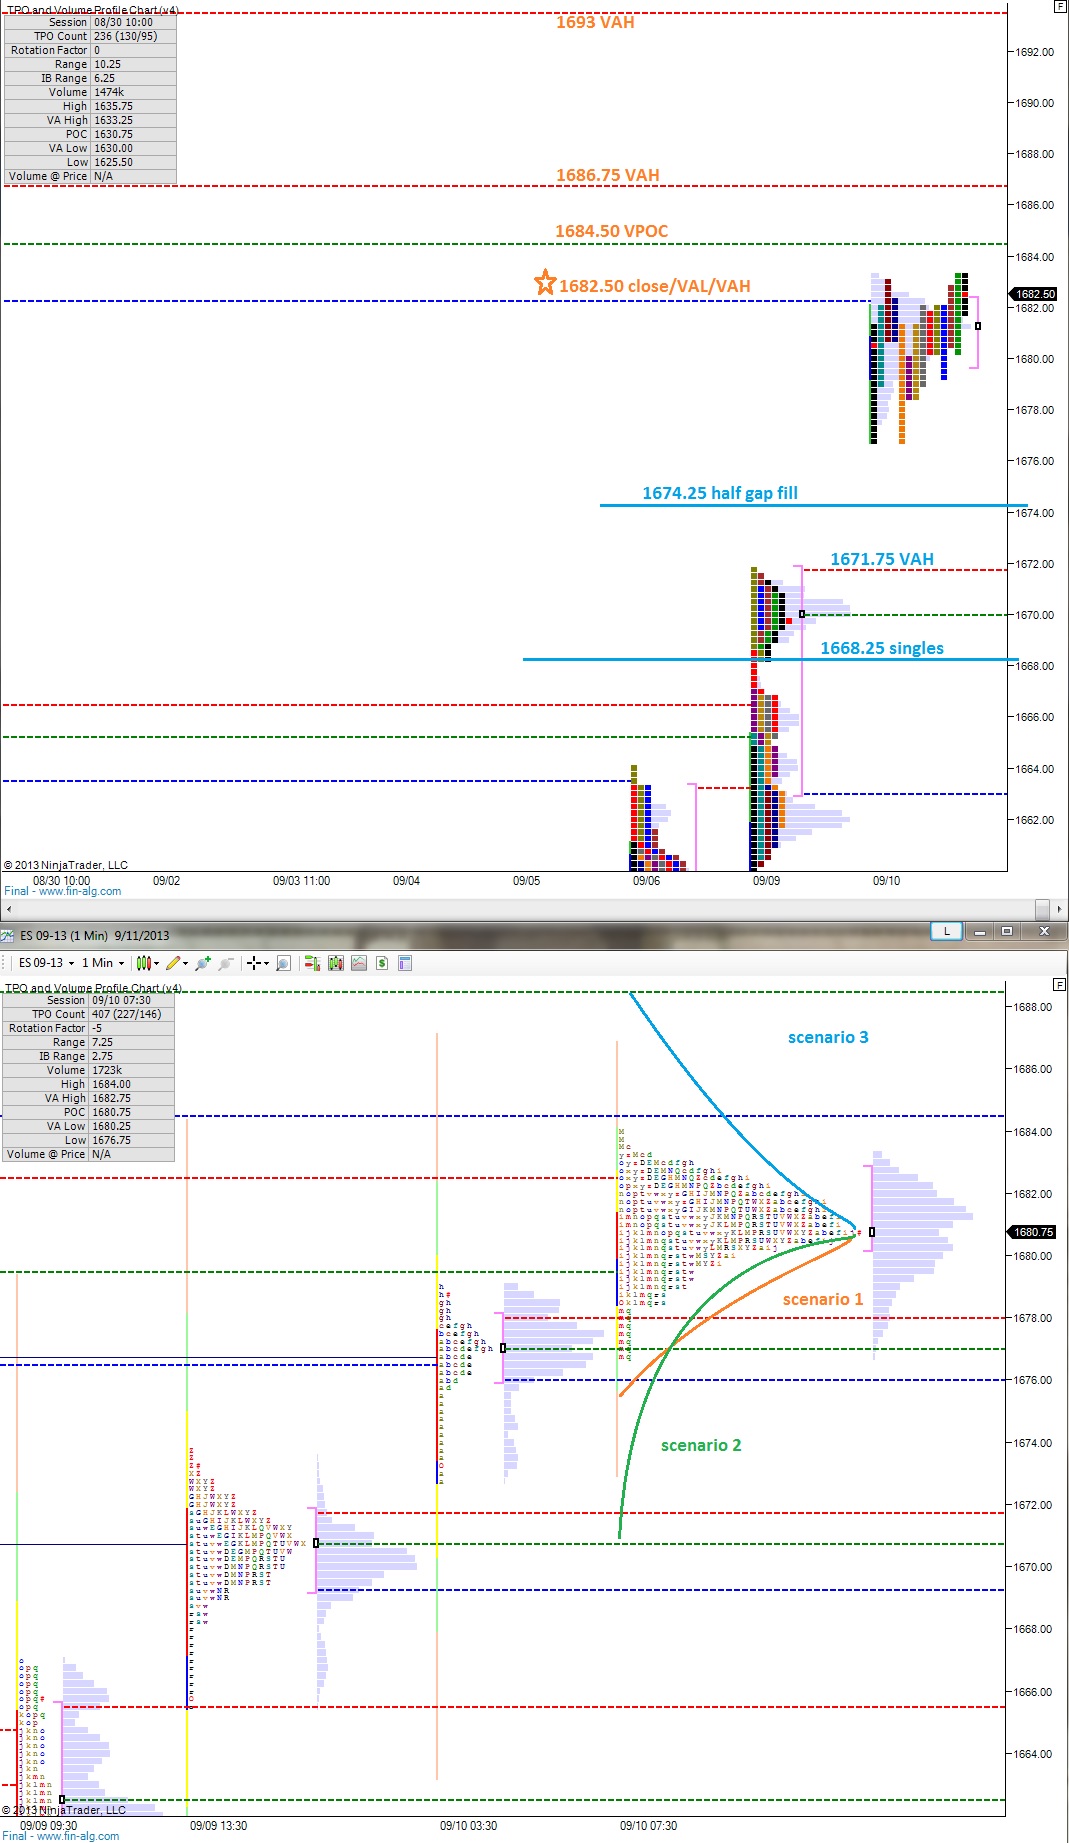
Therefore we have an out of balance market, two pieces of context above and below to measure buyer/seller context against, and we are looking at how the USA handles this information as we come online.  I have highlighted a few scenarios and opportunistic price levels on the following market profile charts:

ES_MarketProfile_09192013

Comments »

Holding The High Water Mark

The overnight session in the S&P was again quiet, setting a range only 3.75 handles wide.  The interesting observation is where the small range took place—at and above yesterday’s high.  The market is hanging high into the Fed today after poorly rotating lower during yesterday’s session.  This did two things—it made shorting very difficult and a losing venture, and left the dip buyers on the sidelines.

Therefore, my expectation is for early dips to be bought through the natural demand of underwater shorts being made whole (perhaps partially whole) and eager buyers putting fresh money to work. Given the implications of the Fed meeting today however, we must also be aware of a rug pull scenario where we slash through levels of support as the market attempts to digest the announcement.

I’ve highlighted a few scenarios for today which may be rendered ineffective if we begin trending, but still are context to keep in mind, and key price levels on the following market profile charts:

ES_MarketProfile_09182013

Comments »

Gentle Rejection Overnight

The overnight session was quiet, and the first thing to catch my eye is the way price kept bouncing off yesterday’s low at 1688.  There were four instances overnight where we saw buyers reject attempts to break this level.

As a result of all that time being spent near the lows, we have formed a very lopsided market profile overnight.  This gives us some interesting context clues as we trade today.

Many other markets are quiet too.  Take for instance, the Euro currency future via the /6e.  There has been strength but not enough to break yesterday’s highs.  Instead the Euro marking time with a gentle sine wave.  If however the Euro cannot strengthen this week, it could still be stuck in a bracketed range dating back to the beginning of 2013.

Returning to the /ESZ3 or $SPX December future, our key upside level of resistance is close at 1693.50.  When we broke down yesterday to commence gap fading we left a sharp low volume node at this price.  It can’t be seen as clearly on the below market profile charts as it is on a pure volume profile, but you will notice a split in the profile at this point and a value area low.  I’ve highlighted this level, other key areas of opportunity, and a few scenarios for today on the following market profile charts:

ES_MarketProfile_09172013

Comments »

Out of Balance

Good Morning and welcome to another work week, we have quite a gap higher to manage this morning.  The +20 gap that occurred when the market opened last night is a perfect example of something not being priced into the market.  This is the risk we carry when we hold positions over the weekend.  The 20 point gap also doesn’t mean the news is priced in.  Instead it has thrown us out of balance, which provides opportunity, as we auction our way back into balance.

The overnight action is currently forming a head and shoulders pattern with a neckline at 1698 and left shoulder at 1701, head at 1703.75, and right shoulder at 1702 give or take a few ticks.  The downside target of the move is 1692.25 which is one tick above where we opened yesterday evening, and also showing other confluences of support.  This is a huge level to monitor today, and one that is likely to offer excellent trading opportunities.

We’re also coming into the market action from the first days of August which gives us a few handy reference points, a value area high and volume point of control a point apart at 1696.50 – 1695.50.  Keep these levels in mind, if the bulls make short work of establishing value above here, we may be in for a fast and furious move higher.

Otherwise, my expectation is for profit taking type selling to enter the market early on and back fill the single prints from last night a bit.  I’ve highlighted this scenario, important price levels, and more on the following market profile charts:

ES_MarketProfile_09162013

Comments »

Calm Before The Storm

The overnight session has been very quiet and balanced with little to report in the way of new development.  Price action on the S&P is coiling up tight as we approach the Friday trading session.  Given the overall trend higher, even at this potential inflection point, my expectation is still to see some early strength.

To my eye when looking at this price consolidation on the bar chart and through the market profile lenses, 1684.25 looks to be the pivot point today.  That means I’ll be forming my intraday bias based upon how we trade relative to this level.

I’ve noted this level, a few possible scenarios, and other price levels of opportunity on the following market profile charts:

ES_MarketProfile_09132013

Comments »

Strength Overnight

The strength we saw in the S&P going into the close carried on into the early overnight session, pressing up to new highs after the market closed.  This serves as an interesting piece of context because it is very uncommon for a swing high to be made outside of regular trading hours.

The overnight profile is balanced and features a poor low at 1685.25 seen as a triple TPO down at the lows.  This area coincides with yesterday’s VPOC which was able to migrate above the most of the key reference points we discussed yesterday morning.

I’ll be watching for a push to new swing highs today, and I’ll also be closely watching support from 1681.25 – 1682 should we see some selling come into the market.  These levels look like solid support currently, so seeing them break would be significant.

Overall, the market looks pretty strong this AM, let’s see if it can carry through into RTH.  I’ve noted some scenarios and key levels on the following profile charts:

ES_MarketProfile_09122013

Comments »

Wanting a Dip

Sometimes we find ourselves wanting the market to behave in a certain manner.  When I went over all the charts this morning, my first thought was this rally is getting a bit long in tooth.  Then I observed a few more charts which firmed up my expectation that we may see a bit of a pullback materialize today.

But then I wanted the dip.

There is an old lesson in this thought process.  You can build expectations, but to want is to impose your will.  Imposing your will, or demanding, that the market conform to your expectations is like being mad at the ocean for washing your home away, irrational.

Anyhow, as much as it’s my expectation that today we see a pullback materialize, the market could just as easily continue climbing the wall of worry or trade sideways.  The overnight profile is top heavy but mostly balanced and we’re coming into significant resistance at 1682.50.  It didn’t surprise me to see the market stuck just below 1682.50 which represents the value area low of the distributions left behind in early August. This level is huge today, along with 1684.50 (VPOC).  If bulls can show price acceptance above these levels, we’re back into this upper value, and may rotate through it sooner rather than later.

Otherwise I’m looking for a pullback.

We had a poor low yesterday seen on the profile as a double TPO print.  If that gives way, I’ll be looking for gap fill trading to come in, pressing down back toward Monday’s high at 1671.75.  How much of this gap the sellers are able to fill (if any) will be an interesting piece of market sentiment as we close out the week.

Note: Today is contract rollover meaning many future traders switch to the December contract.  I will be watching the volume on both contracts and migrating over to the December contract when it trades move volume.  The above price levels are in reference to the September contract.

ES_MarketProfile_09112013

Comments »

The Market Goes Stop Hunting Overnight

Markets are ripping higher overnight, pressing the /ES nearly to the top of the gap left behind on 08/15.  By the looks of the overnight tape many buy stop orders we triggered and a stop run ensued.  The question now is, will the buy flow continue to push the market higher, or will we see a big selling reaction to a perceived premium in the marketplace?

The S&P is currently trading ten handles above yesterday’s high, and nearly twelve handles above the closing print.  Therefore we are in pro gap territory where it is very difficult to play a gap fill trade.  However, we should keep the context of the gap fill trade in mind today if we see sellers start to recapture areas of support.

An interesting zone of price overnight is from 1674.50 – 1675.75 where price moved so fast, nearly no volume took place.  Price could revisit this area and give it a proper auction.  Should this occur, the subsequent move from the zone may give us some insight into who is more active today, the buyers or the sellers.

Given the distance the market covered overnight, my intial expectation as we approach the cash open is to see selling enter the market.  Initial downside targets are 1677.50 then 1675.75 and a possible gap fill to 1671.  On the upside, we have the lowest distribution from when we gapped lower with resistance at 1682.25 (VAL), 1684.25 (VPOC), then 1686.50 (VAH).

I’ve highlighted these levels and drawn out a few scenarios on the following market profile charts:

ES_MarketProfile_09102013

Comments »

Keep an Eye on The Aggressive Bull

Hello and good morning.  The globex session spanning from Sunday evening and into the early hour of Monday has been a quiet one, stable, and without much by the way of new developments.  The S&P printed a nice bell curve distribution overnight within the upper 1/3 of Friday’s range.

Both Friday and Wednesday left the very visible footprints of reactive buyers.  These show up as long buying tails.  We often speak about the big money being away during the summer, which is debatable, but last week certainly saw signs of heavy money flow.  Whether it was due to the new month or the pros coming back to work, I’m not certain.

What I do know is if we see the market trade back below these buying tails this week, that is going to put all of that aggressive reactive buying under water.  If price sustains above the buying tails, we may see a bit of confidence returning to the market.  The buying tails are key piece of information to measure sentiment against early this week.

I’ve highlighted several areas of opportunity on the following market profile chart.  I’m particularly interested in the confluence of support nearby from 1652.50 – 1653.  If the market cannot sustain trade above these levels today, the reactive buying on Friday comes into question as we enter the thin volume portion of the profile.  My expectation is for buyers to hold near these levels.


ES_MarketProfile_09092013

Comments »