iBankCoin
Home / Tag Archives: $NDX (page 23)

Tag Archives: $NDX

Opening Swings – Buyers Rule The Roost in The Short Week

The holiday drift was in full effect last week and there were not very many opportunities to trade the short side of the tape.  Overall we saw very methodical auctions where the market set a low bid and then auctioned higher.

I highlighted the opening swings, except for on Tuesday, the strong trend day, which did not print an opening swing, instead only driving higher.

I have highlighted some of my best and worst trades of the week as well, enjoy:

MONDAY:

06302014_os

TUESDAY:

07012014_os

WEDNESDAY:

07022014_os

THURSDAY:

07032014_os


Comments »

Mutual Fund Tuesday – Holiday Edition

Today is the first day of the third quarter and also the second day of a holiday shortened week.  Nasdaq futures are currently priced to gap higher into the session by just over 10 points.  The important economic releases scheduled for today happen early during our session, with PMI Manufacturing index at 9:45 and more importantly ISM Manufacturing Index and Construction Spending at 10am.  There is a 4-Week T-bill auction at 11:30am.  Janet Yellen is set to speak tomorrow at 11am.

Price drifted higher overnight, and given the context of a poor high, the acceptance of value as evident by the clean distribution yesterday, and late responsive buyer the drift was expected.  These few days ahead of the 4th of July tend to be bullish, but with money managers eager to start the new month/quarter off we can see some bigger swings in both directions intraday.

The long term and intermediate timeframes are buyer controlled meaning prices are not balanced nor are they making lower lows and lower highs.  Instead we are making higher highs and higher lows on a weekly chart of the composite (see yesterday morning’s premarket analysis) and the intermediate term chart is doing the same.  If the market sees some selling today, there are some interesting low volume nodes we could test out while still retaining buyer control.  I have highlighted these levels on the following intermediate term composite:
07012014_IntTerm_NQ

There is a slippery zone on the market profile.  This is a price area where buyers were very confident yesterday.  However, should we trade back into this region and not observe the same level of confidence from the buyers, they we are likely to see a fast liquidation take hold, something to shake out weak handed longs perhaps.  On the upside we are working with measured moves.  I have noted the measured move targets, as well as a few other observations on the following market profile chart:

07012014_marketprofile_NQ

Comments »

Month End Monday

As we head into another month end trade, the Nasdaq is starting off the shortened holiday week in the green.  The overnight session was mostly balanced.  A wave of selling came through around 6am which found responsive buyers lurking below.  The Canadians released weaker than expected GDP stats at 8:30am this morning and the news thus far has not triggered a response from the US equity futures.  Notable economic data on deck today includes US Pending Home Sales and 10am, Dallas Fed Survey at 10:30am, and Fed’s Williams speaking at 1:10pm.

We closed out last week with a rally, and with prices at fresh swing highs.  Looking at a long term chart you can see the buyers are in control as price advertises higher in an attempt to entice sellers into the exchange:

06302014_Weekly_NQ

On the intermediate term we can see an important low volume node formed just before the breakout, 3823.75 is on watch early on this week:
06302014_IntTerm_NQ

Bringing our attention closer to the action, the market profile shows value on the rise with Friady printing a normal variation day with buyers extending the range higher and also pressing value higher.  The price zone from 3830 – 3826 is fast and we may traverse it a few times today, especially if the market begins to balance out.  I am particularly keen on the low volume node which appears here on the market profile as well as the composite, right at 3823.75.  This level is my in play action level of the day. I have highlighted this level and a few more observations on the following market profile chart:

06302014_marketprofile_NQ

Comments »

Opening Swings – The Freedom To Form an Analysis

Freedom is kicked into high gear this weekend as we prepare to celebrate Independence day.  The weather up north is paradise, something we patiently wait all year for.  With that in mind and family and friends arriving in town, I took a brief moment to work through the Nasdaq opening swings from last week.  Skipping an analysis of last week’s action with all the festivities as an excuse would be a shame because the action was so dynamic last week.  The market is coming to terms with swing highs with only the Dot Com bubble peak above.  These truly are interesting times for our country and its markets.  If that doesn’t excite you enough to dig into some charts, then I am not sure what will.

Let’s have a solid holiday week.  And what better way to kick it off then to wrap your mind around auction theory and how it can assist you in the daily navigation of our electronic markets.

MONDAY:

06232014_os

TUESDAY:

06242014_os

WEDNESDAY:


06252014_os

THURSDAY:

06262014_os

FRIDAY:

06272014_os

Comments »

Friday Before a New Month

Nasdaq futures are currently down just about 5 points during an overnight session which featured more sellers than buyers but overall printed a balanced session.  There were several economic data points out of the UK and Europe early this morning including UK GDP YoY which came in just a tad below expectations (3% actual, 3.1% expected) and German CPI which was in line with expectations.  During our hours of trade, we only have the U of M Consumer Confidence report at 9:55am.

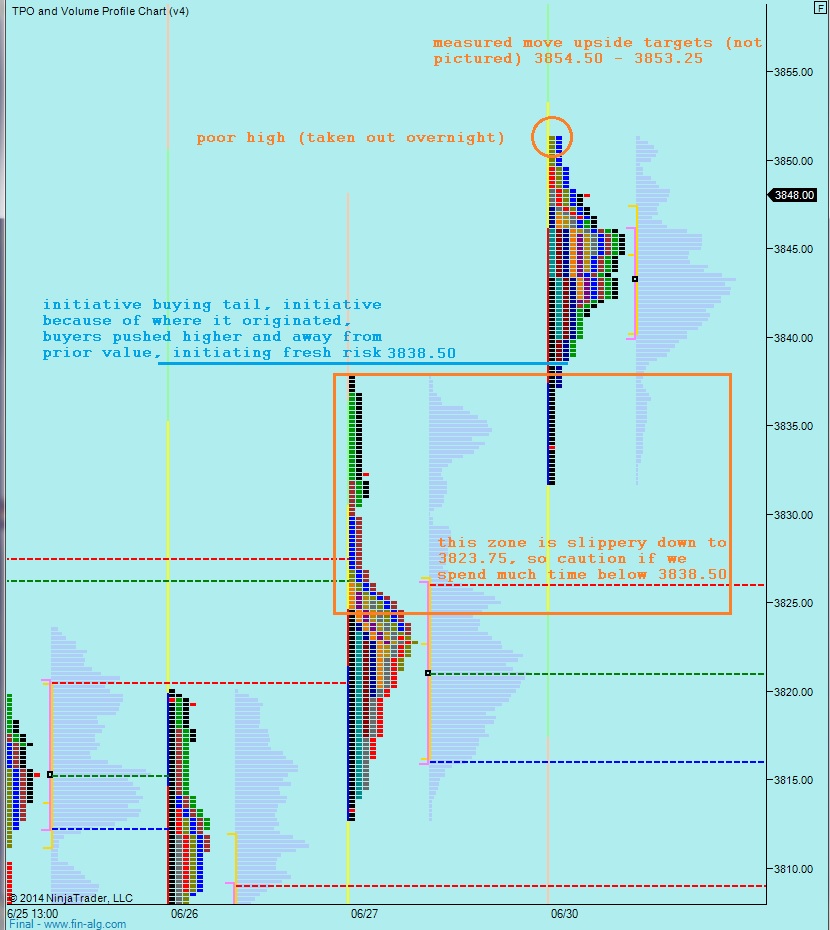
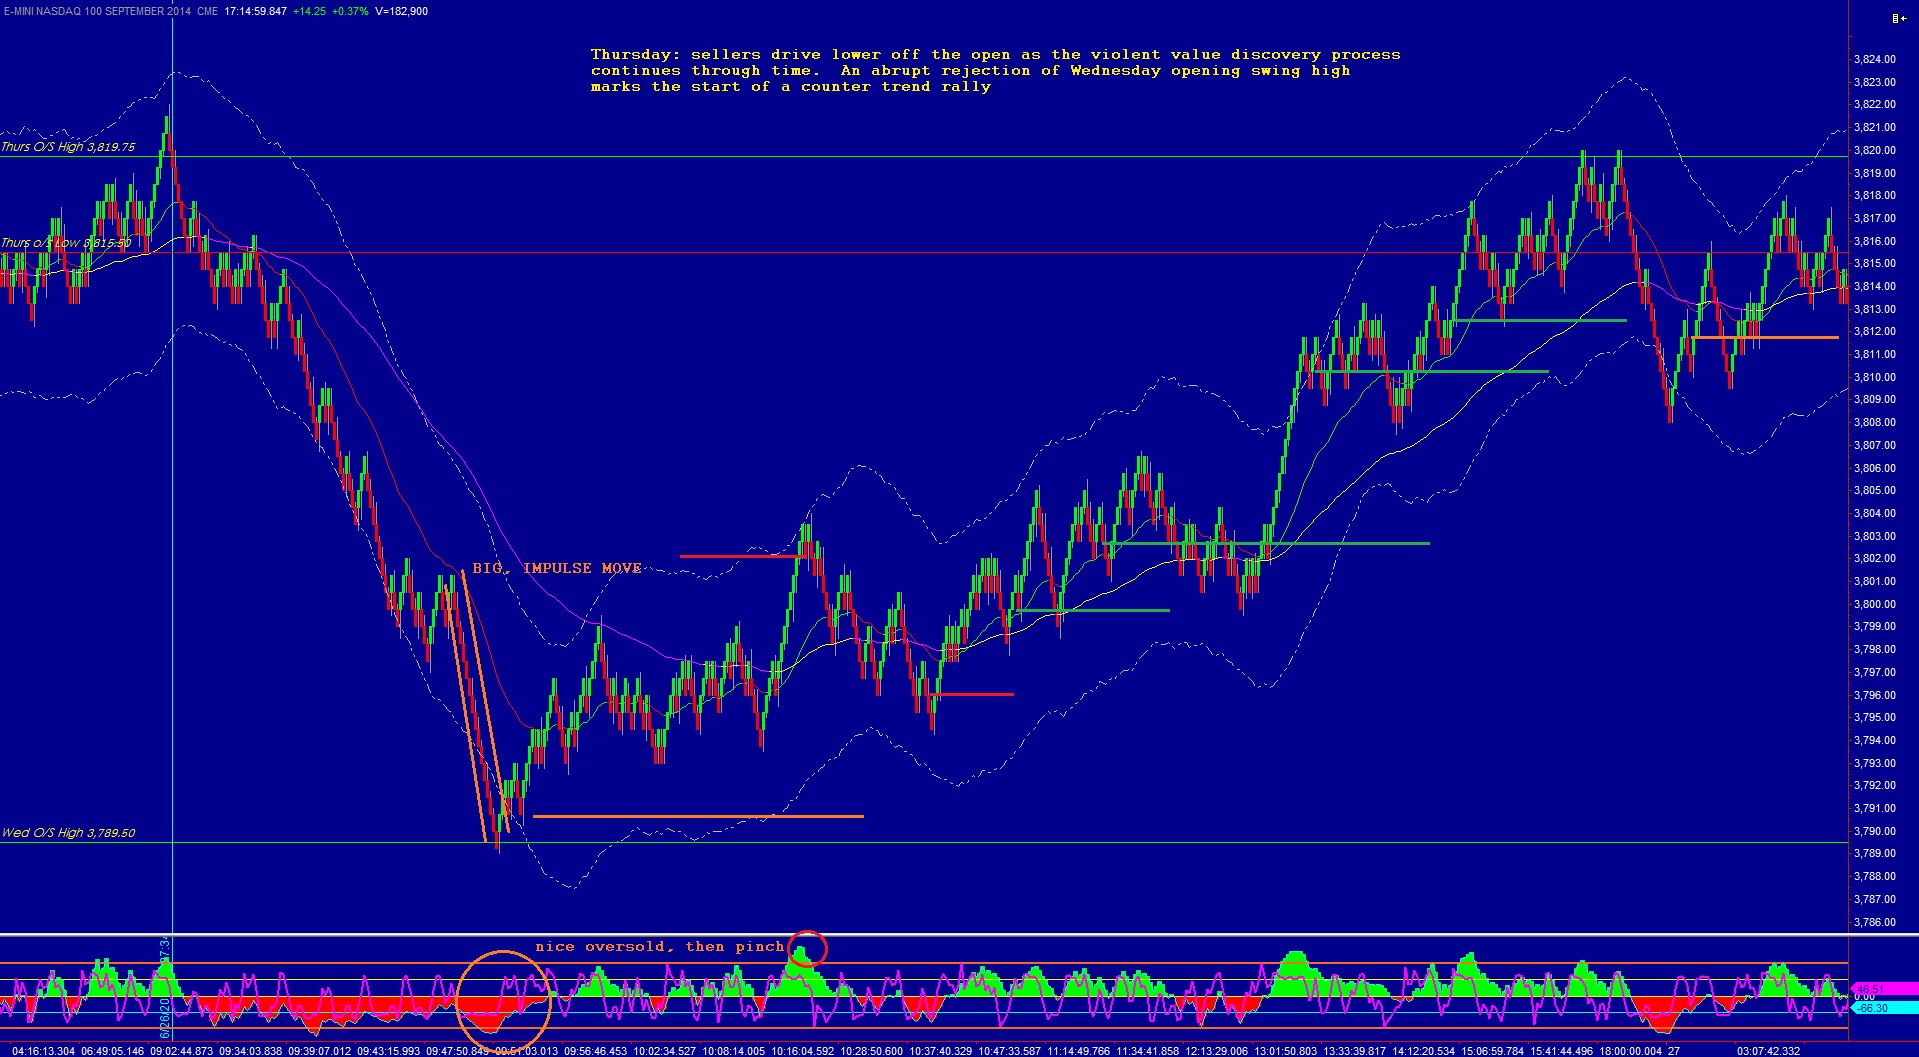
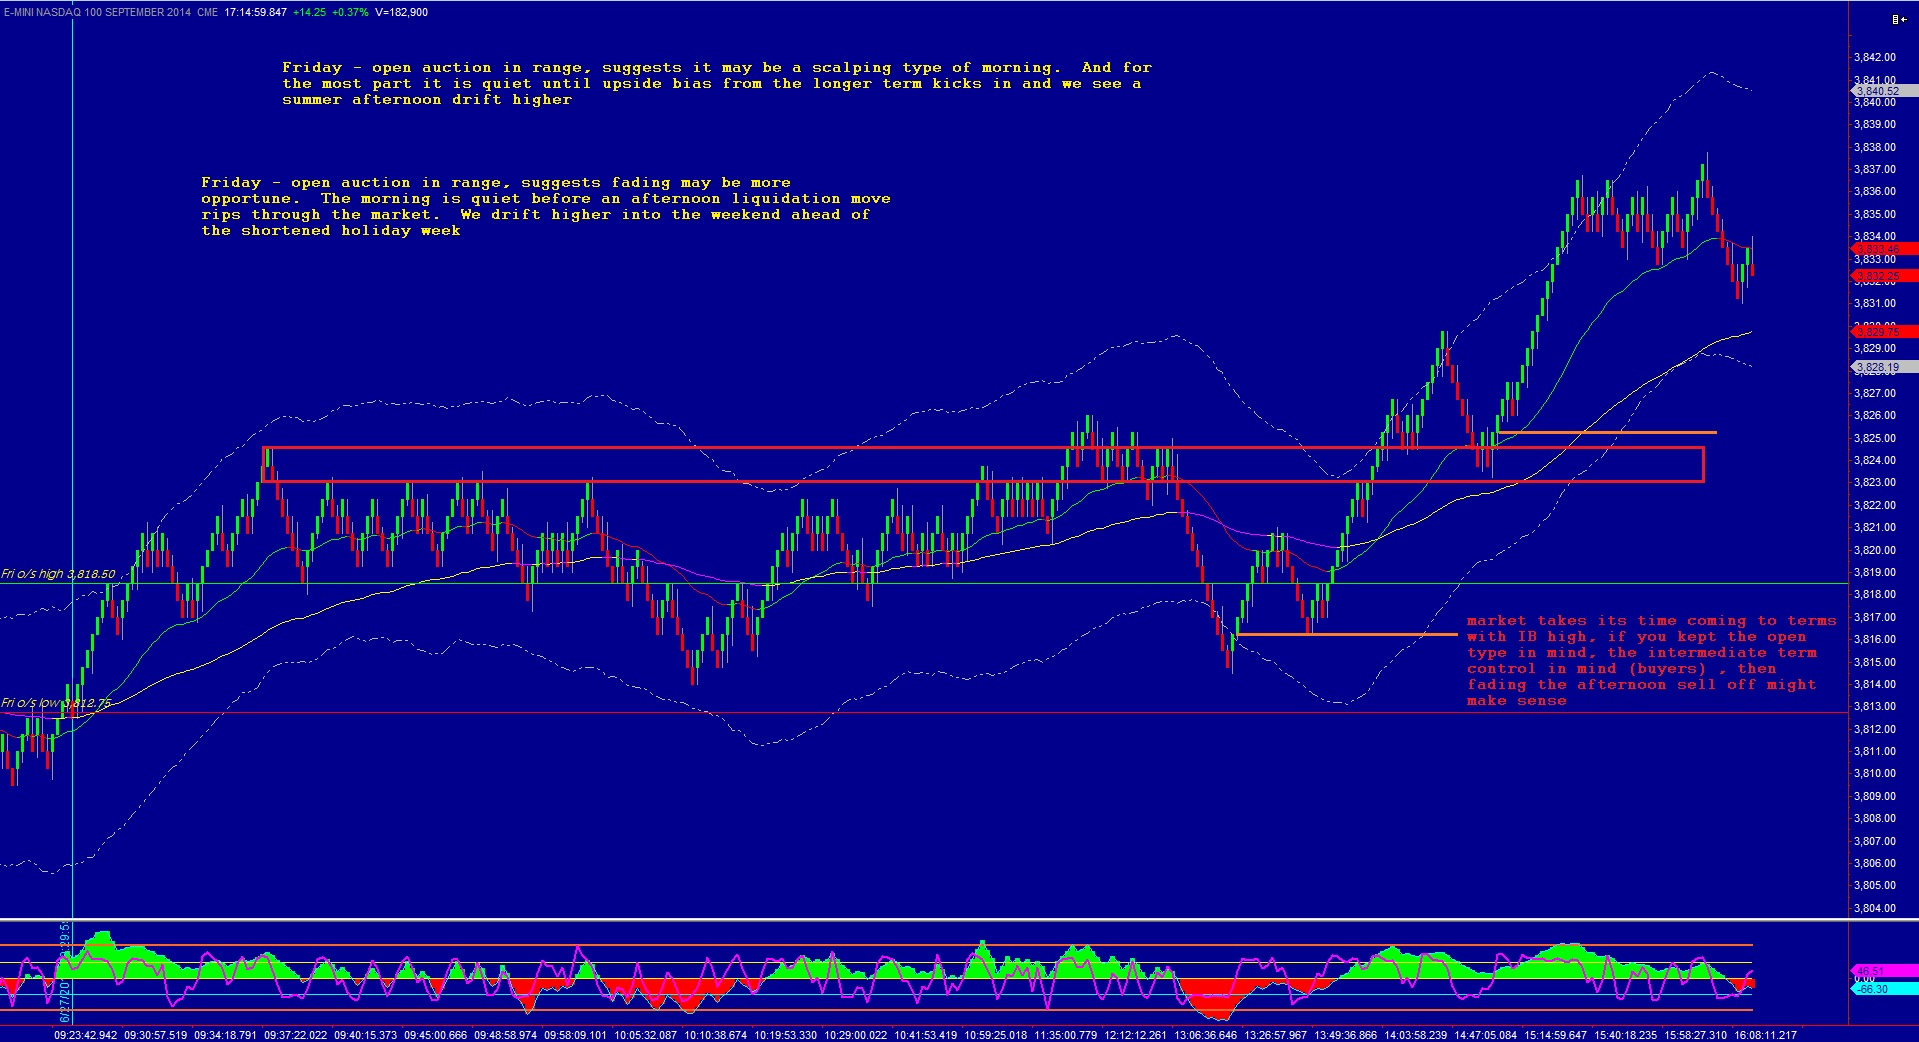
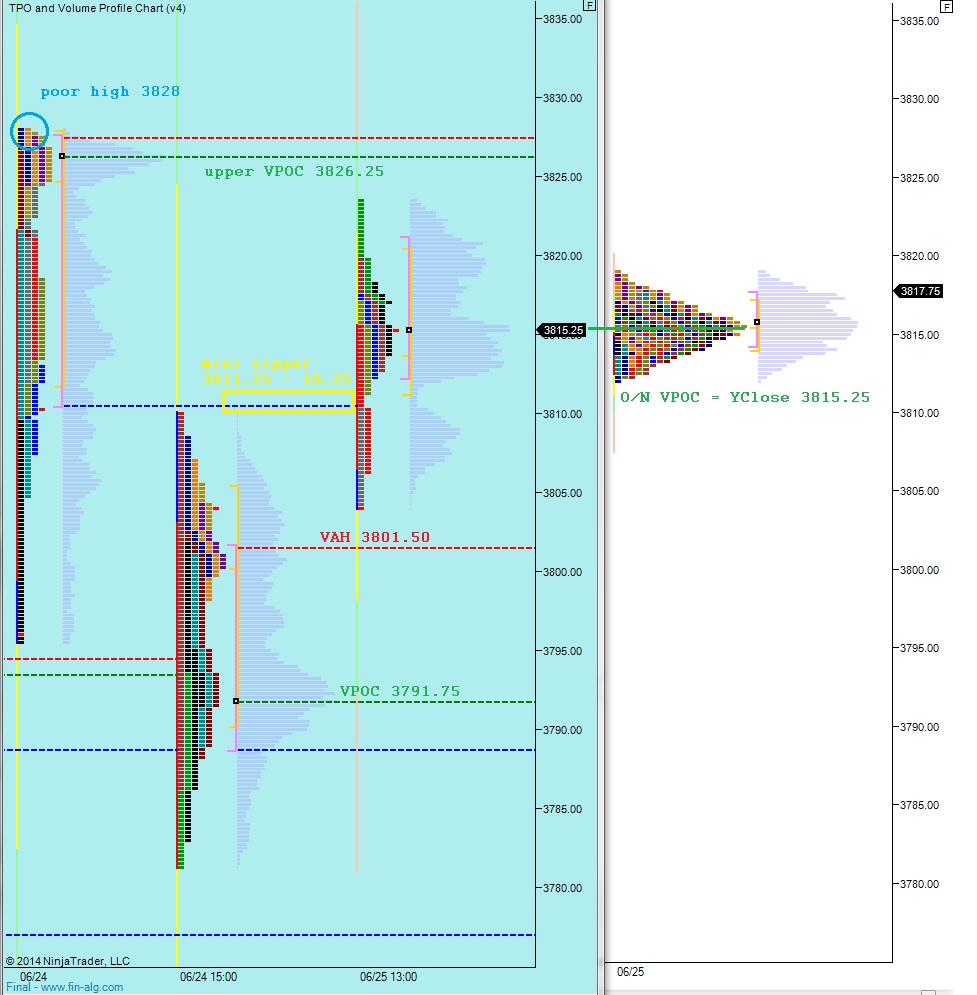
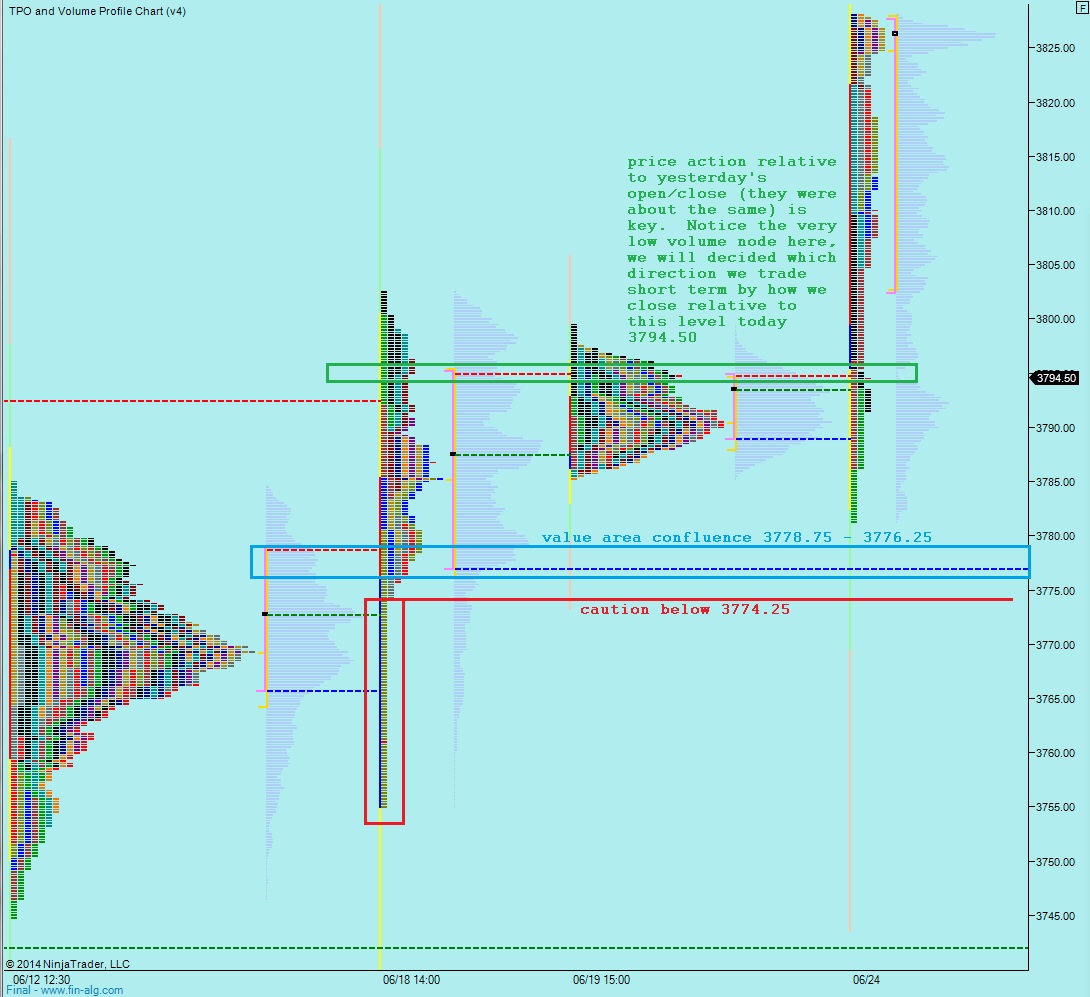
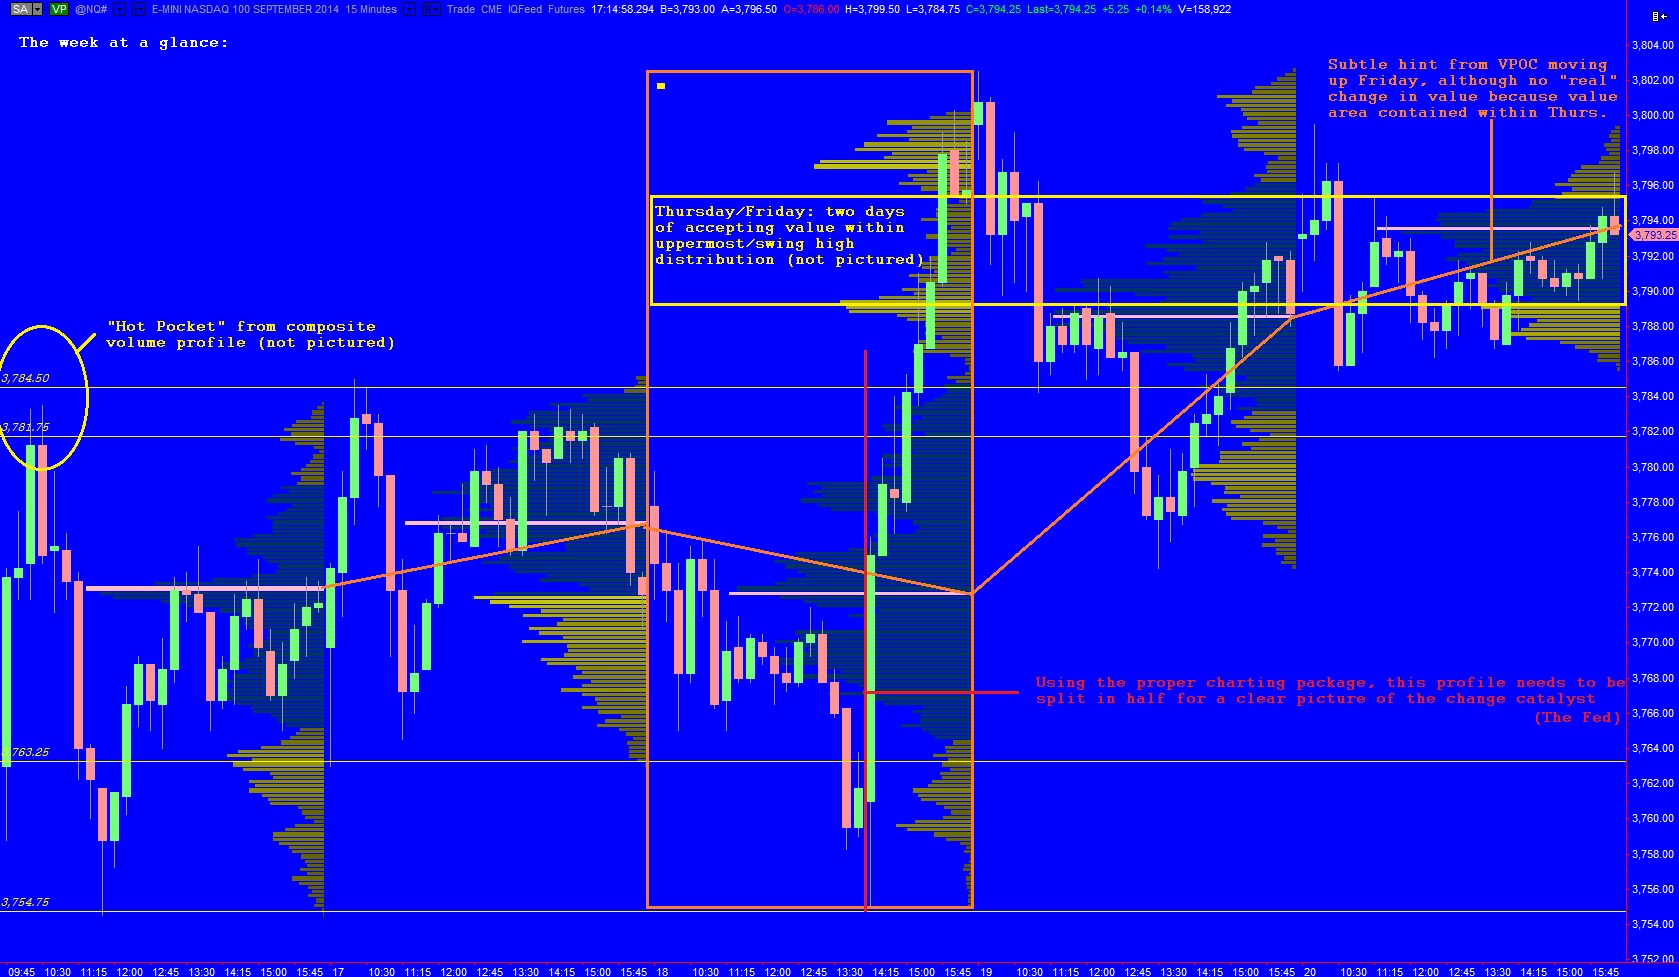
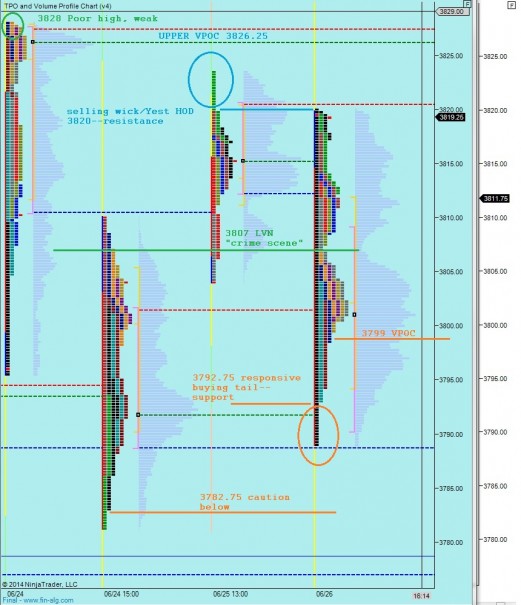
Yesterday we [nearly] printed a Normal day during the regular trading hours.  The range actually extended past the initial balance by a single tick during the final 15 minutes of the pit session after the stock market closed.  Normal days lack the directional conviction of other market profile formations.  It started with a strong responsive selling drive which may have been prompted by some unexpected news early on.  The action was contained within the prior day’s range and a two-way auction ensued which eventually gave way to buyers pressing to the high by closing bell.  The net effect was slightly higher prices and value, and a clear “crime scene” or low volume node which separates  where buyers and sellers gain short term control.  See below:
NQ_intterm_0627014_1

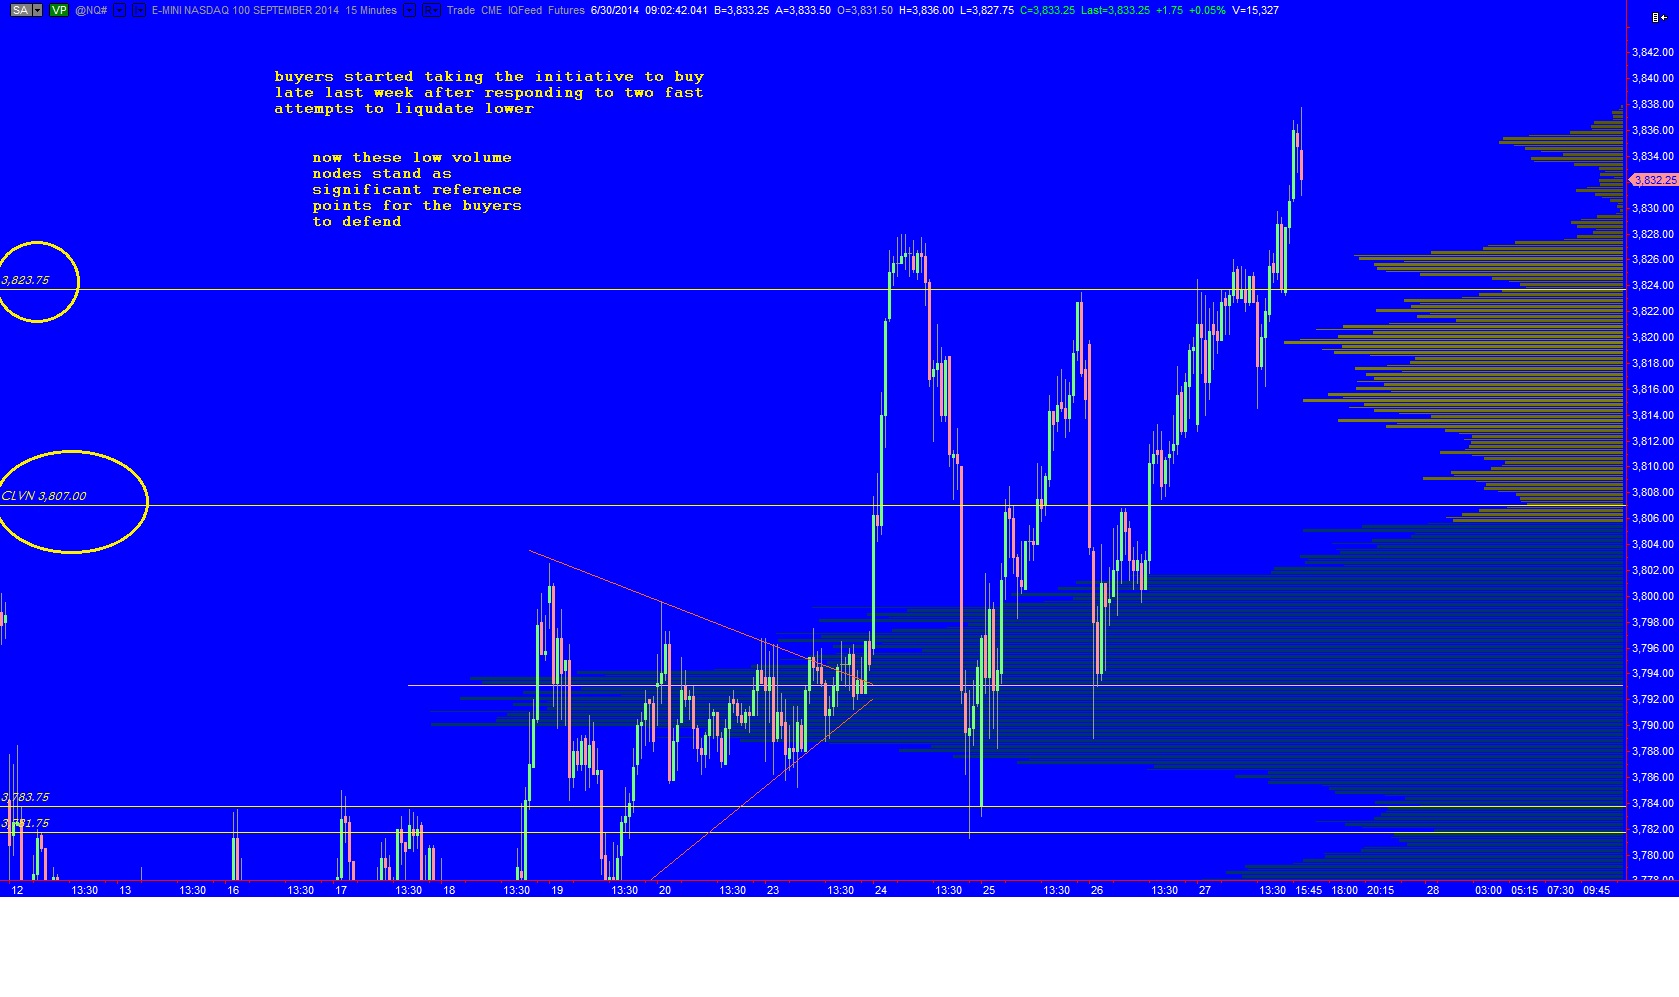
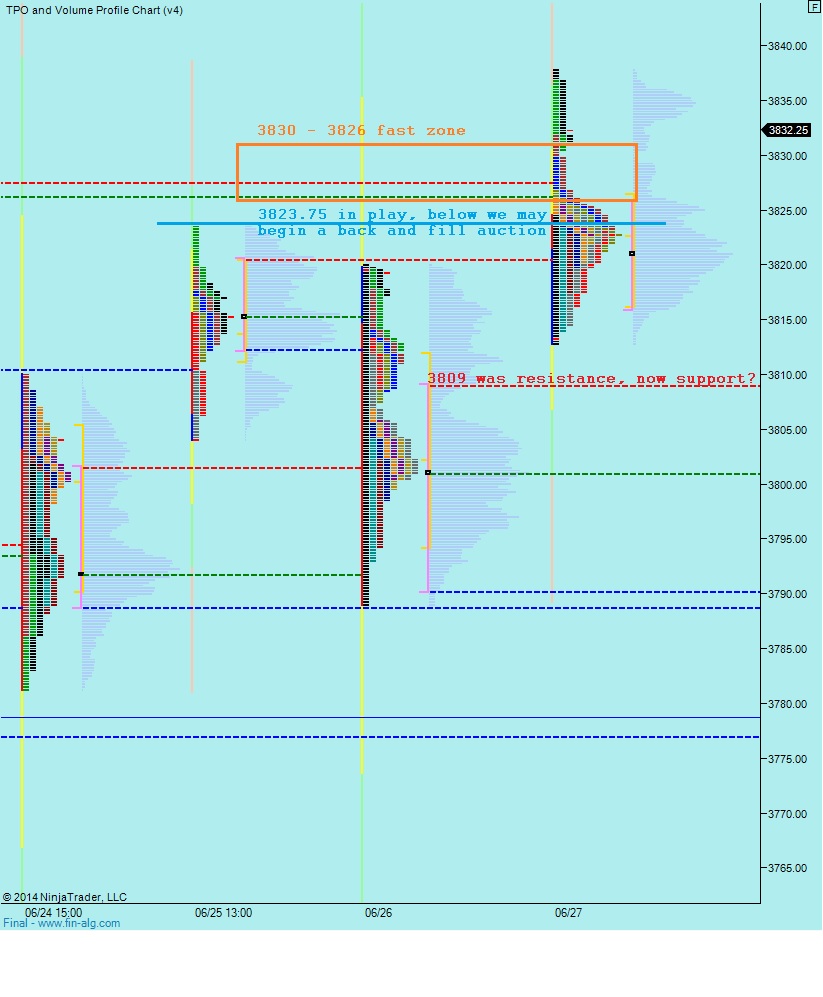
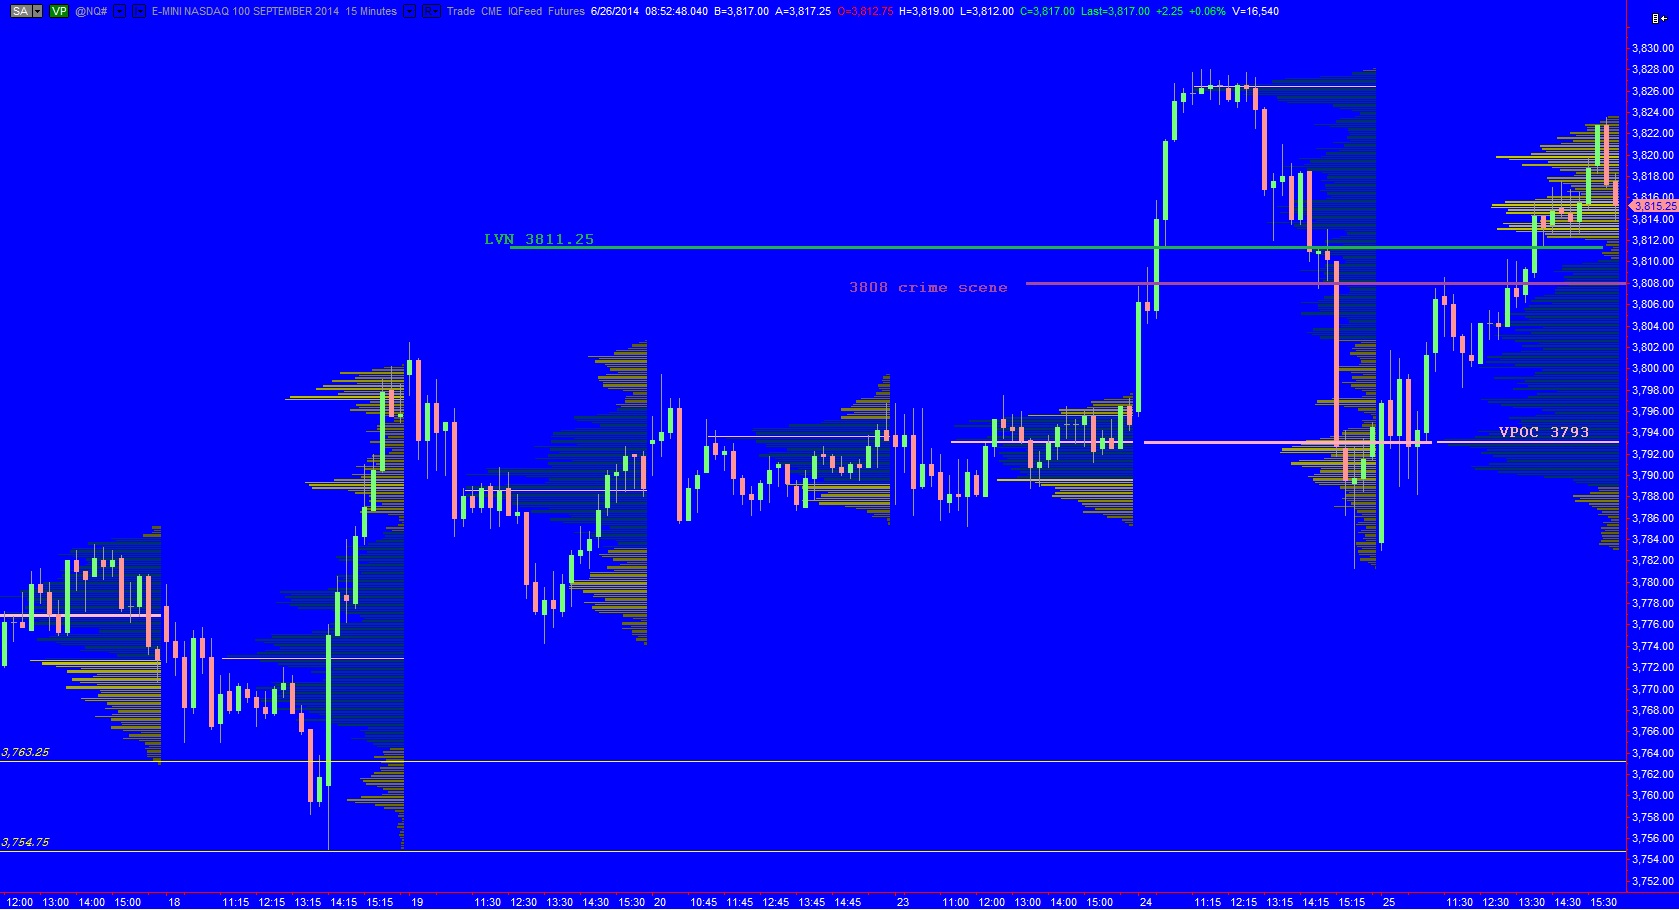
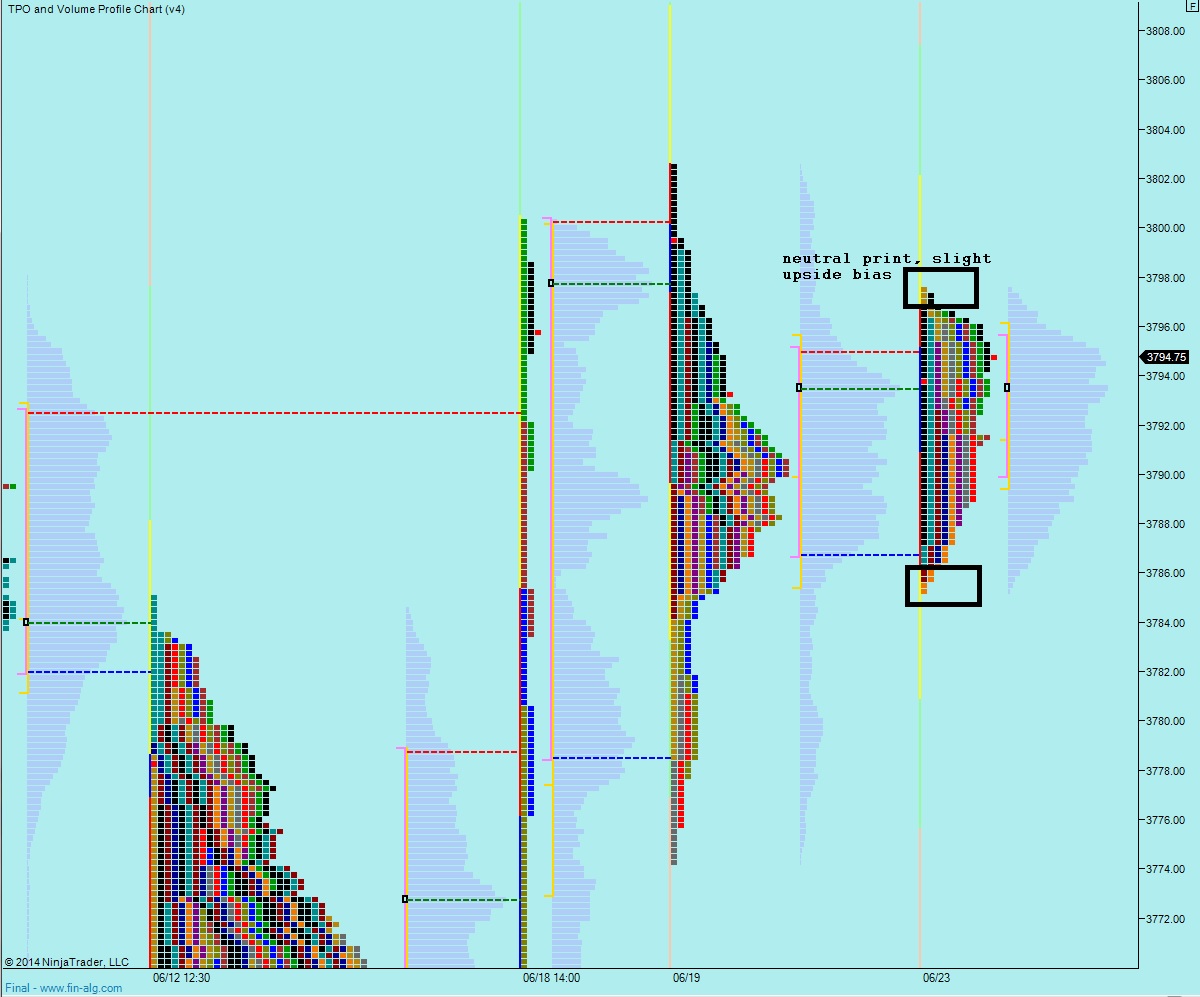
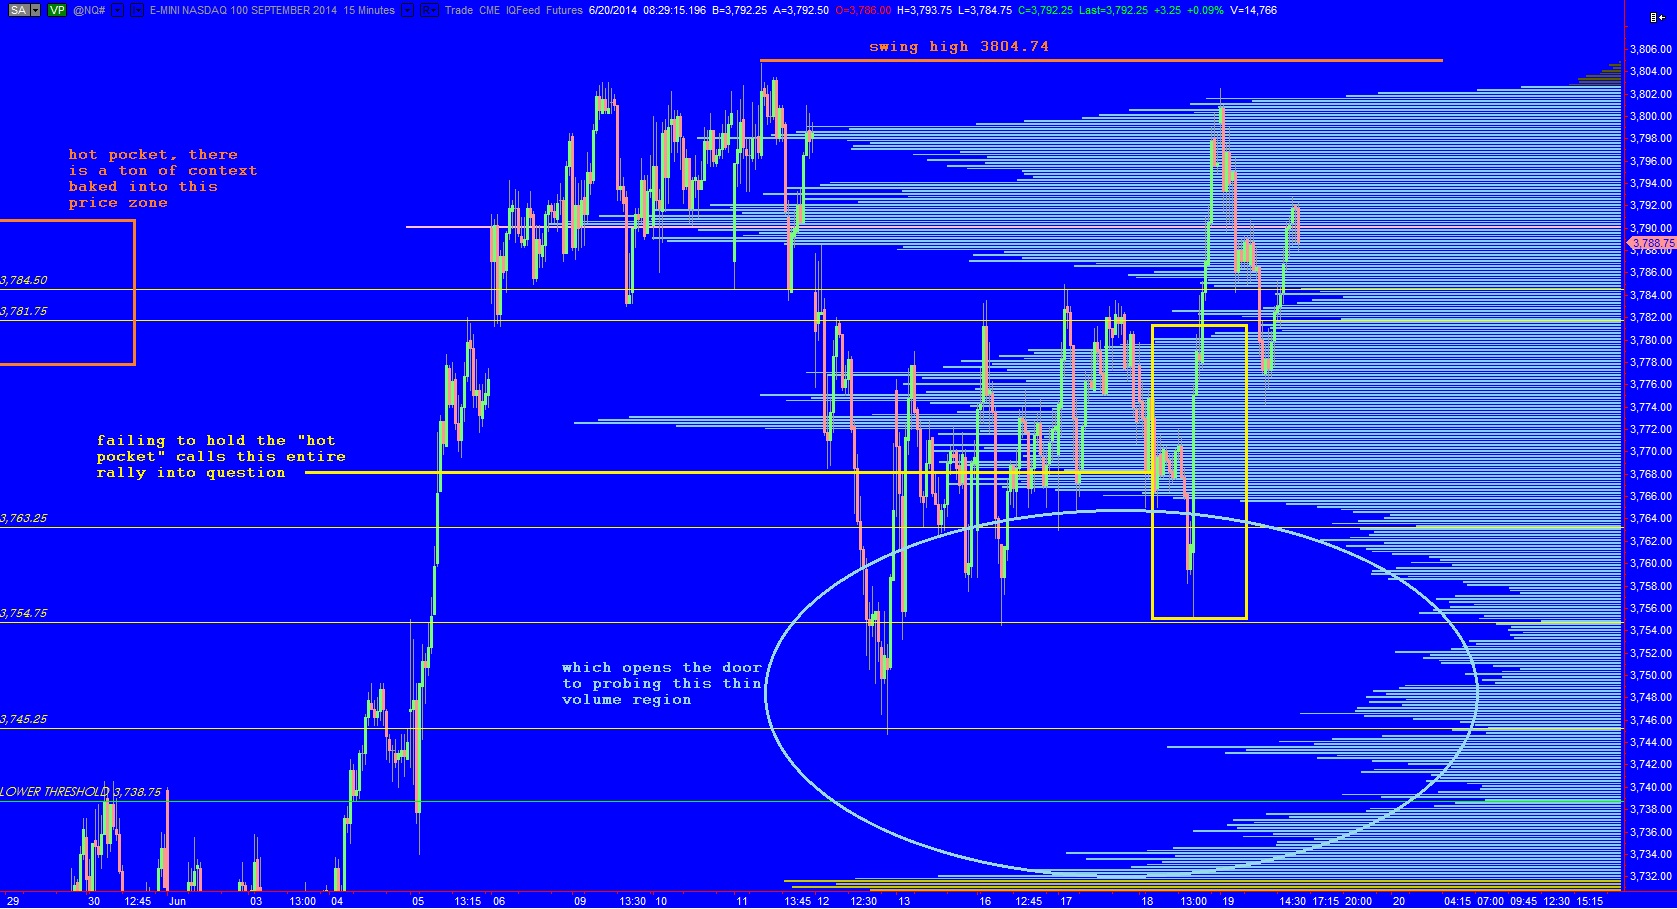
The same price level shows up on our composite profile which encompasses all the price action during our swing trade:

NQ_intterm_0627014_2

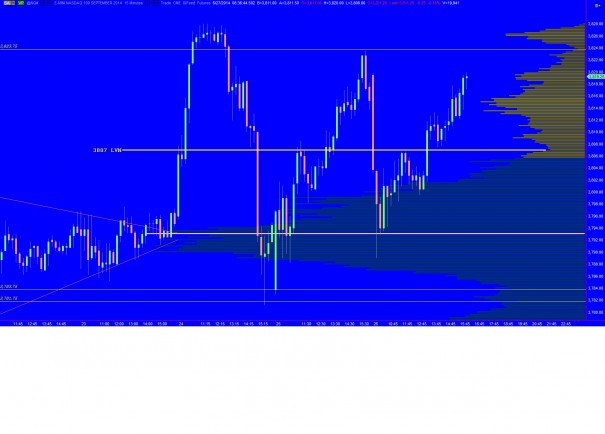
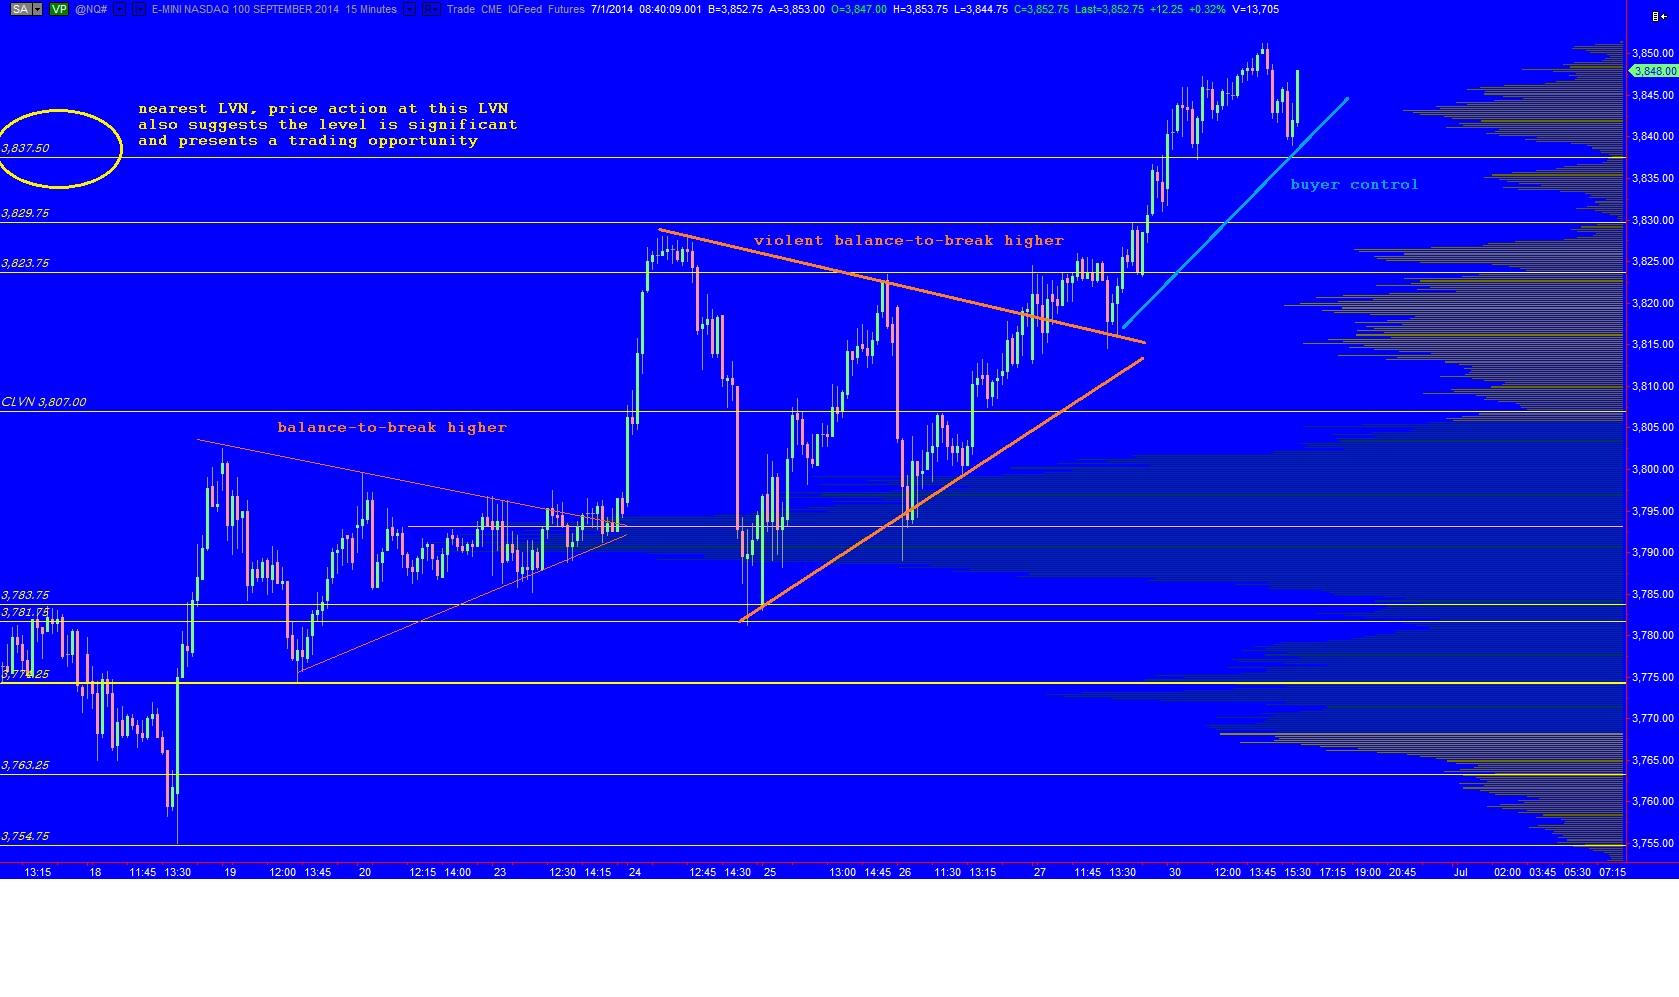
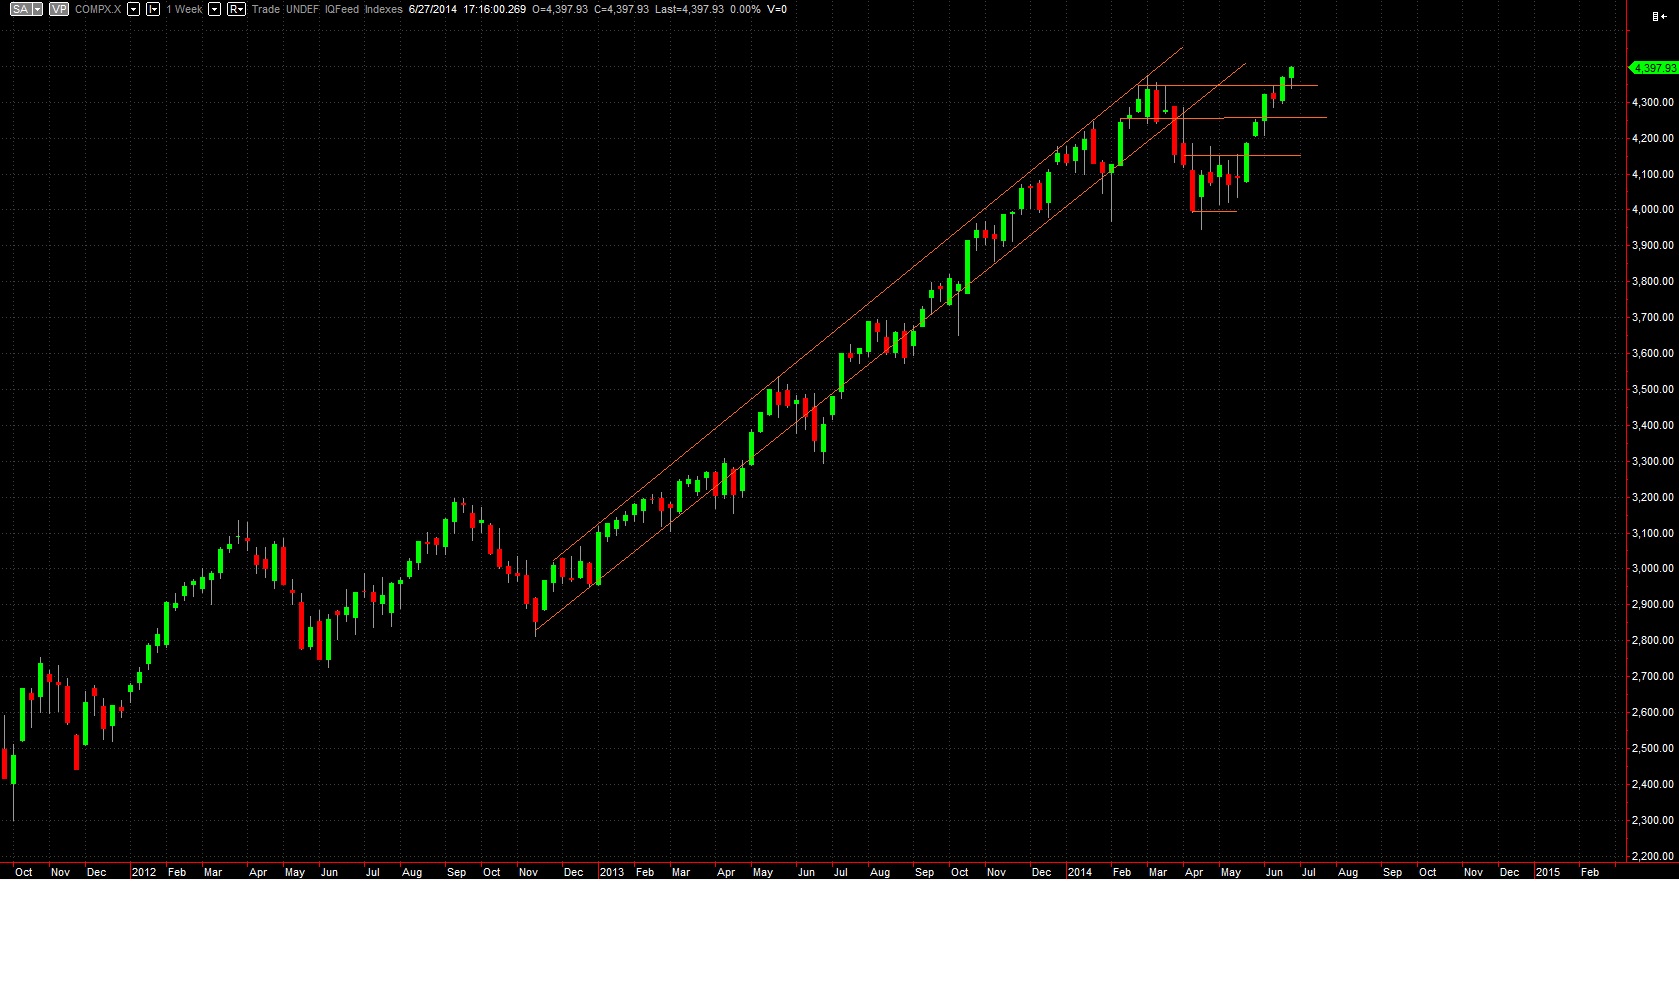
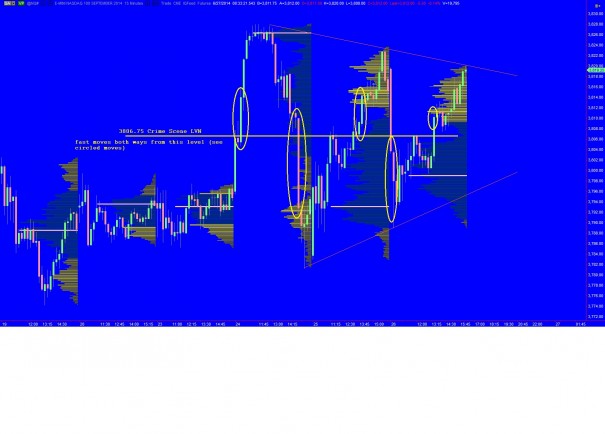
Lacking directional conviction makes sense given the bigger picture.  The Nasdaq is coming to terms with swing highs and the market is simply a mechanism for participants to exchange contracts based upon their perceived value of the Nasdaq.  You can imagine many participants are active at these price extremes because the proximity to prior inflection points demands the attention of all timeframes.

Keep in mind, we start a new month Tuesday, the market has shown headline sensitivity regarding Iraq, and 4th of July is one week away.  We may enter a holiday drift.  However these are not price levels where you want to become complacent.

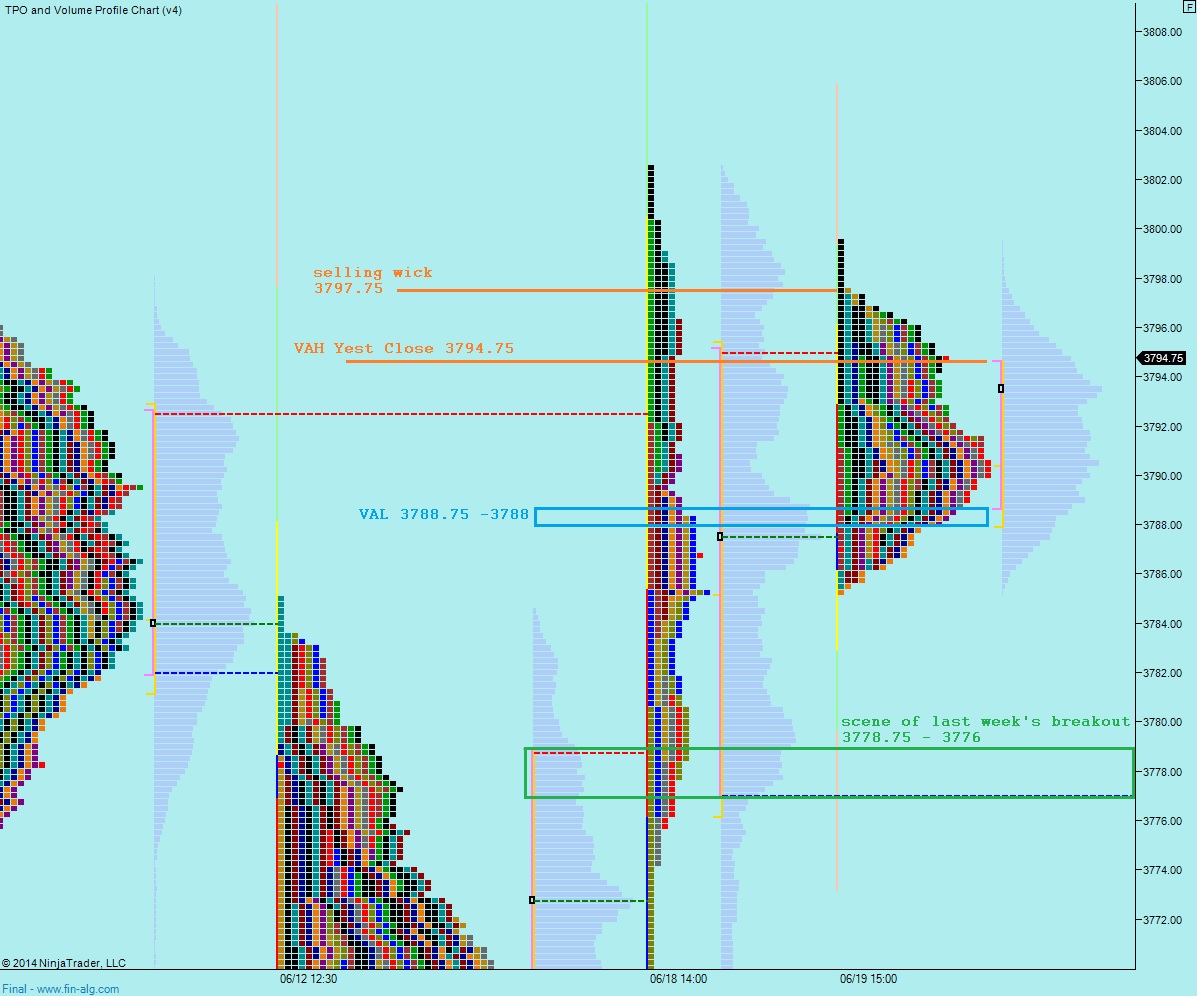
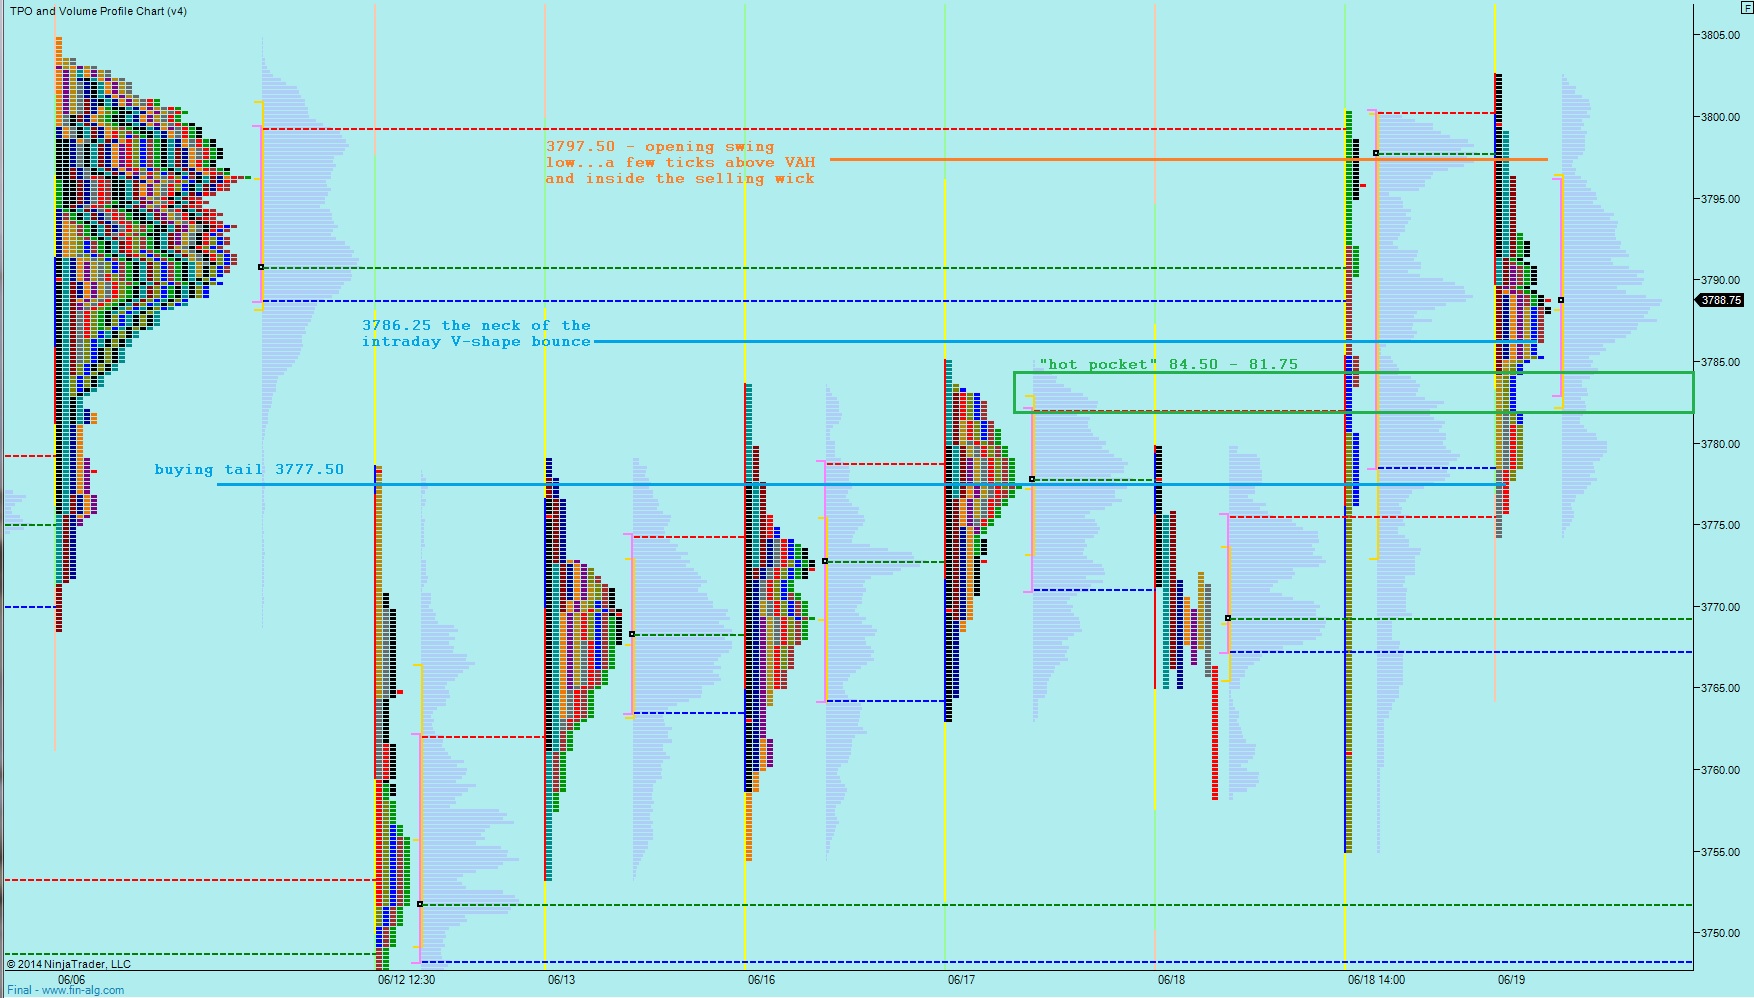
On the short term, I have observed a few key price levels and market profile features:

NQ_marketprofile_06272014

Comments »

Restoring Balance

The markets constantly shift from a state of balance to imbalance and back into balance.  This behavior is a result of the open marketplace and how buyers and sellers come to an agreement on where the value of a security is.  The key is knowing which timeframes are in balance, which are not, and who is likely to be participating in the marketplace given the conditions.

With the Nasdaq trading near annual highs it is reasonable to expect most participants are active in the market to some degree.  Right now the intermediate term is out of balance.  Even though price re-trended higher yesterday, we never saw value shift higher.  In fact, our VPOC stayed pinned back where the prior consolidation was.  The price action was impressive from the bulls but they are now tasked with proving their grit by sustaining this move and pressing value higher.  I have highlighted some of the interesting intermediate term levels below, including the “crime scene” where the rally-breakdown-rally seems to gather steam:

NQ_intterm_06262014

Short term we are out of balance on the RTH profiles.  It takes some chopping to see the auction properly but value is indeed moving higher.  Overnight we printed a very balanced session, see below:

NQ_marketprofile_06262014

US personal spending came in below expectations and consumption expenditures were in line during the 8:30am announcement.  We have Fed’s Bullard speaking in New York at 1:05 PM and some afternoon treasury auctions.  There is also a natural gas report at 10:30am.

Comments »

On Guard for False Move Ramifications

The logic behind a false move can be a bit complicated.  The market breaks out higher after a period of consolidation and spends several periods facilitating trade well in the direction of the breakout.  The auction is going well and the expected effect is for higher prices to entice new buyers into the marketplace and to continue probing higher to incentivize sellers to come in.  Once sellers have become incentivized, there is a reasonable expectation that we might see trapped shorts begin to cover on the pullback thus creating demand.  There is also a likelihood for participants who missed the move to eagerly participate on the pullback.  That was not the case yesterday which is why we use words like “might” and “likely” and “probable” and “could” avoiding absolutes and accepting that anything can and will happen in the marketplace.

Instead we reversed the entire move and price was thrown back to the scene of the breakout only a few short hours later.  This is not normal and can produce some unexpected effects.  Longs initiated during the rally are negative, some longs initiated during the consolidating building up to the rally are negative while others are flat, and shorts initiated on the way down have the confidence of a bearish candle print.  Sellers might take this opportunity to press into the vulnerability of the longs thus producing a liquidation, and there is profile context which will signal to us where this will occur.

I will only present the regular trading hour market profile for the Nasdaq this morning because I want you to actually enlarge this file and think about why and where it makes sense to expect liquidation to take hold.  These are the levels I will be observing today:

NQ_marketprofile_06252014

Comments »

Holding Balance

The Nasdaq continues to experience balanced conditions in the short term.  Early this morning we saw a wave of selling come through the market right around 4:30am when we had some speakers in London as well as UK loans for home purchases data which came in better than expected.  The selling found responsive buying just below our low of the session yesterday and we quickly snapped back to the other side of balance.  As we come into the USA cash session futures are currently up just over one point.

The economic docket for today shows Cash-Shiller home price index at 9am followed by New Home Sales and Consumer Confidence at 10.  We have some treasury auctions taking place at 11:30am and Fed speaker William Dudley at 2pm.

The overnight profile has changed form slightly, the shelf which I was keen on yesterday was disrupted overnight and as a result we now have a more balanced-looking profile.  The spill over the shelf last night carries a bit of expectation for accelerated prices to the downside.  Thus, seeing a responsive buyer eager to purchase at a perceived discount gives buyers a bit of conviction here.  There is not much need to observe the overnight profile, more important is to observe any price action if we trade below the overnight low at 3783.75.  Should we revisit this level and not see a similar response from buyers that might reveal a change in the context of buyer conviction.

Below I present the daily market profile first before then after splitting and manipulating the distributions.  Yesterday was a neutral print with a slight upside bias which suggests a decent amount of conviction on the part of the buyers, especially since their range extension was the second one and they defended the move back to the mean.  The second chart gives us clear short term levels to work with today:

NQ_marketprofile_06242014

NQ_marketprofile_06242014_b

Buyers are in a position in the intermediate term to drive higher.  If they cannot however, this entire upper distribution might be called into question by the market and a sharp rejection candle lower may be the final result.  Keep that in mind as the week progresses because sometimes we glean much insight from the market when it does not behave as we expect at certain junctures.

NQ_intterm_06242014

Comments »

Opening Swings: Less Noise

I migrated to a renko chart this week.  I have been observing the renko alongside my minute chart for several weeks, seeking to locate consolidation patterns on the renko when I liked where the minute chart was.  The more I thought about it, and back tested, I noticed I could eliminate the minute chart entirely.  I have talked to several traders who scalp from minute charts, and several who are still recuperating their losses.  Unless you are a thoroughbred scalper, you may want to focus on finding 2-3 spots per session to work from.  With that in mind, the renko is great.  You need to tweak the inputs a bit and observe and backtest the size of the bars to fit the market you trade, but once you do the consolidations can be seen with less noise.

I present the opening swings this week on renko charts.  Because they are not time dependent, I have noted the globex/cash sessions.  I have noted other key observations as well.  And finally below is a snapshot of the entire week’s auction.

MONDAY:

NQ_os_06162014

TUESDAY:

NQ_os_06172014

WEDNESDAY (FED DAY):

NQ_os_06182014

THURSDAY/FRIDAY:

NQ_os_0619&202014

WEEKLY AUCTION SNAPSHOT:

NQ_weeklyRecap_06212014


Comments »

Hot Pocket

Yesterday morning we tested higher early in the session and found responsive selling early.  The action followed through for much of the day until we reached the value area high from Wednesday’s initial distribution.  If you recall, Wednesday traded like two different sessions, thus it made sense to split the distributions in market profile.  The resulting market profile print from yesterday is a normal variation which ended near the middle but lower than Wednesday’s close.

The USA economic calendar is quiet on this Quad Witching Friday, however Canada is releasing the CPI information at 8:30am and we also have Euro-Zone Consumer Confidence at 10am.

The overnight profile is squatted with no clear balance forming.  We however form a shelf at 3784.75, only one tick above the slippery pocket spanning from 3784.50 – 3780 on the intermediate timeframe.  This small pocket is critical in the short term because it separates price from the uppermost auction distribution and the below balance region.  Even more important, sustaining the prices shows the market accepts the Fed rally.  Otherwise, if we drop back down into the balance just below, the entire context is called into question, and the toothy thin zone below our most recent balance becomes a tasty target for short sellers.  I have highlighted this intermediate term structure below:

NQ_intterm_06202014

With that intermediate term context in mind, let’s put our eyes on the short term and find out where we can best gauge price action intraday.  These levels are a bit more subtle to spot today by simply looking at the distributed profile, but when I split it open and observe some of the key characteristics of yesterday’s trade, the relevant levels jump right out.  Use these levels early on today as your sign posts:

NQ_marketprofile_06202014

Comments »