iBankCoin
Home / Market Profile (page 159)

Market Profile

Overnight Rally Fades and We Find Balance

The globex session pieced together a bit of a rally yesterday evening, following through on a wave of upward momentum that rolled into the market late into Tuesday afternoon’s cash session.  The move encompassed 6.25 handles of direction which pressed into the single print selling tail from early yesterday morning.

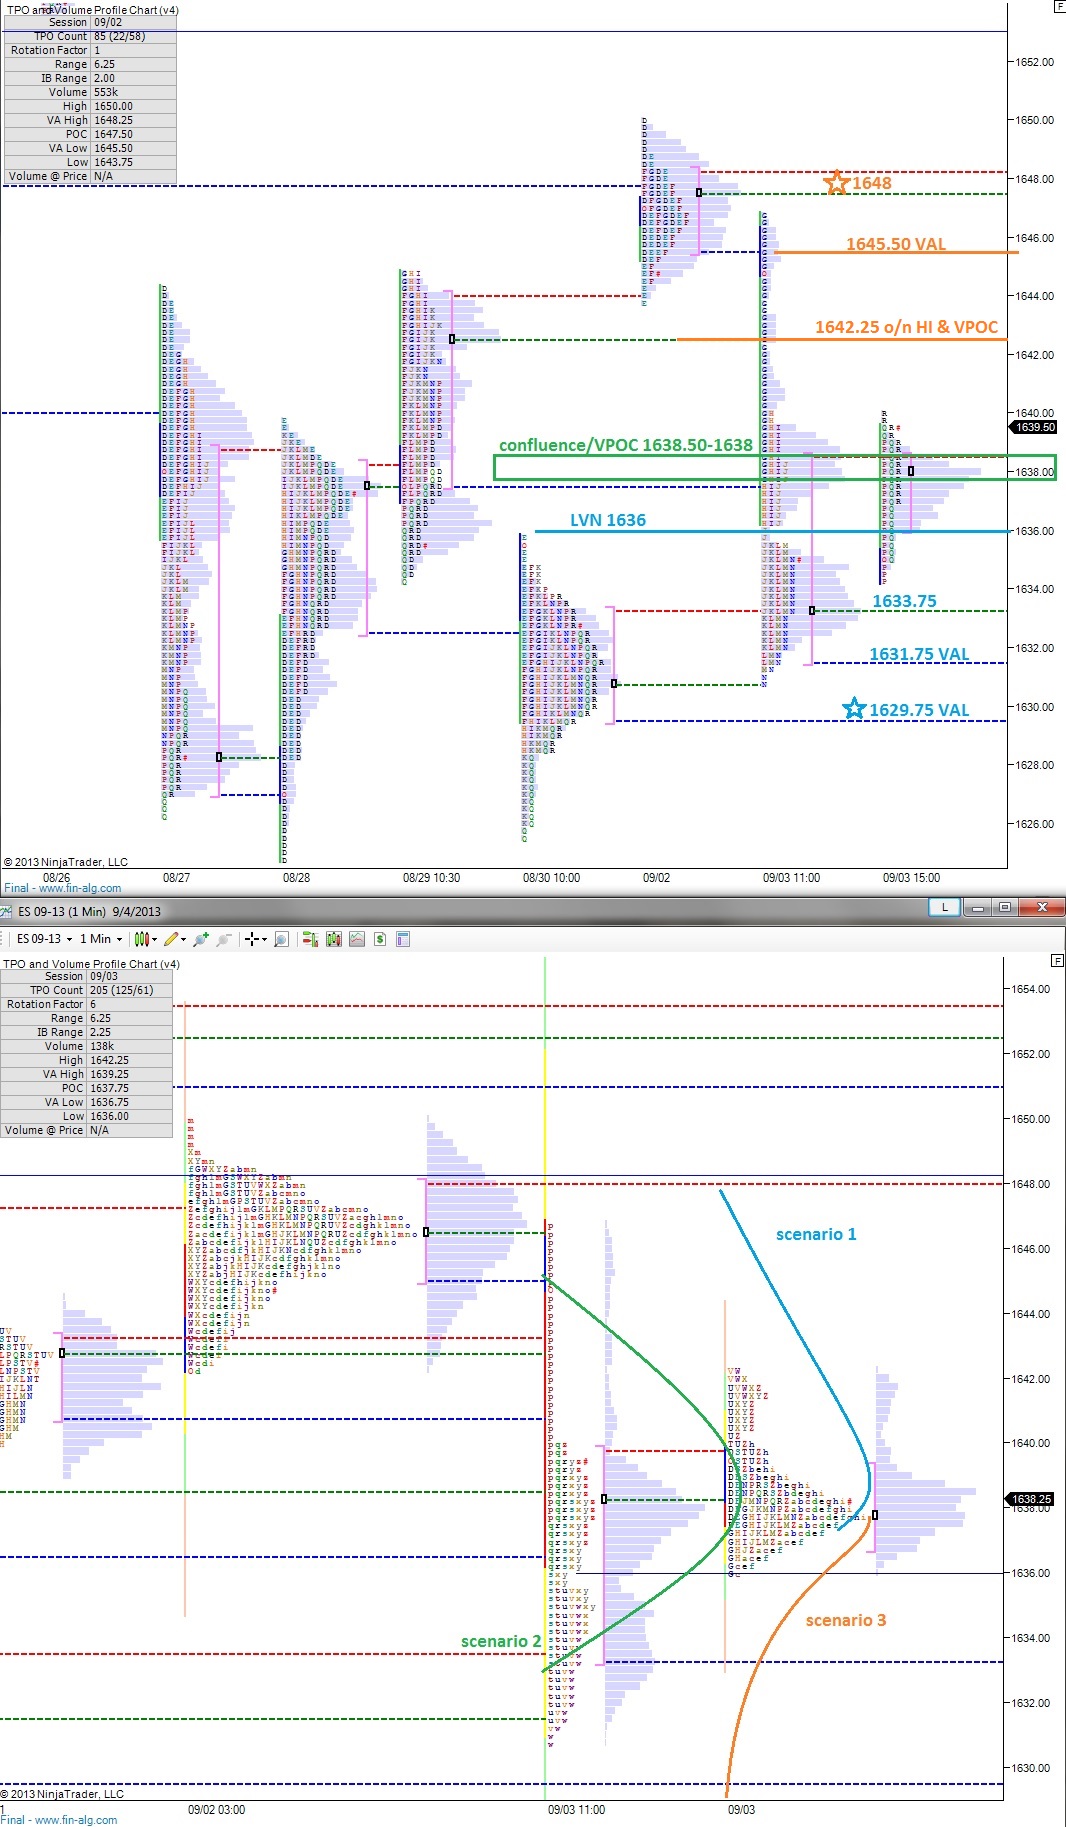
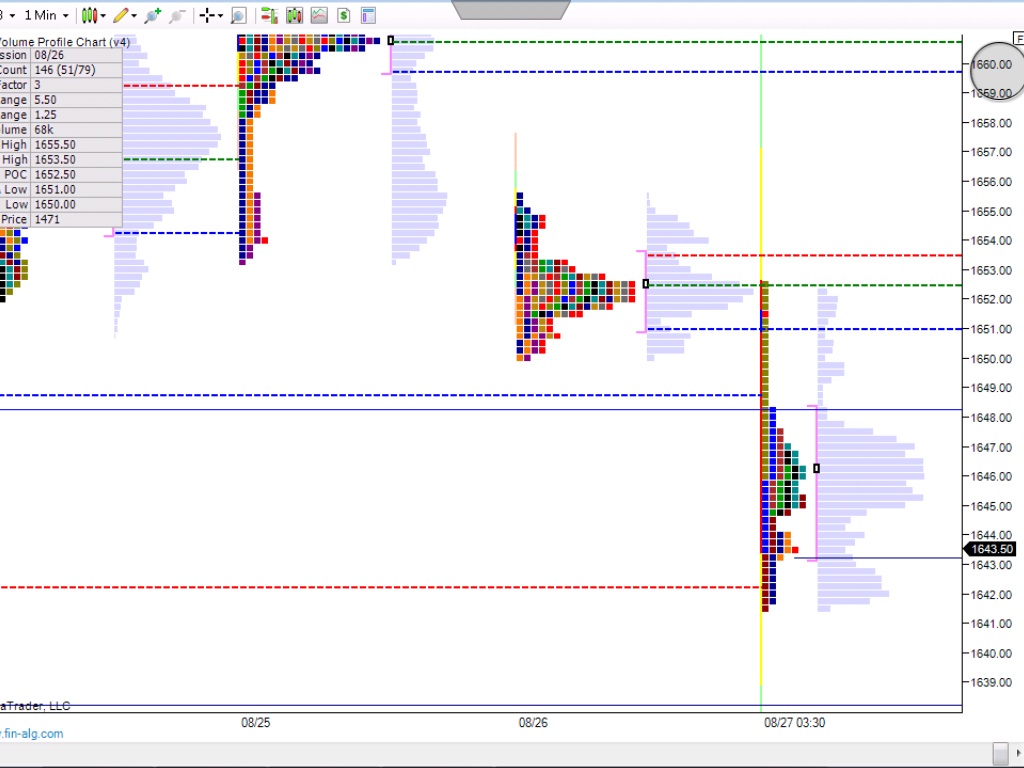
The selling tail yesterday morning was a result of aggressive selling and the action left behind a low volume pocket from 1643.75 – 1639.50.  After setting an overnight high at 1642.25 the market stalled out and failed to sustain trade within the low volume zone.  However, we’ve balanced out since then and I’ll be on watch for a rotation through the low volume zone early on today.

Less may perhaps be more in the /ES_F today as the market is currently flat lining since the evening rally.  The buyers could have made better use of the momentum they carried into the overnight session, which leads me to question their tenacity.

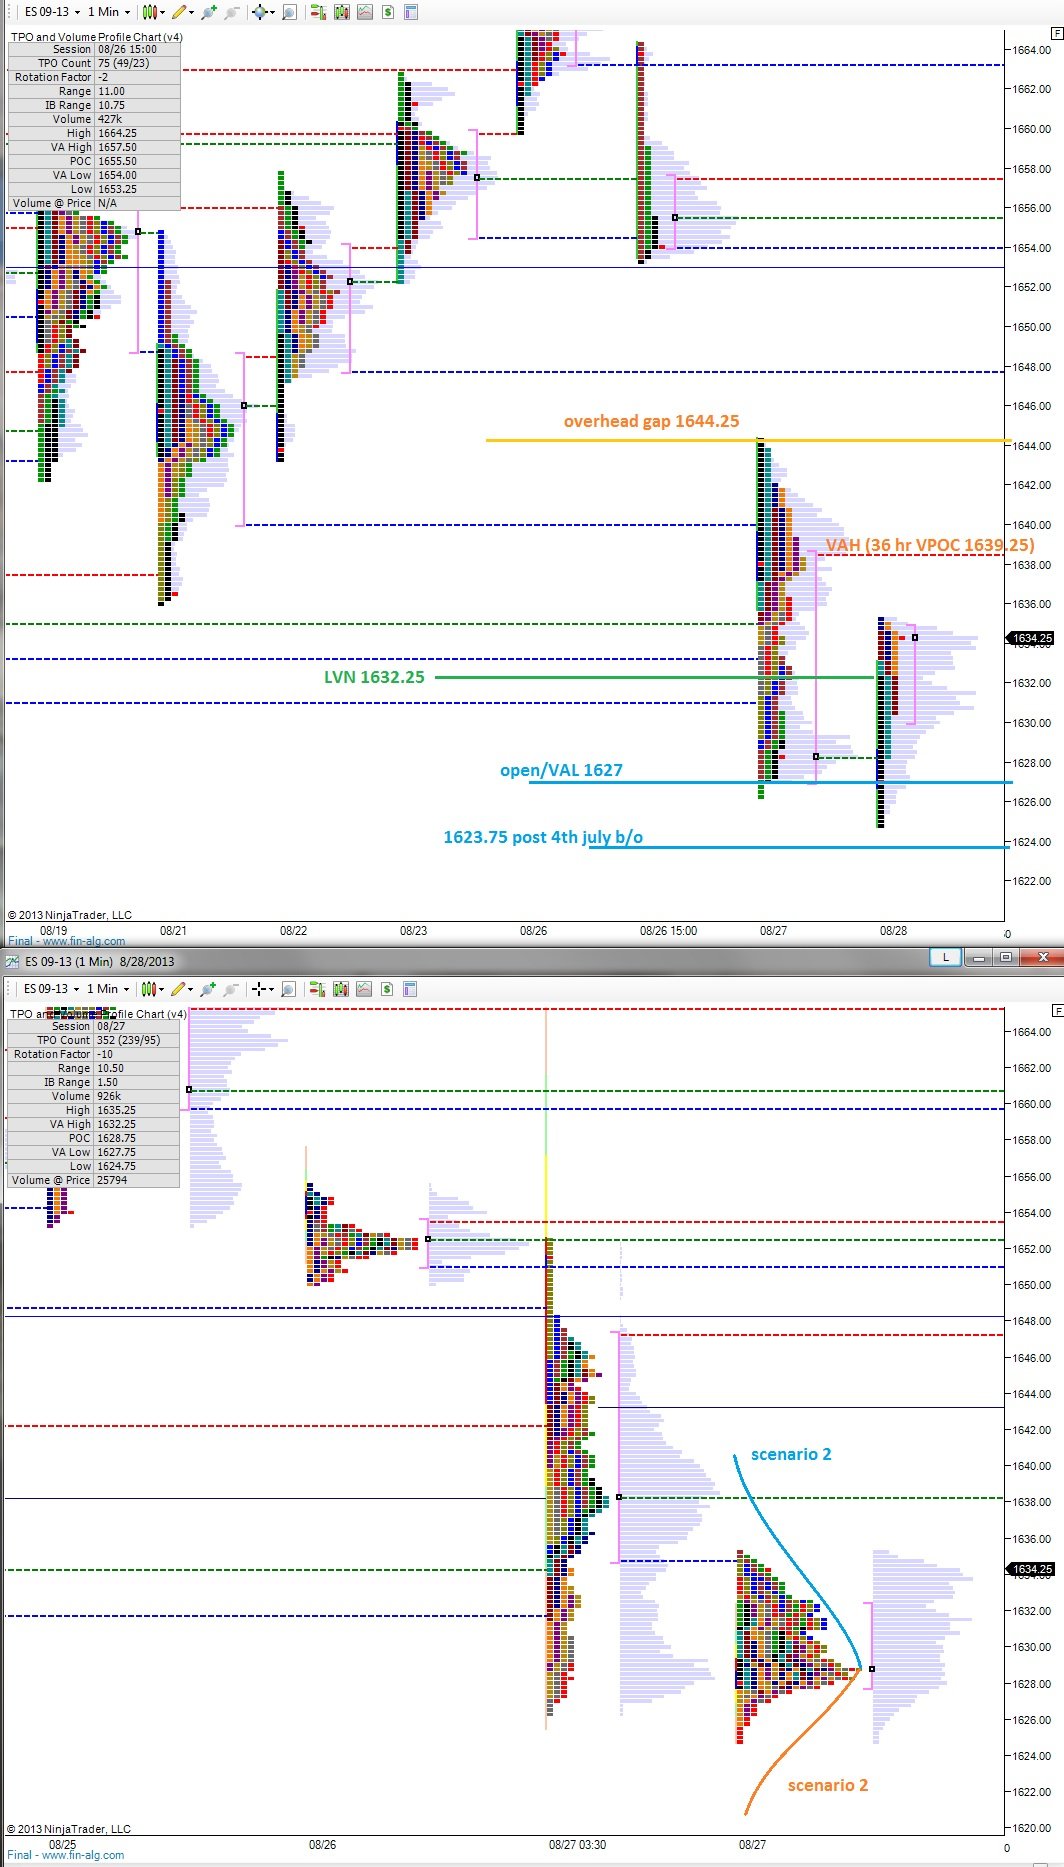
I’ve laid out three scenarios on the 24 hour profile below, none of which would surprise me.  1629.75 is key support should scenario three take hold.  We’ll want to see bulls defending this level, otherwise prudent measures like raising some cash or taking a hedge should be considered.

1648 is key to the upside if we see the stronger scenario 1.  Momentum and profile/auction theory slightly favor a rotation higher, which is why I’ll be closely monitoring if and how the market conforms to scenario 1 this morning.

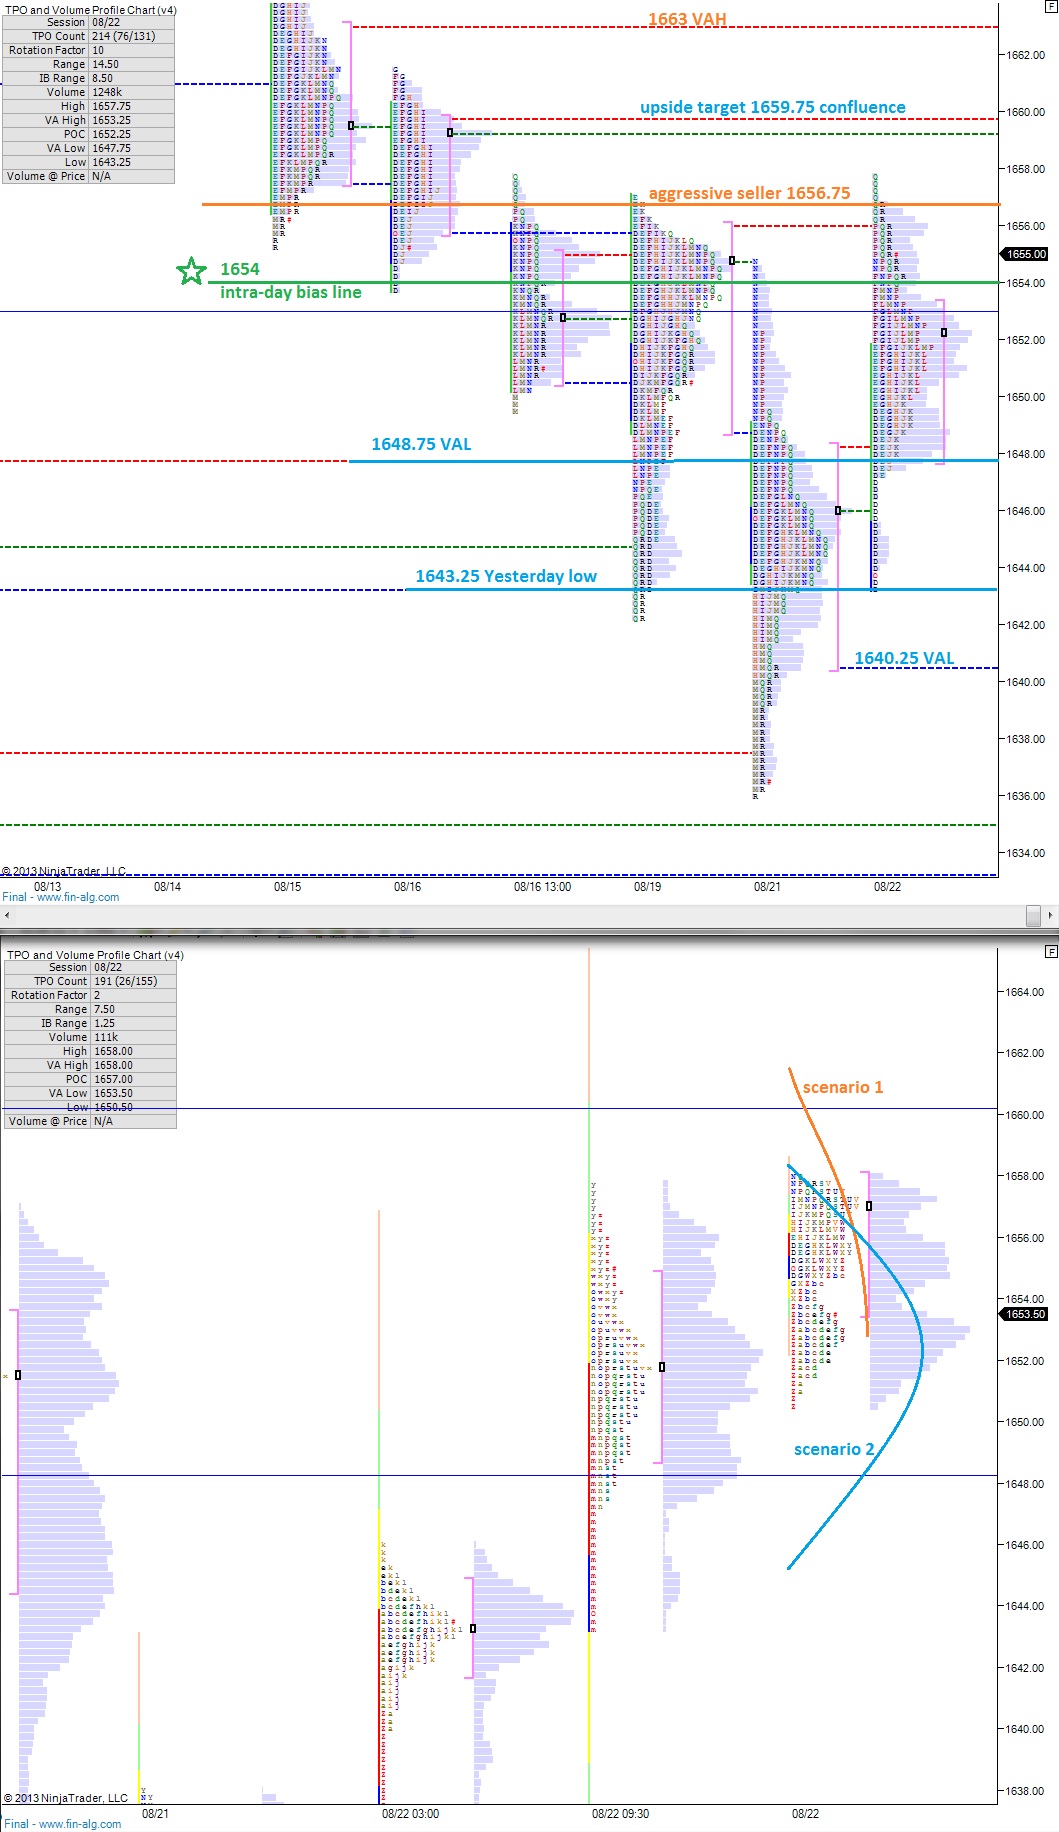
I’ve also noted price levels of opportunity on the following RTH profile chart:

ES_MarketProfile_09042013

Comments »

Organized, Like Crime

I really like the feel I had trading the /ES_F today.  I’ve currently pigeonholed my discretionary trading to conform to the BOSSRAM ALPHA cycle.  This prevents me rushing.  It allows me to measure where we are in the cycle after some broad redundantly calls my phone so she can hear herself talk and position (or hand sit) accordingly.

You see, plates, I juggle so many.

One of my favorite trades in the market requires full attention because it can fly in your face quickly.  I didn’t want to stop trading the chart picture simply because my day job doesn’t afford me focus so I automated it.  This was the birth of ELROI.

Elroi doesn’t trade the picture as profitably as me.  But what he lacks in profitability Elroi makes up in consistency.  Elroi bagged 3.75 handles in profit today on trades that were too racy for me.  I on the other hand, wielding Bossram, made $25 or 0.50 handles.

But it was fun to watch Elroi go to work while I waited for the market to come into the Bossram wheelhouse.  This week I reset my account to $10k: five for me, five for Elroi, and I pulled the rest out to buy cat food.

You see, trading the /ES since April has been by and large a circle jerk and a dangerous one at that.  It came down to losing focus.  I’ve…courourrrected the problem and put several policies and procedures in place to ensure the new habits stick.  My future’s trading operation is looking more like a Fortune 500 company every week.  Goodness, companies like AMZN, GOOG, and SBUX aren’t on these lists by luck.

Learn from their cultures.

Now it’s exciting and I’m happy to fire up my futures every morning.  It’s me verses Elroi.  So far he’s winning.

ON TO STOCKS:

I sold AMBA entirely today.  I told you very clearly I was taking this cheap trick for 10 percent and then taking my business elsewhere.  AMBA fucked me once, I fucked AMBA once.  Perhaps after earnings we can make love, or something.  I earned about 8 percent on the trade.  It was a 12 percent position.

I took profits in Ford(s) because I was watching the /ES_F weaken.  It’s nothing personal.  I still have a 5% position.

My top performers were END and YGE.

RVLT continues to ‘suck goat’ instead of retrofitting Manhattan with LEDs.  Get to work you zoophiles.

I bumped my cash up above 25 percent and was up 1.75 percent on the day.  I needed it.  One thing is certain.  When RVLT stops going down…I’m forecasting champagne showers.

Comments »

Quiet Overnight: Gap Still Intact

The big gap higher over the long weekend is still mostly intact on the S&P 500 as we approach the cash open.  Early this morning a bit of selling entered the market and took us off the overnight highs by a few handles but the market has mostly digested the move, holding above the 08/29 VPOC at 1642.75.

Last Thursday (08/29) featured a poor high which can be seen on the RTH market profile as several TPOs stacked at the top without a single print TPO.  These types of highs are often resolved sooner rather than later and it was an excellent clue we may see some relief strength in the index.

The question today is which of the three scenarios drawn out below come into play today.  The important level to keep in mind for scenario 1 to occur is the aforementioned 1642.75 VPOC.  Should price sustain trade below this level for more than an hour it could signal acceptance of the lower value which often results in rotation back through the value.  That would print either a scenario 2 or 3.

I’ve noted some levels of resistance the market needs to clear in order to print scenario 1.  Most important however is recapturing the zone covering the overnight high at 1649 and 1648.25 which would put the market back into the 08/22 value zone from two weeks back.  The market accepting trade (sustaining trade for more than an hour) within this value area opens the door to a larger upward move, perhaps even triggering a short squeeze to 1674.50.  That would be the bulls crowning achievement if they’re able to accomplish it this week.

I’ve noted these price levels and the three scenarios on the following market profile charts:

ES_MarketProfile_09032013

Comments »

Looking at The Auction Since The 08/15 Selloff

This morning I zoomed out to a larger timeframe and took a look at the S&P volume micro composite.  The following volume profile is built on all the trading activity since the 08/15 breakdown.  In essence, this is the long-term auction taking place since the market sold off.

We can draw some interesting observations from this chart.  The first reference point that jumps out to me is 1655.  The volume point of control, the price where more volume was done than anywhere else from 08/15 – present, is much higher than where we’re currently trading.  Even though we haven’t traded at this level since Monday, value has failed to migrate lower.  This is interesting because price and value always converge, either by value migrating with price or price reverting to value.

If you look at some of the other high volume nodes on the chart, you’ll see price retracing several times to the level.  High volume zones tend to slow price as both buyers and sellers perceive the zone as fair, and they auction the level with volume.

Next I see the low volume nodes.  To me, these are the areas of highest opportunity.  This is where price moves the fastest.  I’ve noted three on the chart: 1649.75, 1641.75, and 1635.25.  The not so great news for bulls is we’re trading below all three levels.  1635.25 held up well until we had the war news from John Kerry.  Since then, the price was rejected once.  Therefore, we want to closely observe this level when the markets open back up briefly Sunday then again Monday evening.

The final observation I make is the negative delta we’re seeing down here.  This is shown as the coloration on the volume profile bars.  This tells us more orders are taking place at the bid, sellers initiating the trade, then orders at the offer.  They are net sellers, but there’s significant absorption taking place.  Imagine a sponge sopping up all the orders without much directional movement.

Feel free to share your thoughts on the following volume profile chart in the comments below:

ES_MarketProfile_08312013

Comments »

Defining Equilibrium

The overnight market in the S&P was unable to breach either the high or low from yesterday’s RTH session which tells me there were no new developments overnight and the market is balancing out.

Part of the balancing process is forming a range or bracketed trade.  It’s important to envision where this bracket may exist so we can fade the extremes back to the mean.  The first level above that I could see behaving as resistance early on is the range from 1640.75 – 1642.  Taking out yesterday’s high could trigger some buy stops on shorts which could lead to a temporary squeeze to these levels.  These levels would then make an excellent short entry.  They also coincide with the value area high of 08/27’s volume distribution.

Bracket lows could be between 1627.75 – 1625.75.  We could take out the overnight lows which could trigger stop orders to temporarily press us lower, allowing for a quality long entry.

That puts our mean, or midpoint, right at about 1634.  Therefore we could target this level during our mean revision trades.

This is only an idea based upon the context of balance.  Should the market receive news that gyrates us out of balance, we could see more directional volatility.  I’ve mapped out a few scenarios on the below 24 hour profile and opportunistic price levels on the following RTH profile:

ES_MarketProfile_08292013

Comments »

ELROI The Algo

ELROY

I began talking about the drone strike algorithm ElRoi during my vacation not because I ever intend to share my coding with the good people of the internet, but instead to get your collective gears spinning about an exciting way of approaching the market.

Imagine earning an average return on your money without the uncertainty of overnight positions.  Take that thought and also consider what could be done with your newly minted free time.  You could learn an instrument, or travel, or stop being an absentee parent.  I, on the other hand, will use said time to trade more markets simultaneously.  Eventually my goal is to trade three unique markets with complete automation, and trade the /ES on a discretionary basis.  All the while collecting my favorite stocks, like baseball cards, to pass down to my kin.

I’ve been trading the ELROI signals since April to enter into the market, but I’ve been managing the exits manually based upon inputs like market profile that aren’t coded into the algo.  Prior to vacation, the system went through a drawdown, then a long (in Elroi terms) quiet period.  That’s when I made the decision to turn Elroi to full automation and hit the road.

It’s almost as if I had to unplug myself to keep from fiddling with the knobs.

The rest as they say is history as Elroi went on a four trade winning streak before taking its first losing trade late into today’s session.  Elroi only traded one contract per trade while I was away, but if someone possessed the capital to meet larger margin requirements, this system could trade much larger size in the /ES as it’s the most liquid financial instrument in the world.

This statistical arbitrage stuff gets me very excited, and promises to be a fun income stream that fits my fringe lifestyle.

I figured the Woodshedder crowd may enjoy a presentation of the following equity curve and data.  Here you go, Woodshedder crowd:


ESROI_EQUITYCURVE_AUGUST2013 ESROI_PERFORMANCERPT_AUGUST2013 ESROI_TRADEANALYSIS_AUGUST2013

Stay tuned for the two week performance results of my new cycle hypothesis, #BOSSRAM ALPHA.

Comments »

$ES_F Midday Update

It has been an interesting session thus far in the S&P futures, where we’ve seen strong volume overnight and near the open but since then it has dropped off significantly.  However, the market has found accumulating buyers after a reactive-type rejection at 1624.75, which is only one handle above the initial breakout point from the post 4th of July rally.

As of this update, the momentum has made a slight turn in the favor of the bulls intraday, and we’re working through the wide value area established yesterday.  A full rotation of the value area would take price to 1639.25 which also marks the VPOC of the last 36 hours of activity.  It’s a logical bull target.

Downside risk increases if we lose today’s lows, and especially if we see the market accepting trade below 1623.75.

I’ve highlighted a few possible scenarios on the following 24 hour market profile chart and noted potential areas of opportunity on the RTH profiles:

ES_MarketProfile_08282013

Comments »

Sellers Escalate The Situation

The S&P futures are lower by nearly 13 handles giving back most of the progress the bulls slowly accomplished since last Wednesday. There’s been an above average amount of volume done and the velocity on this follow through move is higher than normal.

As I write, the bulls are attempting to stabilize price near 1642. This level marks the value area low of the lowest distribution from our recent 8/21 – 8/22 swing low. Failure to establish support here (trade sustained below this level) opens the doors for a retest of the swing low at 1631.50 which is a reasonable seller’s target if we see a liquidation trade occur.

Should there be a full fledged panic liquidation lower, beyond the swing low, I will be looking for signs of buyers at 1623.75, the starting point of the 4th of July rally.

It’s been a while since we’ve seen this fast of a move overnight, so I’m interested to see how it’s received during the open. In terms of momentum, although rapid, we’re already into the third dip. Bar complete liquidation conditions, this downward move is already long in tooth. The dynamic action also left plenty of unfinished business (incomplete profiles) in its wake.

A healthy, rational market could rotate higher and auction levels like 1650.75, the scene of the overnight breakdown and eventually and the low volume node at 1653.75. Eventually, it would come as no surprise to see a more thorough auction of the entire range from 1659.50 (very key level, lots of supply trapped above) to the 1653.75 level.

I don’t have the technology to draw out these scenarios today, so you’ll have to visualize them. But we can still give a reasonable expectation to seeing the market stabilize and properly auction the above levels if buyers are able to perceive today’s pricing as a discount.

A gap and go situation although uncommon is possible today so use caution and predefined stops with any attempt to fade the market.

image

image

Comments »

Our First Visit To The Gap Gets Faded

The S&P futures printed nearly a 10 handle range overnight, printing a fragmented profile in its wake. The lack of any symmetrical shape clues us to the lack of balance in this price range.

As we approached midnight a a rally ensued but was entirely given back. We didn’t quite make it into the gap above 8/15 before supply came into the market. Going forward this week, it will be interesting to monitor any further strength in the market and whether or not price takes out today’s globex high at 1667 since swing high/lows most often occur during regular trading hours.

By this I mean we’re likely to see a more active test of the gap soon, where we can more actively assess the condition of the supply overhead.

Capturing 1559.50 was the accomplishment of the week for the bull camp. We’re trading right around this level early on. Whether buyer or sellers make the initial push from this level will be our early look into the market sentiment.

image

image

Comments »

1654

Buyers push.  Sellers pull.

1654 a battleground

From it, our bias formed

The first level catching my eye this morning is 1654.  Back in July, we rallied up to this point, found quite a bit of selling force before eventually the force of buy flow became too great and sent us spiraling higher to all-time highs.  The price level wouldn’t be visited again until late last week, where buyers worked adamantly to convert the prior resistance into support.

Since losing the level, we’ve tested it several times, and it’s been an environment where sellers are absorbing buy flow and reacting aggressively.  Overnight, we’ve churned around this level, but oddly enough, the price level marks a low volume node on the profile.  Price continues to behave like two magnates with the same polarity at 1654, flinging price away.  Something is afoot at 1654.

Into Friday’s tape, I’ll be keen on my observance of 1654 to see who establishes trade relative to the level.  As we approach the 7am hour, we’re pricing just below the level and the buyer’s momentum has stalled out a bit.  It wouldn’t surprise me to see sellers making the first move today.  However, control of the afternoon will be paramount going into the weekend, and they know that, which may keep sellers quiet early on.

The overnight profile marked a poor high at 1658, a point shy of my upside target for the latest move.  Any trade above 1660 would mark quality progress for the bulls.  Sellers will want to pin us deep into Wednesday’s value area, pressing south of 1644, the opening print yesterday.

I’ve highlighted these levels of interest and also mapped out a few scenarios on the following market profile charts:

ES_MarketProfile_08232013

Comments »