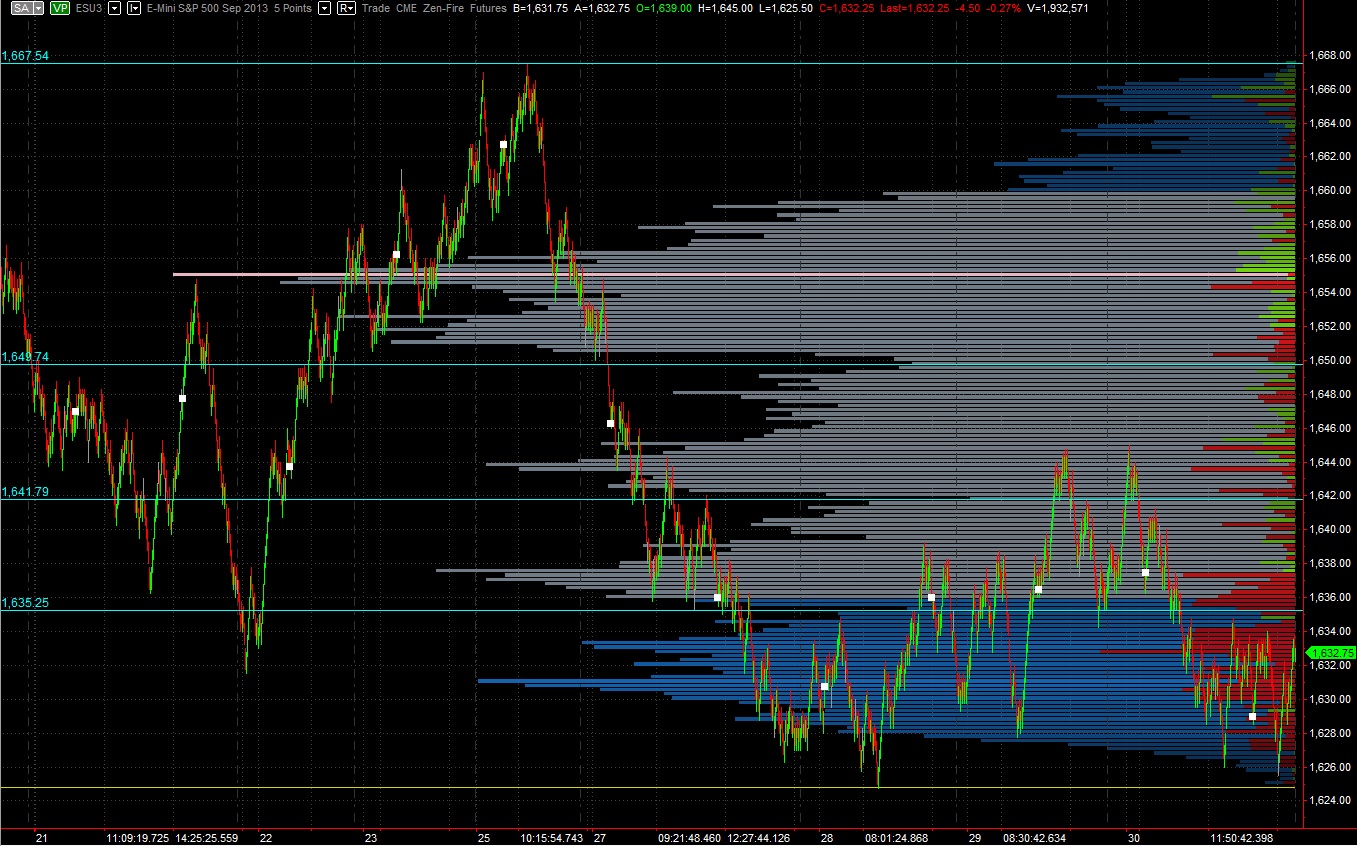
This morning I zoomed out to a larger timeframe and took a look at the S&P volume micro composite. The following volume profile is built on all the trading activity since the 08/15 breakdown. In essence, this is the long-term auction taking place since the market sold off.
We can draw some interesting observations from this chart. The first reference point that jumps out to me is 1655. The volume point of control, the price where more volume was done than anywhere else from 08/15 – present, is much higher than where we’re currently trading. Even though we haven’t traded at this level since Monday, value has failed to migrate lower. This is interesting because price and value always converge, either by value migrating with price or price reverting to value.
If you look at some of the other high volume nodes on the chart, you’ll see price retracing several times to the level. High volume zones tend to slow price as both buyers and sellers perceive the zone as fair, and they auction the level with volume.
Next I see the low volume nodes. To me, these are the areas of highest opportunity. This is where price moves the fastest. I’ve noted three on the chart: 1649.75, 1641.75, and 1635.25. The not so great news for bulls is we’re trading below all three levels. 1635.25 held up well until we had the war news from John Kerry. Since then, the price was rejected once. Therefore, we want to closely observe this level when the markets open back up briefly Sunday then again Monday evening.
The final observation I make is the negative delta we’re seeing down here. This is shown as the coloration on the volume profile bars. This tells us more orders are taking place at the bid, sellers initiating the trade, then orders at the offer. They are net sellers, but there’s significant absorption taking place. Imagine a sponge sopping up all the orders without much directional movement.
Feel free to share your thoughts on the following volume profile chart in the comments below: