iBankCoin
Home / Futures (page 151)

Futures

Stop Kissing All The Babies

The NASDAQ and equities in general treated my tattered tech portfolio to a bit of respite while I toiled away at various campaigns of industry and trading methodology.  My trading plan and its autonomous counterparts continue being built and optimized into a plan I intend to take live.  There is no amount of planning I consider excessive by this point in my trading experience because I have seen what this market can do to a person, intraday, without the rights set of tools and planning.  One must exude a high amount of discipline and execution to have even a chance at success in the futures markets.  The same rules apply to stock trading too.

The blood moon crests over our heads at night and its presence brings the parts of our life that we may be reluctant to address to the forefront.  The big white moon acts like a giant mirror and shows us where our shortcomings exist and then paints them blood red.  It can be a very unpleasant experience but it can also end well if we take the time to digest the introspective and use our stronger abilities to foster and settle our weaknesses.

My weakness is an excess of hope and opportunism.  I will run 100 miles per hour into a wall by over committing to all the opportunities I see.  This is how I end up with 20-25 positions.  This is also why the long term sellers of equity introducing MORE opportunity into the marketplace via IPOs troubles me.  If I don’t get a wrangle on my desire to peruse all the business opportunities out there I will end up in a sanatorium.

In summary, I plan to tighten up my book into 2-3 intermediate term trades lasting anywhere from 1-12 days, and 3-5 multi-quarter investments.  That way I can give proper focus to order flow trading in the futures market and my other enterprises—which I will not be expanding upon.

Sometimes I get lucky and I can trade around an investment like I am doing to Twitter right now.  Twitter is one of my top three stock positions and I took some YOLO options for a spin this afternoon with precision.  The harder I work, the luckier I get.  This trade was entered minutes before news hit the wires that Twitter headhunted some big time Google Maps fella.  I already have taken scales because I couldn’t care less about making a huge win on this trade.  Instead I am managing risk and putting a winner in the book.  Blood moon knows I need it after this string of April losers:

YELP, KNDI, WUBA, GOGO

I suppose one of those goof balls may still toss a hail marry to my egregious strike prices, but I am not expending too much hopium on that happening in the next two days.

Other action today was stopping out IMGN at nearly a -30% and ENPH for about a -15% if I recall correctly.

Less, more succinct trades and going easy after a win is how I am going to improve from here.  This applies to all timeframes of trade.

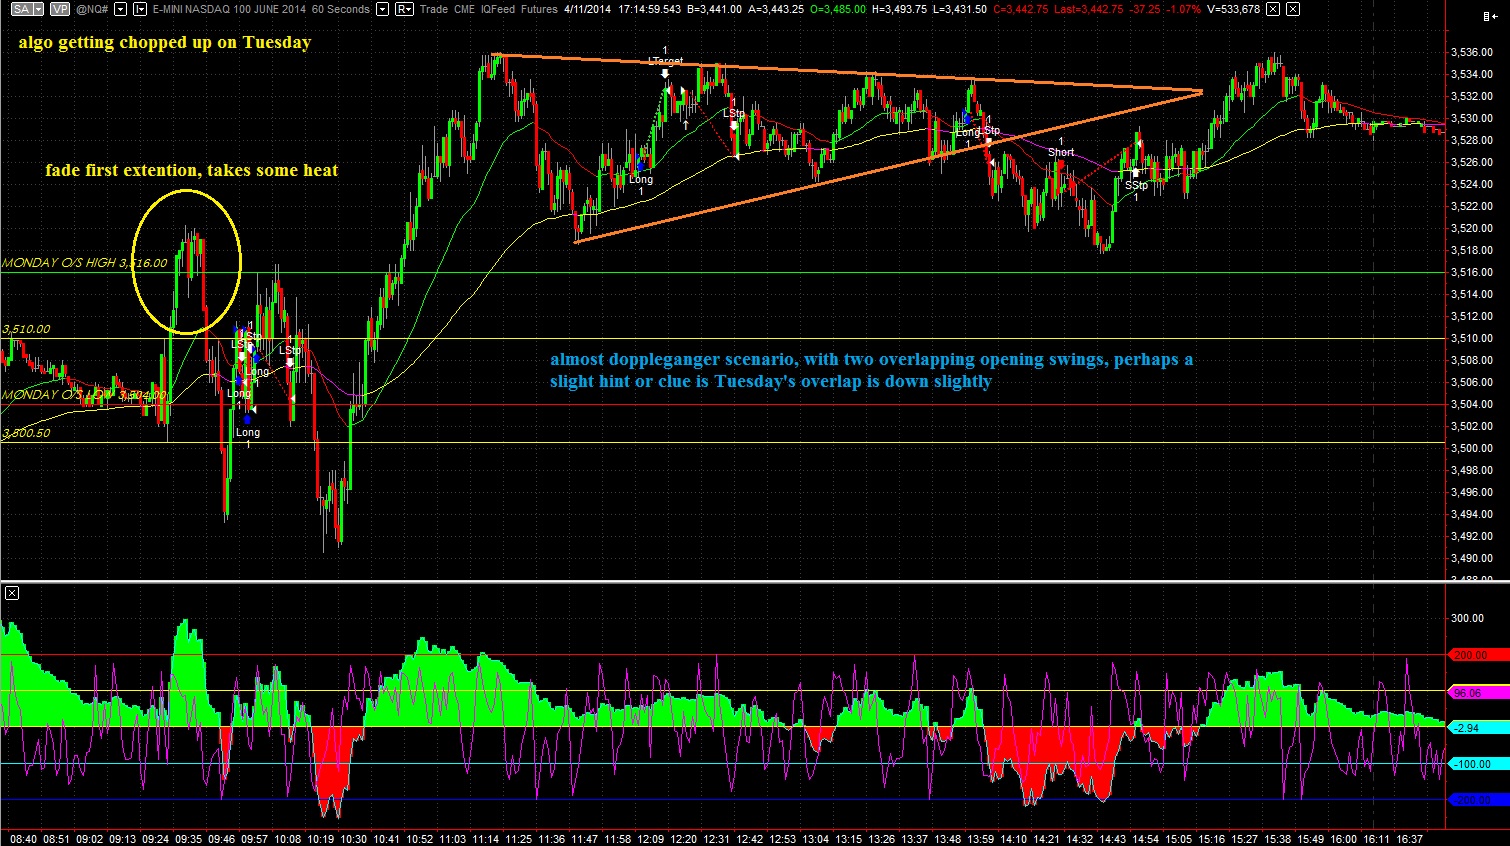
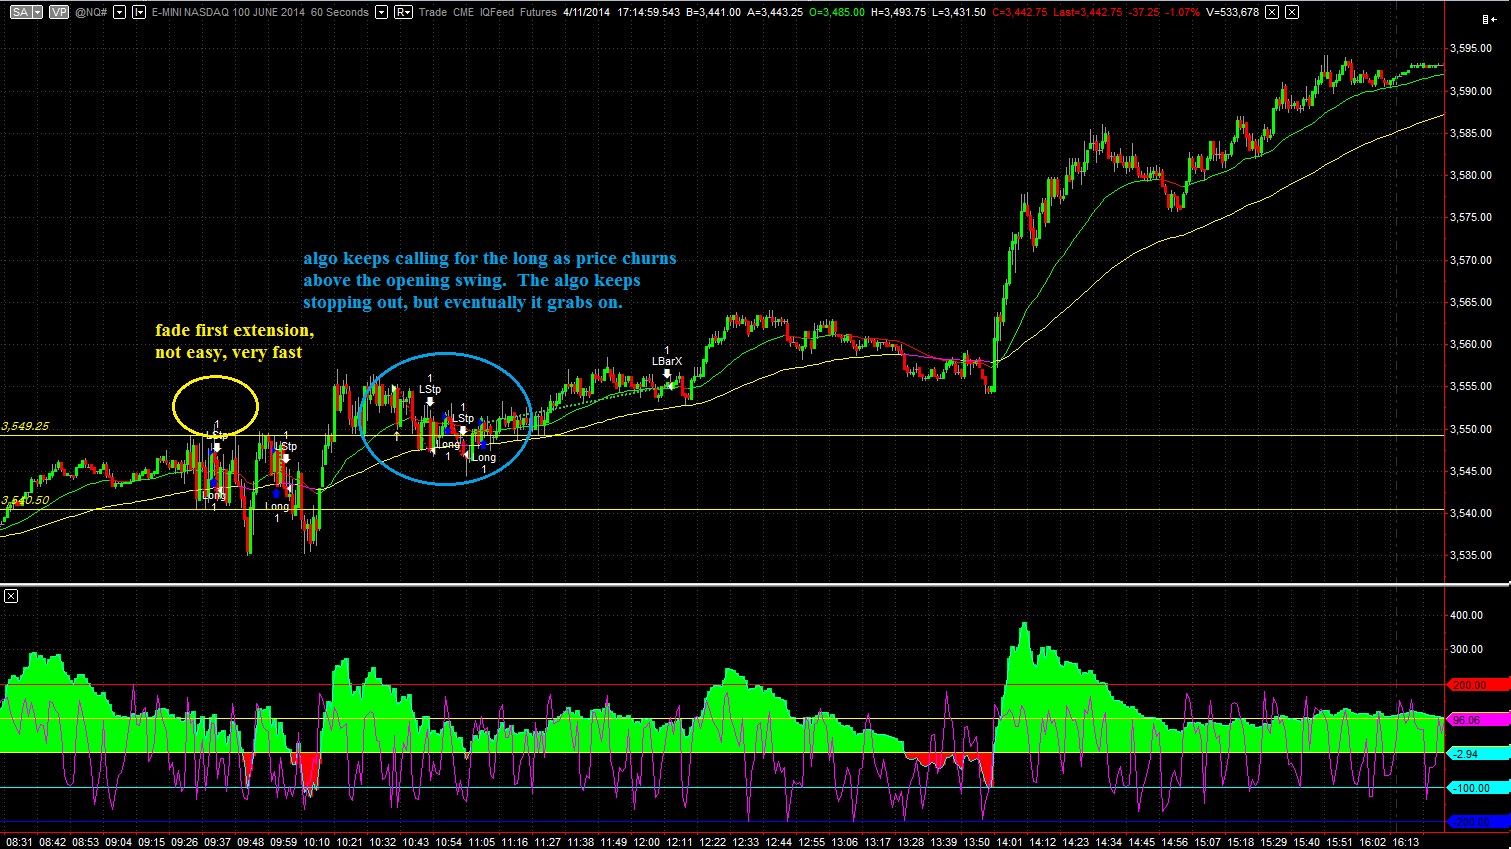
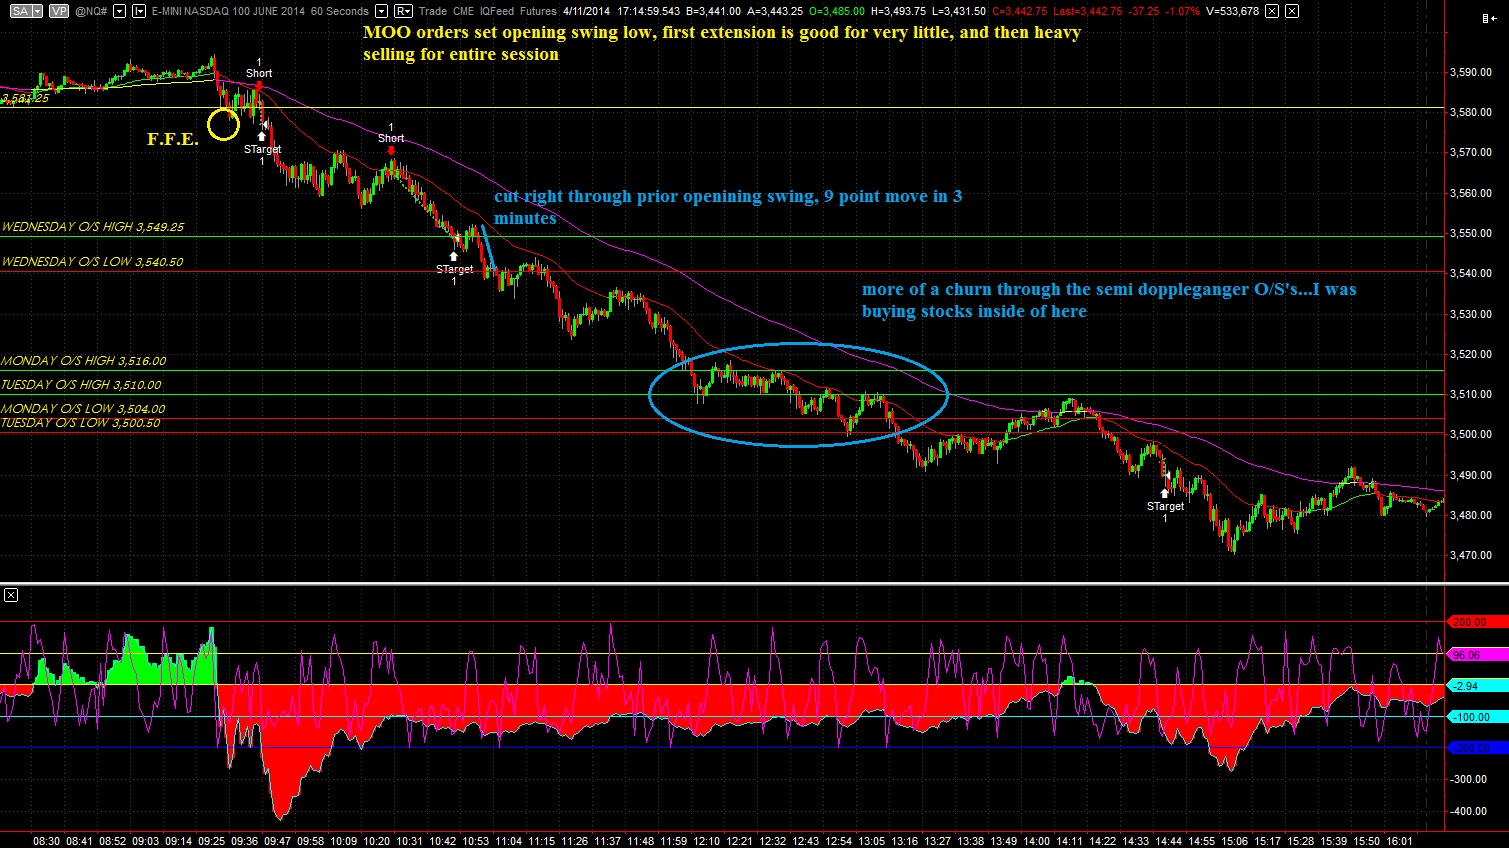
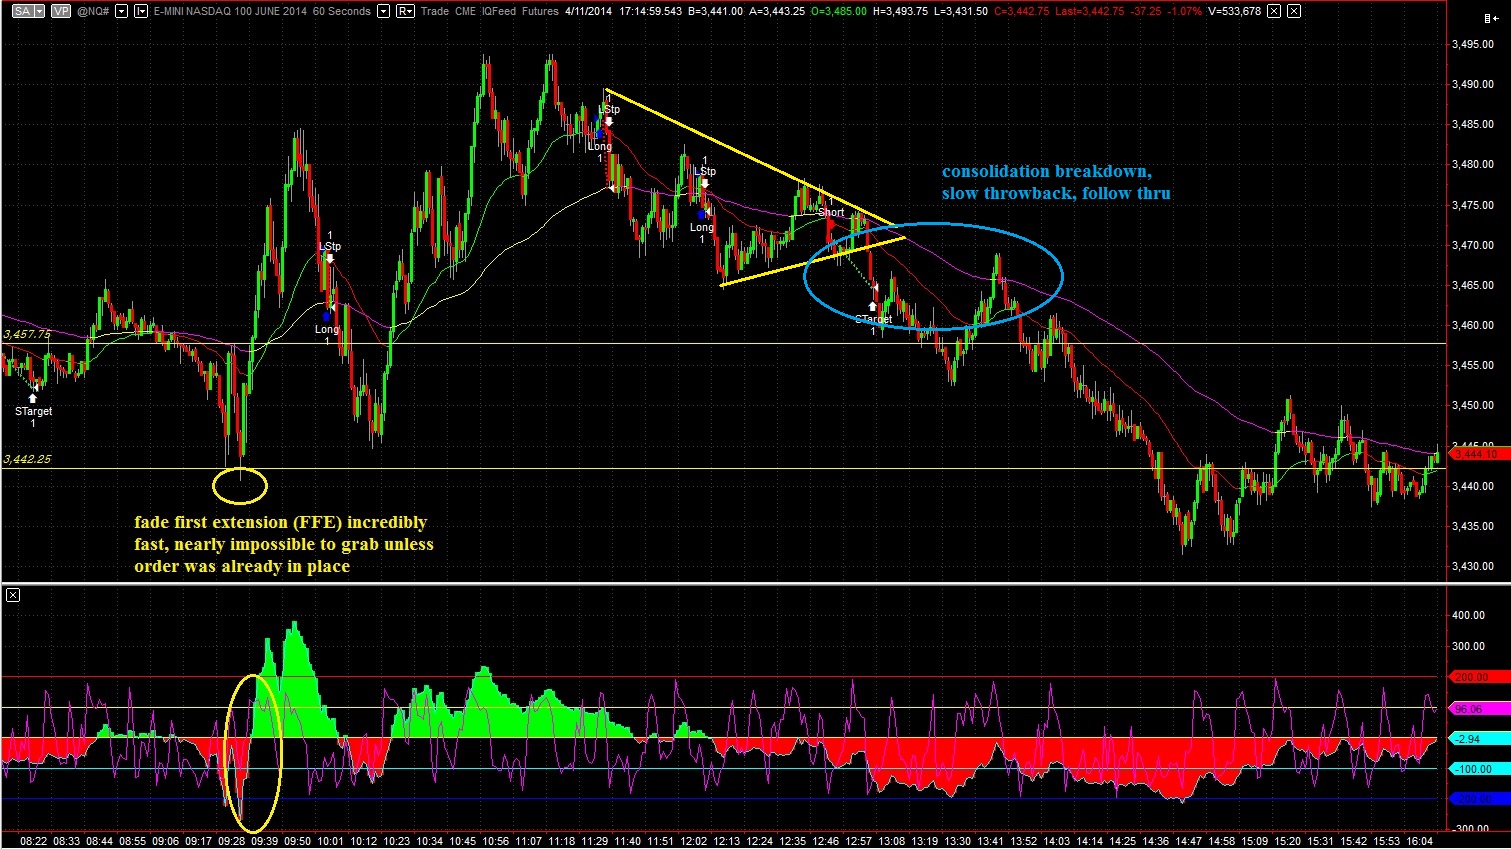
+1.3% on the day, -13% on the year, Elroi the algo still in testing (grr)

http://youtu.be/6AIdXisPqHc

Comments »

Hunting a Trading Range

It has been a busy morning in the futures market as premarket participants digest CPI data as Janet Yellen prepares to speak.  The reaction thus far to a slight uptick in CPI was a pop and fade.

The intermediate term auction continues to appear seller controlled with swing trades showing a series of lower highs and lows.  The question now is whether market supply will continue driving prices down on the intermediate term, or if instead price will stabilize and revert to the mean.   There is data supporting the latter outcome and that my expectation.  However, I respect the trend playing out on the intermediate term and must be willing to shift my stance should my expectation not occur.  I would not change this vision of a bracketed trading range developing if we took out our recent swing lows, but it would be a progressive step.

On the day timeframe auction, little changed between Friday and Monday.  We printed an inside day where our daily range was within the range of Friday and we also printed a neutral day with range extension to both sides of the initial balance.  Both of these characteristics suggest indecision on the part of buyers and sellers.  We printed an excess low yesterday which suggests we may see some follow through by swing buyers today.  I have highlighted this excess low as well as a few other observations on the following regular trading hours NASDAQ market profile:

NQ__MarketProfile_04152014

Comments »

The Edge of Balance: The Reward Zone

We have some early strength in the NASDAQ index futures.  The question on everyone’s mind this morning is whether we will see the early weakness get faded by strong sell flow or whether the higher advertised prices encourage buyers to enter the marketplace.  The former has been more prevalent for the last two to three weeks.

For today’s presentation of the intermediate timeframe, I chose to build out the volume profile based upon the 72 trading sessions completed thus far this year.  From the volume profile emerges some unique clues into whether the intermediate term is balanced or readying to explore lower for value.  The pattern of lower highs and lows gives sellers a clear momentum edge on the intermediate timeframe, but what is volume suggesting about value?  We do show some consensus of value around 3550 which you will notice is below the midpoint of our annual profile.  This suggests value has built lower and adds support to the idea of a continued migration lower.  However we do show a semblance of the bell curve too which makes the mean revision trade still a viable thought, although one which needs to engage sooner than later.  Also, any bounce which materializes much be carefully observed verses the very low volume node at 3580.  If price cannot gain acceptance above this level we would further expect price to continue lower.  I have highlighted these observations and a few others on the following annual volume profile distribution:

NQ_VolumeProfile_intermediateTerm_04142014

The short term auction suggests buyers have an edge this morning.  We had a rather thorough auction during our globex session which built an excess low which can be seen as a thin tail below the profile.  This suggests responsive buying and sellers drying up.  As the USA comes online we are seeing the large value area from Friday gain acceptance via volume building higher on our current profile.  This creates the expectation for trade through Friday’s value.  I have highlighted Friday’s value area and the key levels inside of it on the following market profile chart:

NQ__MarketProfile_04142014_afternoon

Taking our attention out to the long term we can see the buyers no longer clearly in control of the long term auction according to the daily chart.  We are trading below our moving averages which are flat at best and some moving lower.  We are still above February lows and we may see a balanced, bracketed trading range form.  Overall the long term auction is in balance until we take out the February lows.

Comments »

Opening Swing: It Takes Tools To Make a Swing Go Right

I started live trading the first range extension after the opening swing is printed.  I was using a DOM for trade entry and I immediately remembered why I dislike the DOM so much.  It is a very distracting tool, in my opinion.  The market is noisy enough as it is.  When you add the flickering of this device into the mix trading becomes even more obscure.

I will continue testing the strategy next week and I am setting chart trading up over the weekend.

One of my observations from trading this setup live is how incredibly fast it happens.  I can sit here in retrospect and circle the idea, but the live environment gives you seconds to get your entry in.  Also, the trade can take immense heat in seconds.  Without a rock solid plan and execution, this high probability scalp trade is destined for failure.  It appears the best approach is a limit order set in place beyond the opening swing on the chart.  Then as price exceeds either extreme your entry is hit and filled.

I thought the overlapping of opening swings on Tuesday/Wednesday was an effective piece of context.  I was a buyer of swing longs against it.  However, the prices did not hold off sellers who cut through them with a slow grind lower.  I am so familiar with being on the right side of the slow grind.  Usually sell flow is much more knife-like.  Anyhow I found it odd and powerful to be on the receiving end of a grinder (Thursday afternoon).

The infamous Elroi can be seen on my charts today.  He has been getting chopped up pretty good during the opens.  I have always found his signals to be more potent later into the session but I like to see the signals because they give me insight into how other algorithms are performing.

Here are this week’s opening swings in the NASDAQ.  Feel free to share your thoughts and observations:

MONDAY

NQ_OS_04072014

TUESDAY

NQ_OS_04082014


WEDNESDAY

NQ_OS_04092014


THURSDAY

NQ_OS_04102014
FRIDAY

NQ_OS_04112014

Comments »

Where The Rubber Meets The Road

Equity futures gapped lower overnight displaying strong follow through on yesterday’s trend day.  As the USA comes online the S&P is down nearly 10 points and the NASDAQ about 20.  We have an hour until the cash session begins to recapture some of this downward progress but this is otherwise known as a pro gap.  Essentially that means the risk is elevated beyond a level most retail traders can handle in the event they attempt to fade the move and close the overnight gap.

I am of the opinion that with the right tools we can formulate a sound method of participating in this gap, and the most important tool today is market profile.  On Wednesday morning, I highlighted two key price zones which tell the story on the NASDAQ.  One was a low volume price zone above.  We traded ALMOST the entire range of that upper zone before stalling and being rejected out.  Auction logic would suggest a move to the lower end of this bracket to see if buyers possess the same conviction they had down here.  This takes us to February 4th, a rather interesting day.  Have a look:

NQ__MarketProfile_04112014

I won’t get too deep into observation of the above except to say this type of well defined profile structure is VERY useful for leaning on.  I will look to buy as close to the value area low at 3431.50 as possible.  Here’s the current market profile picture:

NQ__MarketProfile_04112014_current

The intermediate timeframe auction is in clear seller control.  They have this timeframe locked into a pattern of lower highs and lower lows.  I have highlighted a few very interesting low volume nodes we are coming into this morning on my volume composite:

NQ_VolumeProfile_intermediateTerm_04112014

Finally, the long term auction.  On the daily I show balance with sellers still pressing.  But on the weekly, there is something keeping me on the buy side, a squiggly line.  We may overshoot this reference point, given the markets current velocity, but I am leaning on this level nonetheless until we make a clean break:

NASDAQ_WEEKLY_04112014


Comments »

Active Overnight Session and How It Fits inside The Big Picture

Futures traders had some action early this morning when equity futures abruptly fell out of balance and knifed lower.  The wave of selling rolled in around 5am and it was soon met with responsive buying.  The overnight profile shows no clean consensus on value and we are currently trading near unchanged in the NASDAQ.

I will always buy the first test of my EMA if I feel the chart is still trending and the EMA resides at a higher low then our previous swing high (or lower high then our previous swing low).  However, the buying is typically the easy part of this trade.  Knowing whether the trend will resume or whether price will roll tide back is the management key.  The very long term auction as seen on the weekly composite chart is still buyer controlled.  We were buyers ahead of the 33 EMA which has now edged higher to touch the low print.  Did you know moving averages move?  See below:

NASDAQ_WEEKLY_04102014

The daily chart which I most commonly refer to as the long term auction is no longer a clear picture of buyer control.  Our EMAs are not in full alignment and our longest term EMA, the 99, is flat.  We have also seen a pattern of lower highs and lows recently and it appears the long term timeframe is in balance.  Now buyers and sellers must slug it out before one or the other becomes the clear controller of the long term auction.  However, buyers have a slight control edge remaining (see blue circles on major swing levels).  See below:

NASDAQ_DAILY_04102014

The intermediate timeframe is seller controlled.  Their control can be seen as a series of lower highs and lows.  Yesterday’s action was dynamic and powerful to the upside, but until we see a higher low printed, the sellers have the ability to assert control on this timeframe.  I have removed all the lines I normally keep on this chart so we can more clearly view the seller control.  There are some very interesting low volume nodes if you click and enlarge the chart, and these make great entry points because they often see “hot plate” type reactions:

NQ_VolumeProfile_intermediateTerm_04102014

The short term auction is buyer controlled.  This can be seen as a migration of value higher as well as strong responsive buying tails on the recent profiles.  We are trading inside the price zone I highlighted yesterday as a low volume slip zone.  This zone is so important.  If buyers can finish trading up through it, and then gain acceptance via value up above 3602.25, this would translate well into gaining control of the intermediate term at best, putting the intermediate term auction into balance at the least.  I have highlighted this interesting zone on the following market profile chart as well as a few other observations:

NQ__MarketProfile_04102014

Comments »

Cut Through The FOMC Noise With Two NASDAQ Price Zones

If you do not have time to read the entire context report, skip to the last paragraph/chart for the Two NASDAQ price zones you need to navigate the FOMC reaction-to-the-reaction-to-the-reaction.

Buyers showed up overnight and as the USA warms up we have a slightly green NASDAQ market.  One of the features of this multi-week selling has been mornings which start strong only to be faded and eventually wind up with price closing near the low of the session.  However, just when you think you have the markets number it will throw you a slider.

Let’s have a closer look at the long term auction and why I suspect a bounce is near.  Also, let’s look at what will begin to worry me and cause me to really tighten my book up.  See below:

Weekly Chart (long term auction):

NASDAQ_WEEKLY_04092014


DAILY CHART (long term auction):

 NASDAQ_DAILY_04092014

Intermediate term we are still seller controlled but stretched.  This increases the likelihood of a big move in either direction, either a continuing to stretch the boundaries of the market to the downside or a snapback move.  With FOMC minutes out this afternoon, the likelihood is even greater.  You can see price has reverted back to my 33ema and paused.  The market is very likely waiting for FOMC minutes before deciding the next move.  More importantly to us is how the market reacts to the price reaction we see this afternoon.  This is not to say the first move is wrong or fake, but instead that long term participants are likely to be moved by the action and if they are we need to observe their order flow.  I have highlighted some key intermediate term levels on the following volume profile composite:

NQ_VolumeProfile_intermediateTerm_04092014

Finally the most delicious and powerful timeframe of all, THE SHORT TERM auction.  These profiles are set up more exciting then I have seen in a great while.  We have very low volume slippery zones on both sides of price right here, right now.  The short term is in balance with buyers trying to take the early initiative to break the balance.  On my market profile chart you will see a thick pink and a lovely chartreuse green line.  These two levels are the edges of where very low volume starts.  A breech of either (or both) is very likely to see an acceleration of price in that direction.  Which side of this environment we end up on will ultimately dictate the control on both the short and intermediate term.  In the meantime, it produces a massive trading opportunity to “go with” a move that penetrates either zone, intraday.  See below:

NQ__MarketProfile_04092014

Comments »

Big Picture Shift

Index futures are flat to slightly down overnight as the market begins finding buyers and forming a balance.  As the USA warms up we are set to open inside of yesterday’s value.  This is a lower risk/reward opening position, however we are still in an overall riskier environment.

I continue to focus on my market profile which is a footprint of the short term auction.  The NASDAQ is coming into balance on a ledge.  If go back to the auction that occurred in early February last time we traded at these levels, then you can see a series of single print TPOs.  These signal two things: first there was very strong demand at these prices last time they traded.  Second, the thin volume is slippery and price can slide right down it.  Often times a legitimate volume pocket holds as support on the first test.  It is each subsequent test that weakens its defenses until finally a swift move zips right down it.  I have highlighted this level on my market profile chart.  It looks to be holding this time around:

NQ__MarketProfile_04082014
A short covering rally starts to make sense with FOMC minutes out on Wednesday.  A short seller who has made a profit from this recent move down may seek to lock in some of that profit ahead of a Fed meeting because as traders we have been conditioned to expect market movement during these times.  The intermediate term is very stretched too, which means the snapback becomes more likely as time progresses.  Have a look at the zoomed out intermediate term.  Note we also cleared an open gap dating back to February 6th.  Remember, gaps always fill, but timing is key.  Can you imagine waiting through all of February and March for this gap fill?  You would be insolvent.

NQ_VolumeProfile_intermediateTerm_04082014

The long term auction is starting to look balanced.  It has been buyer controlled for a very long time and today is the first day I am changing my perception of the long term auction.  It is in balance.  My expectation now is for the long term auction to go range bound.  That means it is time to start trading futures again.

In summary, balance on the short term, seller controlled and stretched on the intermediate term, and the long term auction is coming into balance.  I am cautiously looking to build longs here for a snap-back higher as the long term auction settles into bracketed, balanced, range trade.

Comments »

Finding The Origin of Demand

Index futures are down overnight as the selling which quickly began mid-last week spilled into the globex session.  The entire move was quite exhausting as the USA comes online we are seeing some early buying interest.

My main focus today is on the short term auction.  Price has come down to a very interesting level on my market profile.  We are reaching a level where demand was once very high for equities.  I can tell this by the dynamic footprint which was left behind as a long and thin single print of TPOs.  As we come into it from above, the risk is slipping down the4 viscous slope where demand once existed.  The contrary move would be for us to not breach the upper reference point just before the slip zone.  I have highlighted where this slip zone begins and ends on the following market profile chart.  Should we not breach this level, I may be a buyer early on:

NQ__MarketProfile_04072014

The intermediate term is seller controlled after briefly coming into balance.  The market was able to make a higher low, higher high briefly before the big liquidation snap Thursday and Friday.  For a moment we came into balance but when price travelled into overhead supply the market became overwhelmed with sell flow which was abundant compared to demand which was nearly non-existent for the two days.  Since then we have made a lower low putting sellers in control.  I suspect a revision trade will take hold at some point this week and return price to my EMAs.  I have highlighted a few key price levels on the following volume profile composite.  We are set to open nearest to 3511.25:

NQ_VolumeProfile_intermediateTerm_04072014

The long term auction is certainly in question.  One could perhaps make the case for buyer control based on the February low being below here.  I am not quite as clear on the long term.  I will call it buyer controlled with a 50% chance of balance taking hold.

Comments »

Opening Swing: The Doppelgänger

These last few weeks have been as risky as any I have ever seen for momentum trading.  The NASDAQ has been suggesting this environment via large ranges, big overnight gaps, and harsh periods of selling.  Through all the difficult market conditions for stocks, you can still see a clear auction taking place in the futures.  The reason for this the natural forces of a marketplace.  I strongly recommend anyone who speculates establish a firm grasp of auction theory before applying their own layers of technical analysis, risk management, statistical arbitrage, or any other strategy you prefer.

The opening swing is an important piece of the auction.  It sets the initial range which buyers and sellers can use as reference points for their buying or selling campaign.  I have a rule that says I cannot take any trades until at least one of the opening swing levels has been established.  It does not take long, but it gives you the first bit of fresh intraday data to measure your trade against.

Thursday morning we printed an opening swing inside of an opening swing from earlier in the week.  I saw this same occurrence last week here http://ibankcoin.com/raul3/files/2014/03/NQ_OS_03262014.jpg

I affectionately refer to this tight buildup of pressure as The Doppelgänger for reasons outside trading.  I was in literally the strangest meeting of my entire life when this all went down Thursday.  I returned to my desk and found my book tossed into a massive inferno.  But there was really no word more capable of describing the condition.  Therefore you may see me reference The Doppelgänger going forward.  And it will be interesting to see if it continues to play out because it represented a huge opportunity the two times we have seen it. Riding the trend that explodes away from it offered 3 trades with tons of meat.

Without further adieu, here are this week’s opening swings and my observations of the opportunities they create as well as the risks associated with said opportunities:

MONDAY:

NQ_OS_03312014

TUESDAY:

NQ_OS_04012014

WEDNESDAY:

NQ_OS_04022014

THURSDAY:

NQ_OS_04032014

FRIDAY:

NQ_OS_04042014


Comments »