The dang models been pegged bearish for like two months. I am not sure what the heck is going on. I may need to go in and update the thresholds. Nevertheless it is finally coming into a week neutral, and May is underway, and the weather is so fine, and long live the King, and we really like the early polls suggesting sleepy Jim will dominate the reelection cycle.
The axiom says to sell IN May, not like right when May starts. May is a month of hope, and flowers and babies and mammas and 36-hour-long disco raves.
And whilst many Americans are completely on edge, convinced they see massive tears in the fabric of society, some of us just want sunshine and sweet corn. And those folks, folks like your dear and humble pal Raul, well those folks are certain a strong season is upon us.
The charts lo0k good. Semiconductors are at a healthy range low with lots of room to gallop higher. Big tech put up some dang good numbers this quarter. Those Russian crusaders, those red bastards, they’re losing to The West. The West, a wonderful place where patriotism goes to die and we all sort of melt into this brackish blob of hedonists. Really wonderful.
Elon won folks. Those militant news fuckers could not cancel our dear leader, and He consistently wakes up every morning and guides us to a technocratic future where merit matters more than culture wars.
So pretty much as long as you only invest in big tech and Berkshire, it looks like clear skies from now on.
Go on, take some risk, live a little.
Okay for now.
Raul Santos, May 7th 2023
And now the 427th [Truncated] Strategy Session
Truncated Stocklabs Strategy Session: 05/08/23 – 05/12/23
I. Executive Summary
Raul’s bias score 3.03, neutral. Warren Buffet sets the tone early on this week. Expect Monday morning’s trading action to carry through to Wednesday. Then watch for third reaction to the CPI direction to dictate direction until about 2pm Wednesday when the Treasury releases a statement. Lots of Fed speak this week which may or may not induce some choppiness.
What is The Market Likely To Do from Here?
Bias Book:
Here are the bias trades and price levels for this week:

Here are last week’s bias trade results:

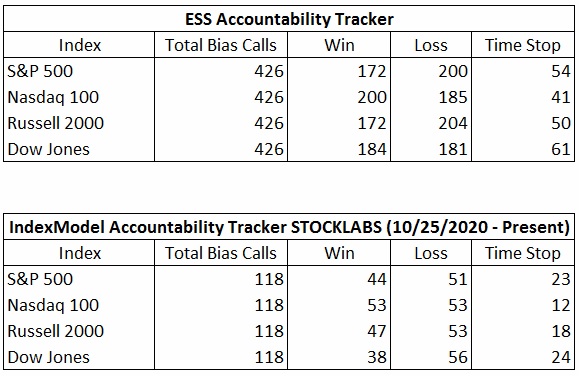
Bias Book Performance [11/17/2014-Present]:
INDEX MODEL
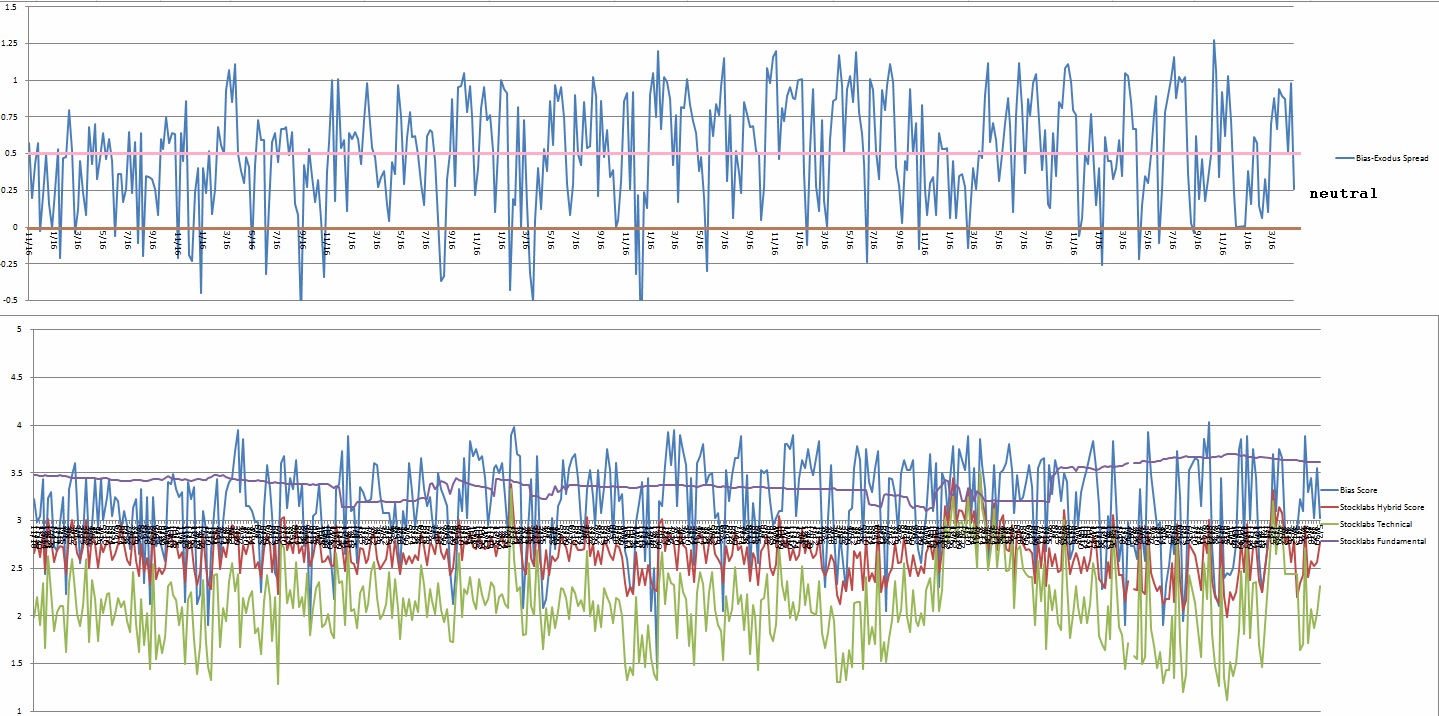
Bias model is signalling Rose Colored Sunglasses bearish.
Here is the current spread: