iBankCoin
Home / Futures (page 140)

Futures

Starting The Week in Balance

Nasdaq futures are down just a touch premarket on an orderly session of price balance with a slightly below normal amount of volume transacting during the session.  We are set to hear Consumer Credit at 3pm today but have an otherwise quiet economic docket for the week.  UK GPD comes out Tuesday morning, China CPI late Wednesday, a Monthly Budget Statement at 2pm Thursday, and Retail sales and U. of M. Confidence numbers on Friday.

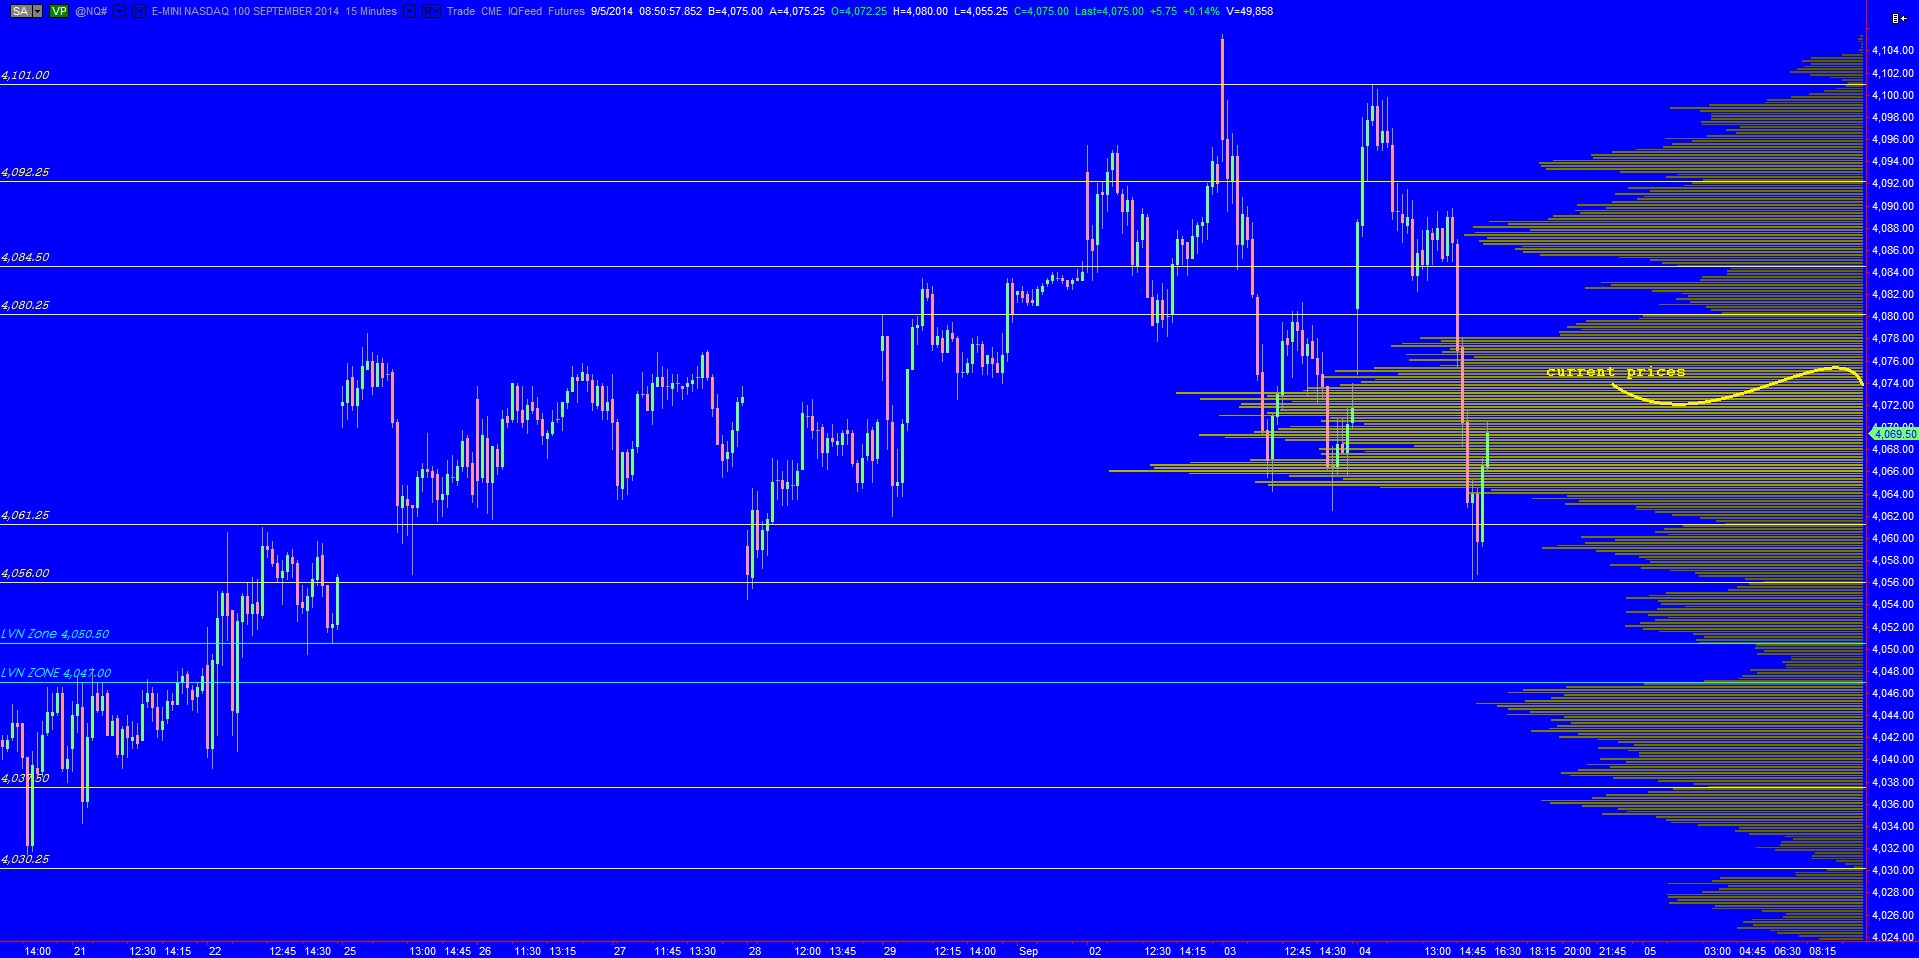
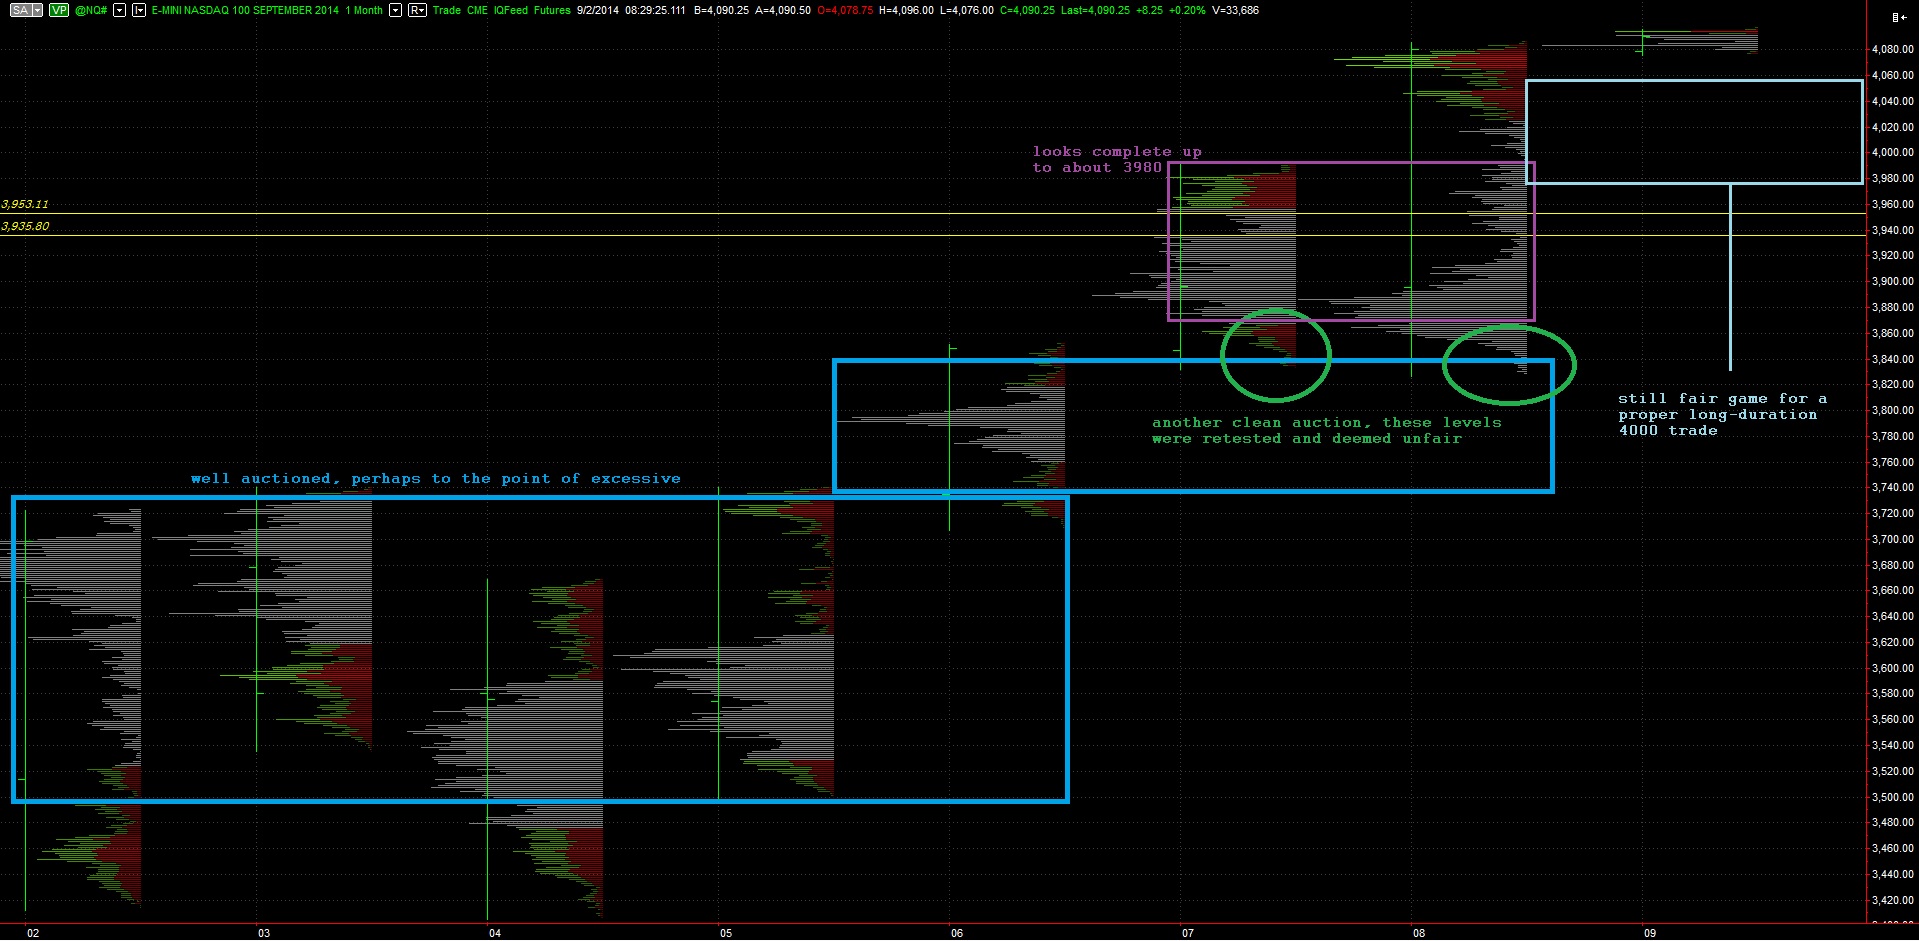
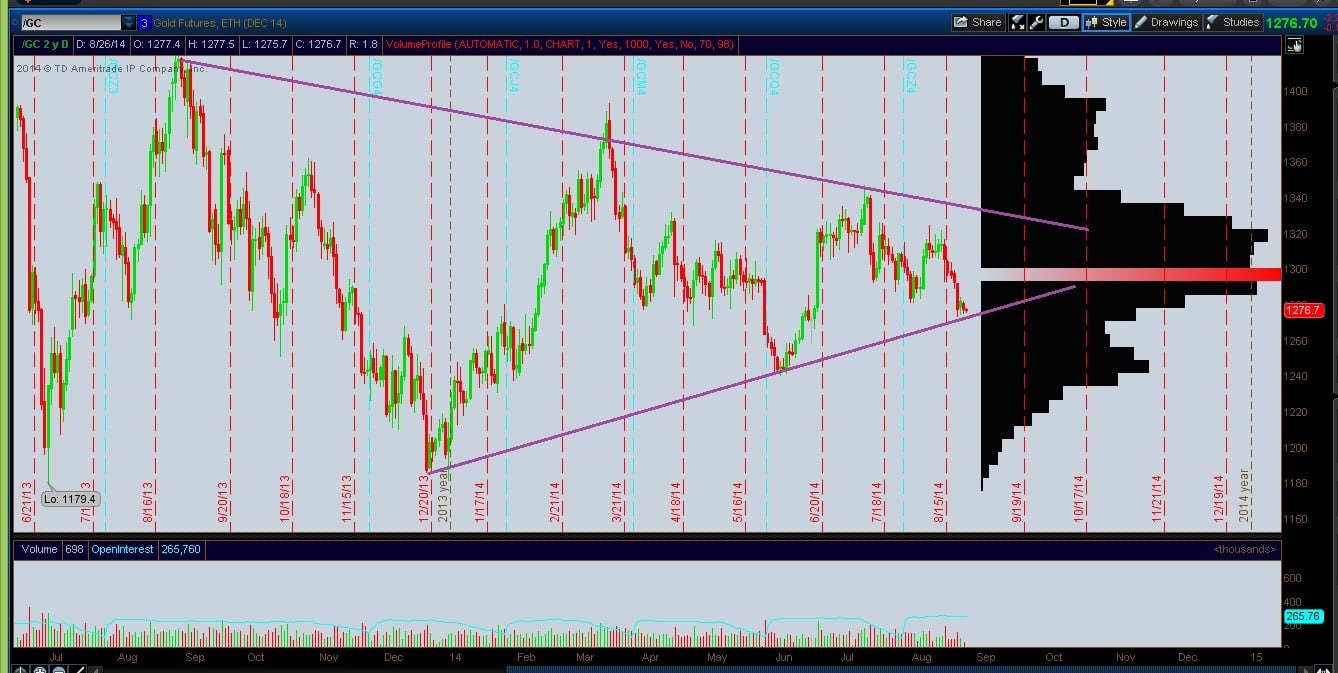
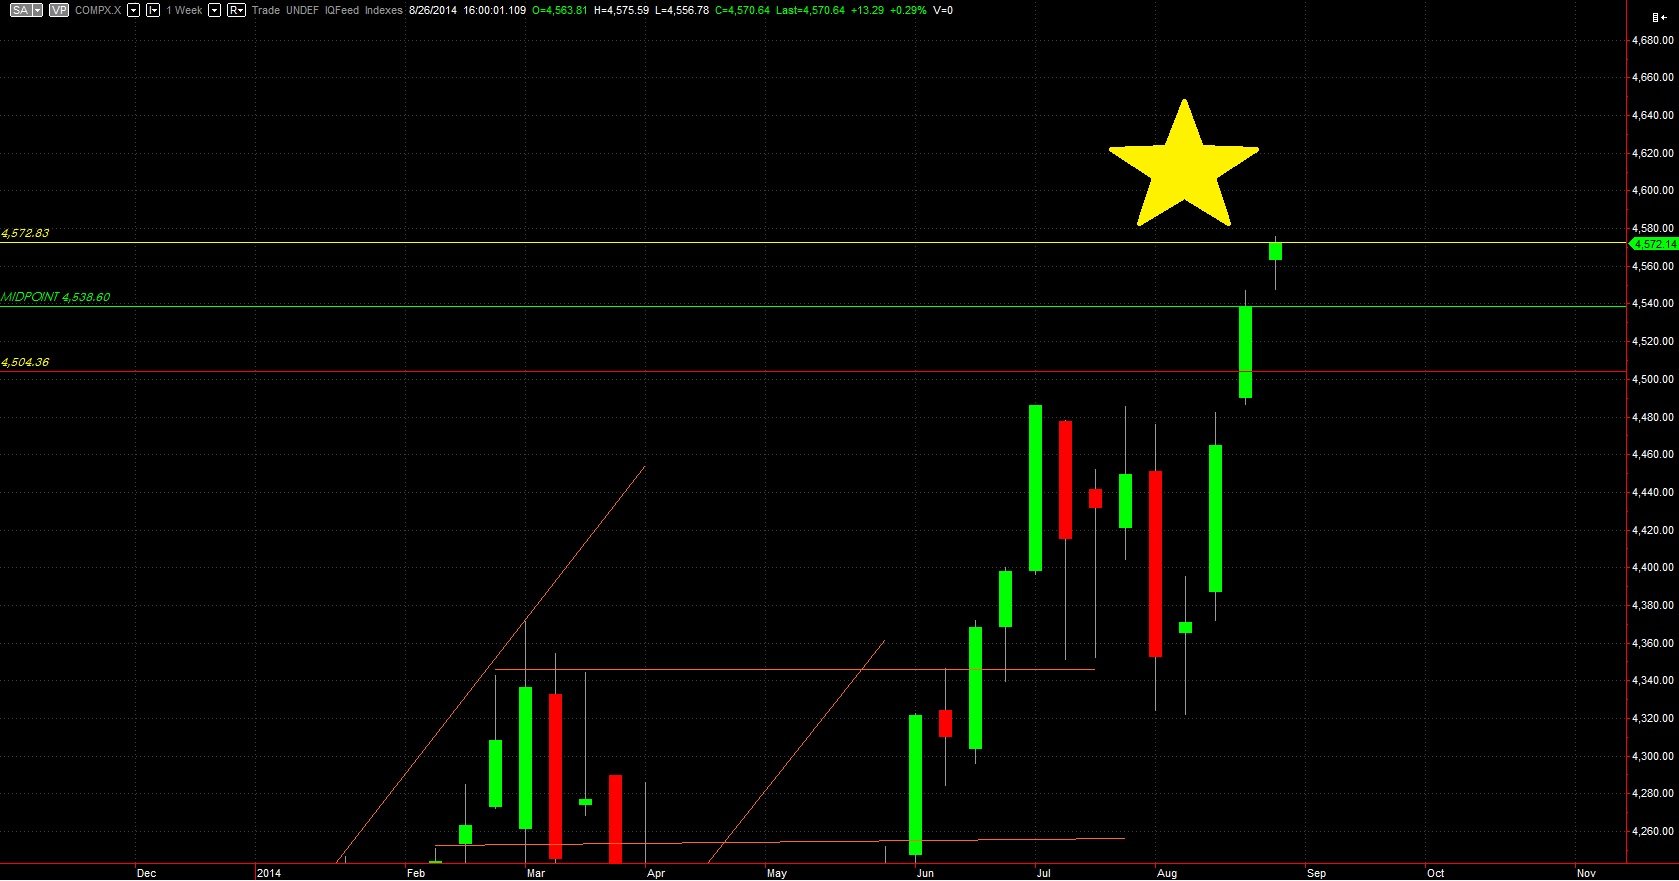
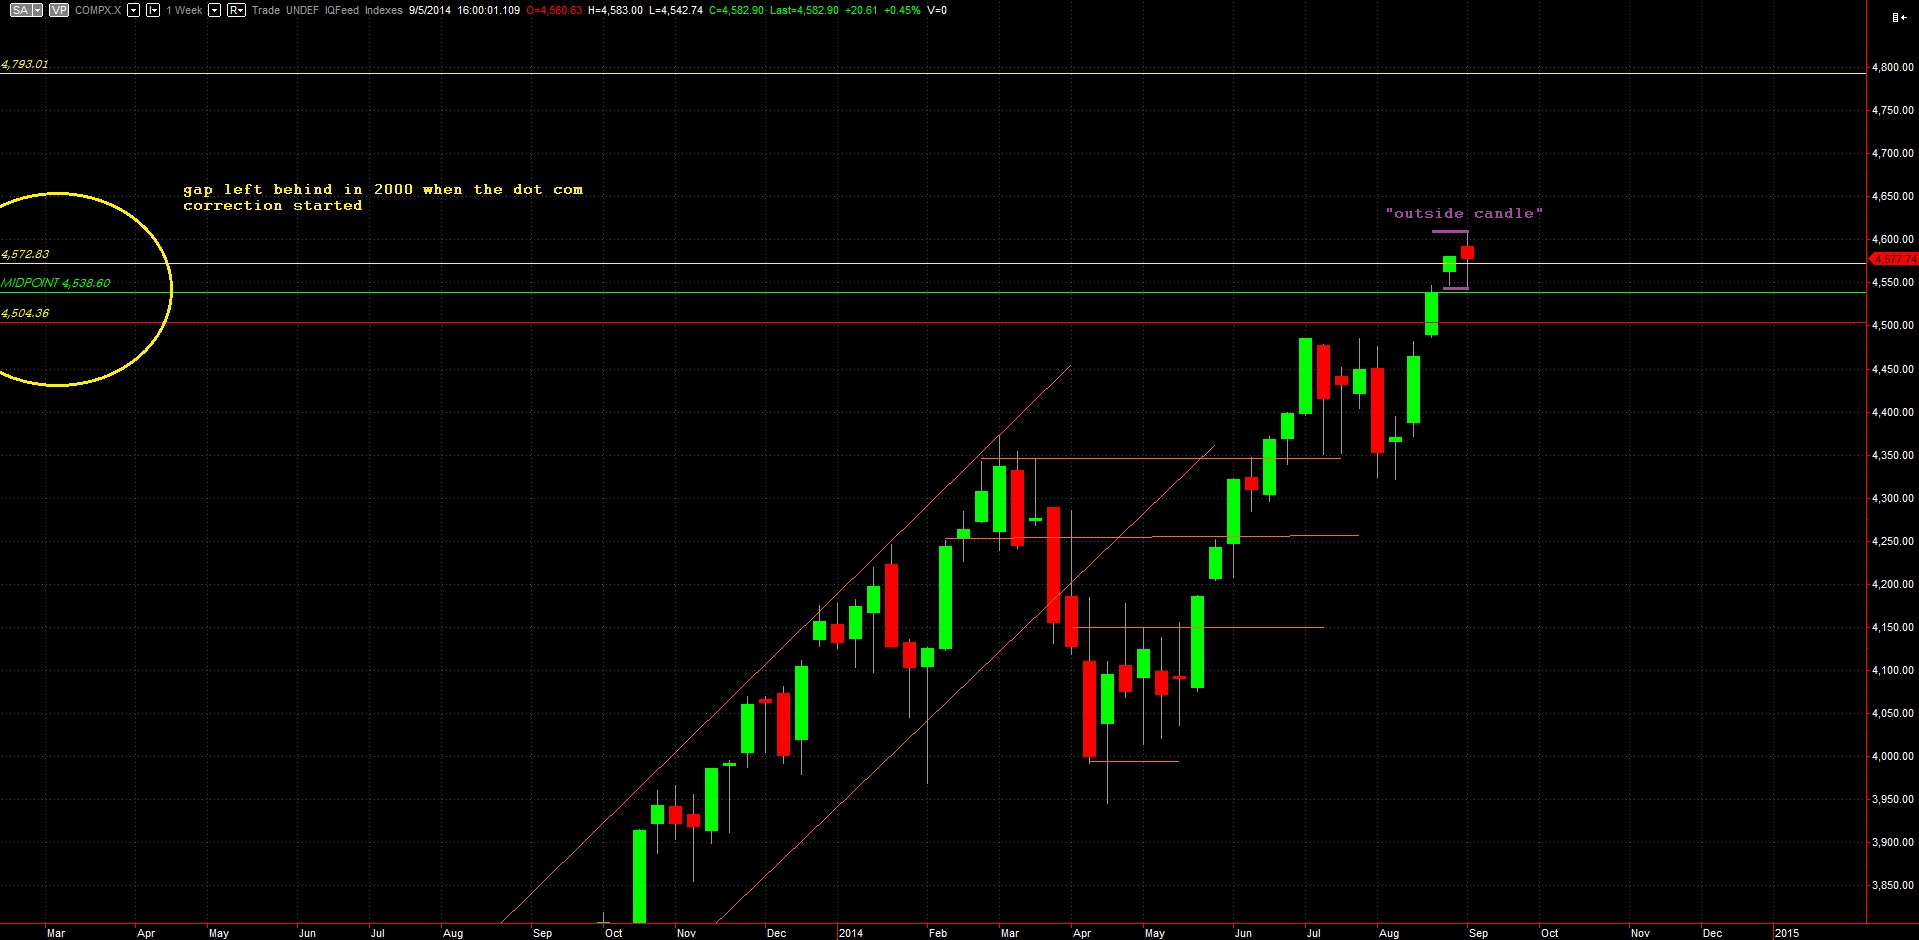
Long term, the Nasdaq continues to be bullish after printing an outside candle on the weekly chart.  The outside candle is often referred to as an “outside reversal” and in this case a “bearish engulfing” pattern.  The quirk to last week’s candle is the long wicks on both sides, especially the bottom.  This suggests a strong response to lower prices was able to press us well off the weekly lows.  The gap zone left behind 14 years ago is living up to the expectations of gap zones by providing fast trading action.  Overall, the market continues to sustain trade above the gap and we have to bear in mind how much energy was expended by the dip buyers and whether we see buyers initiating more risk this week:

09082014_Weekly_NQ

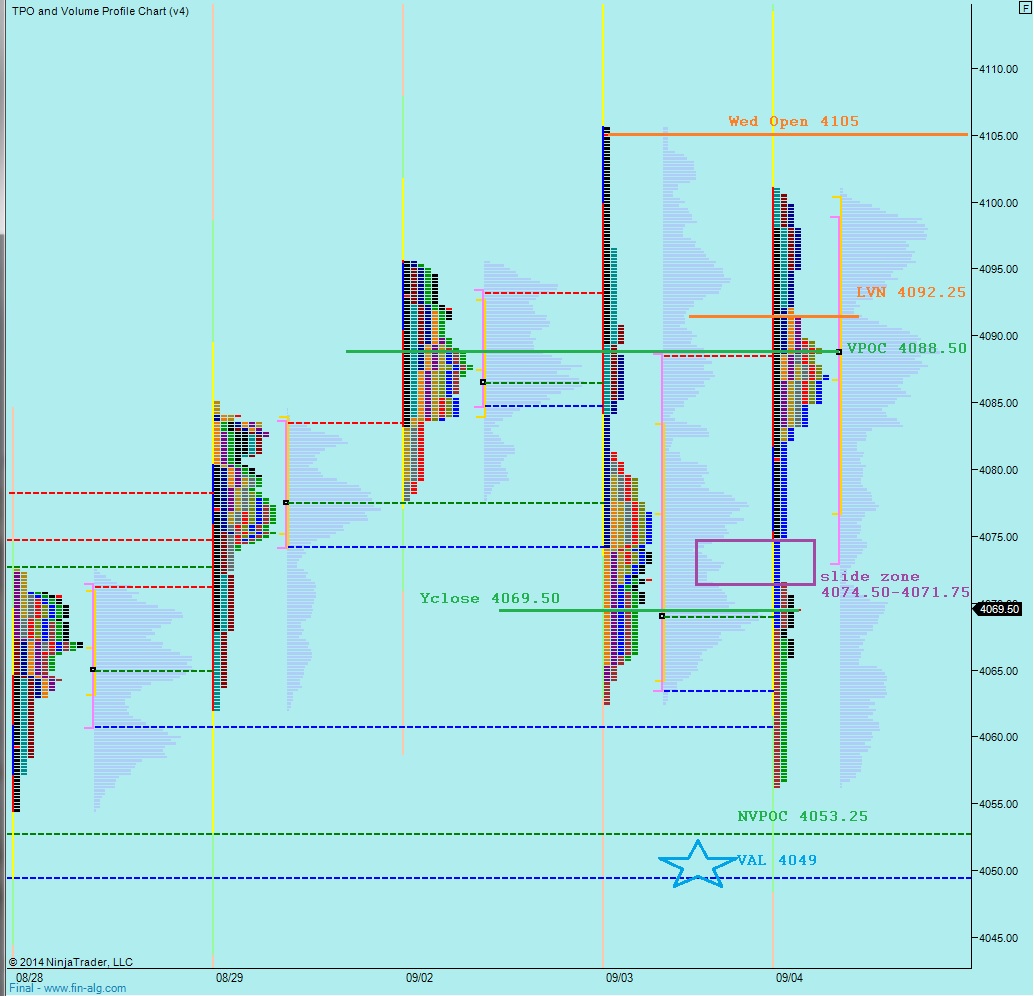
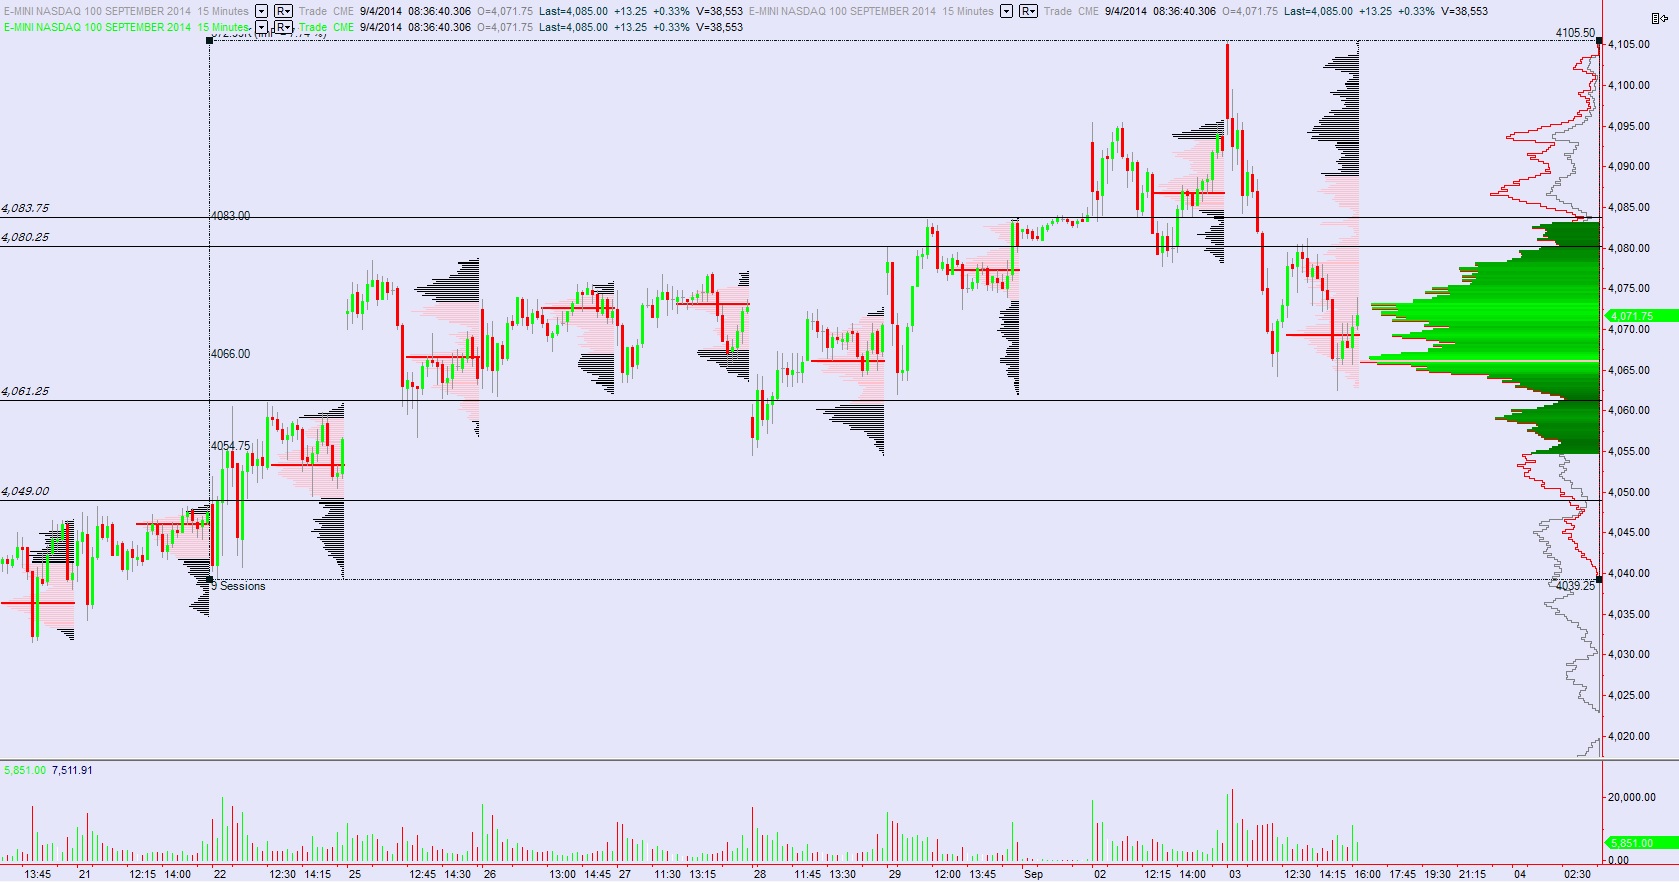
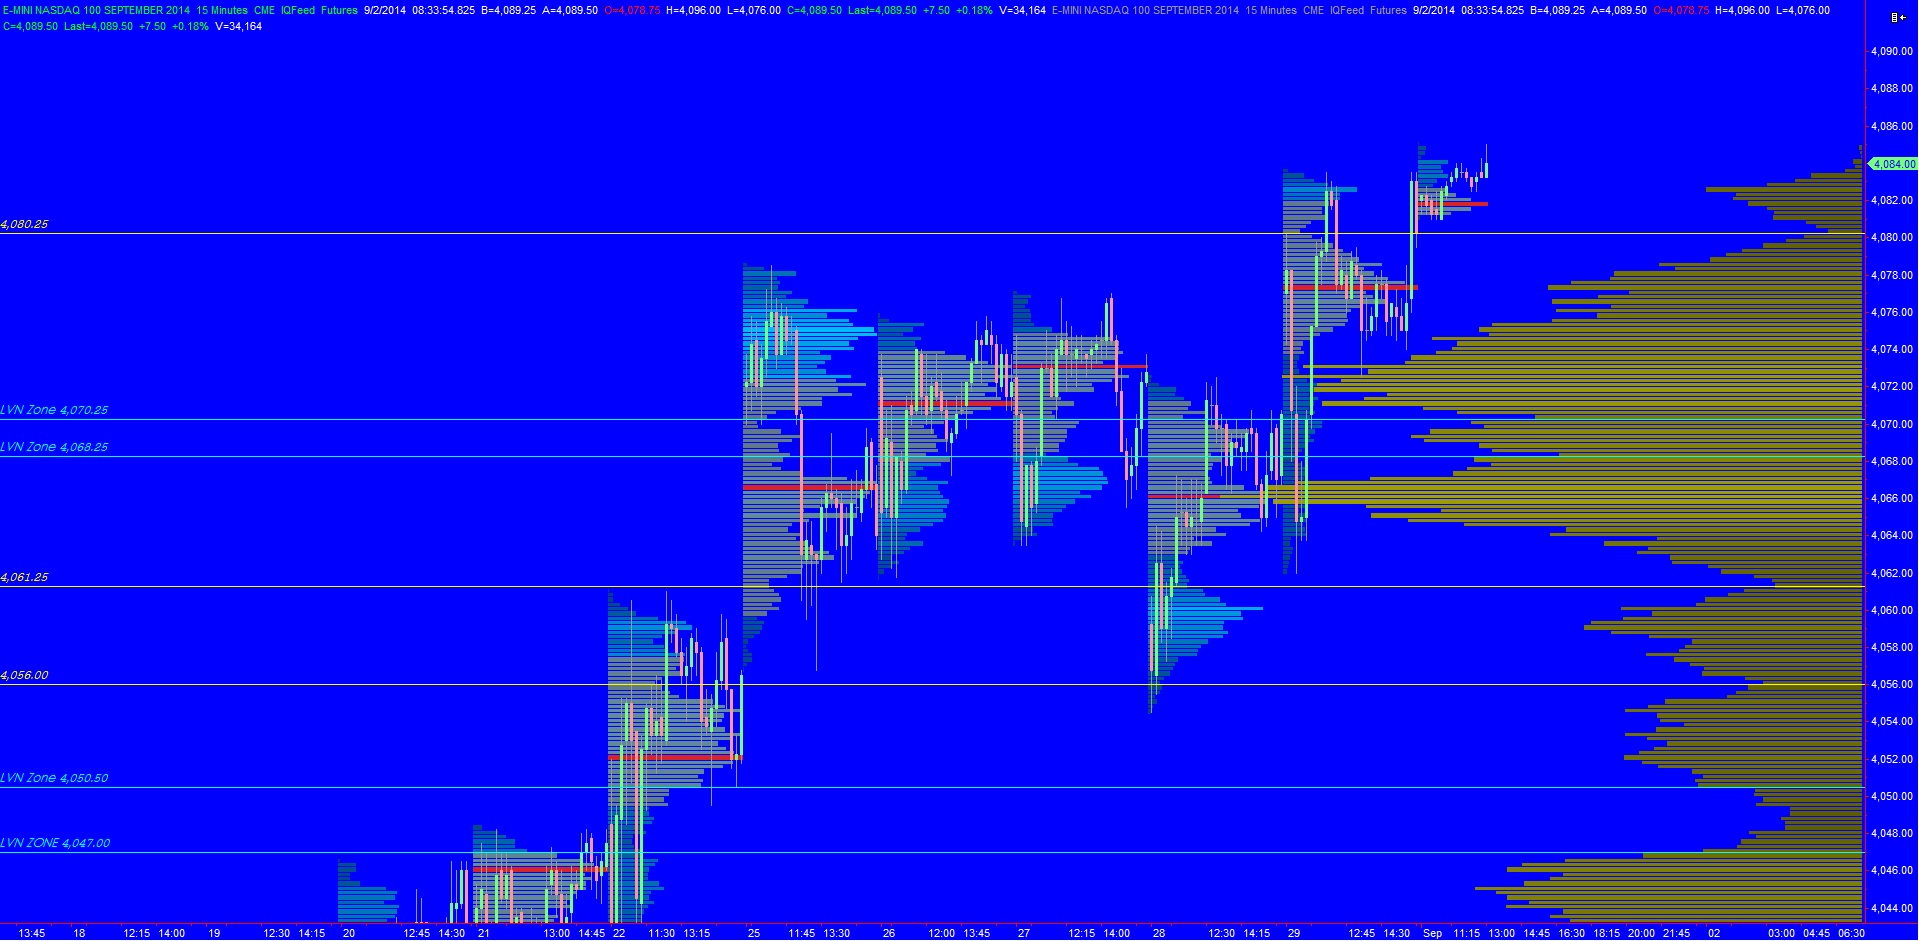
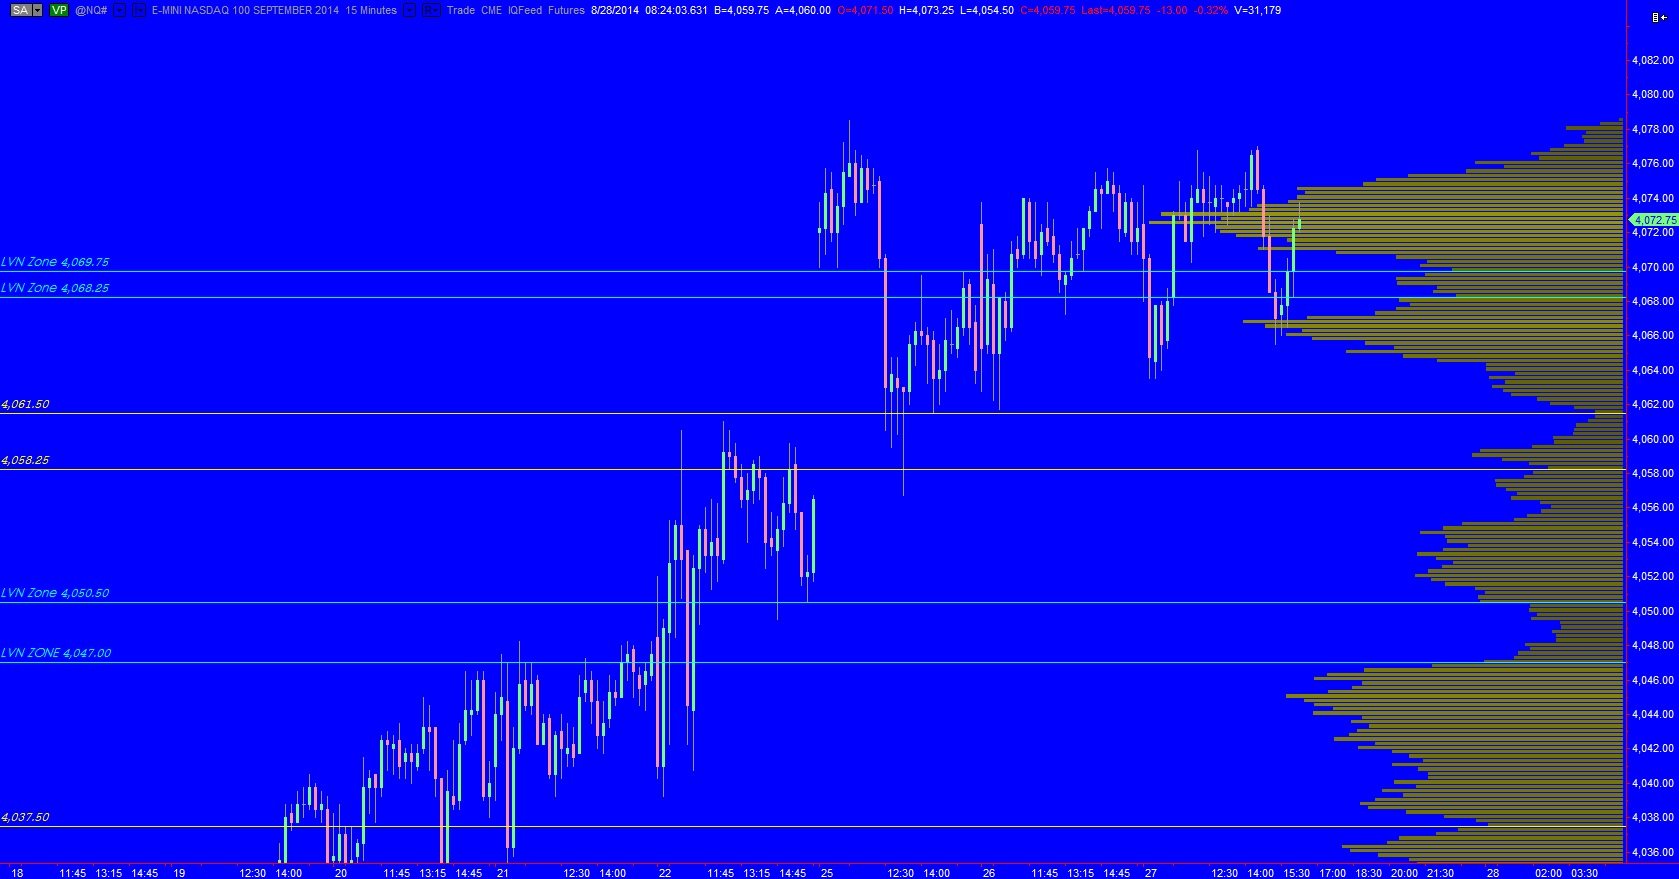
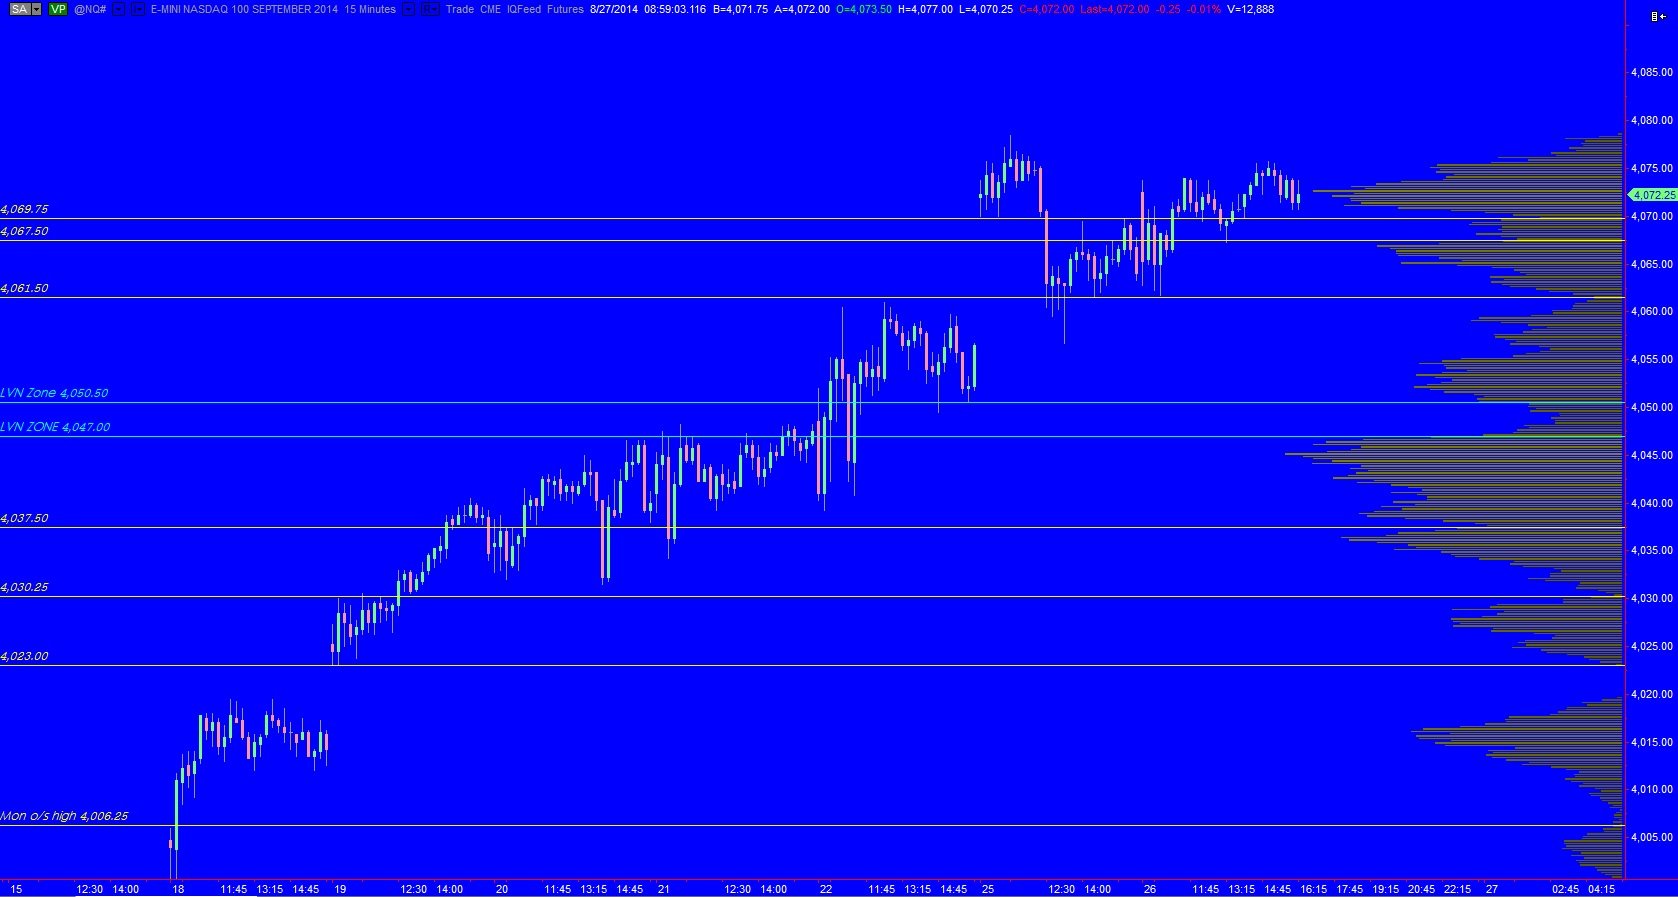
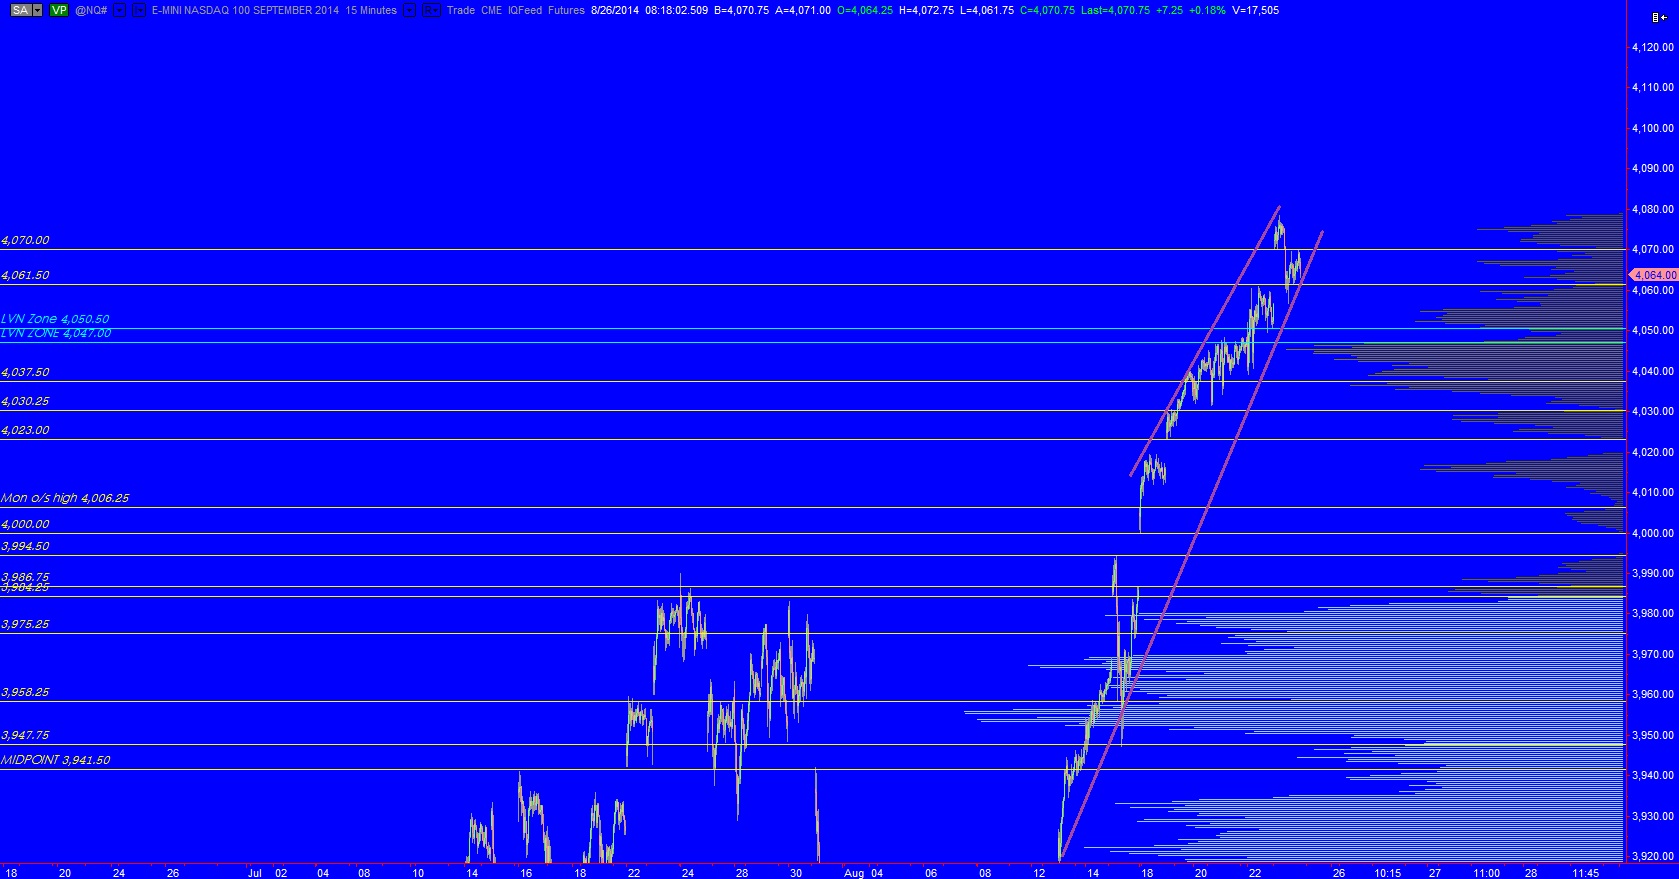
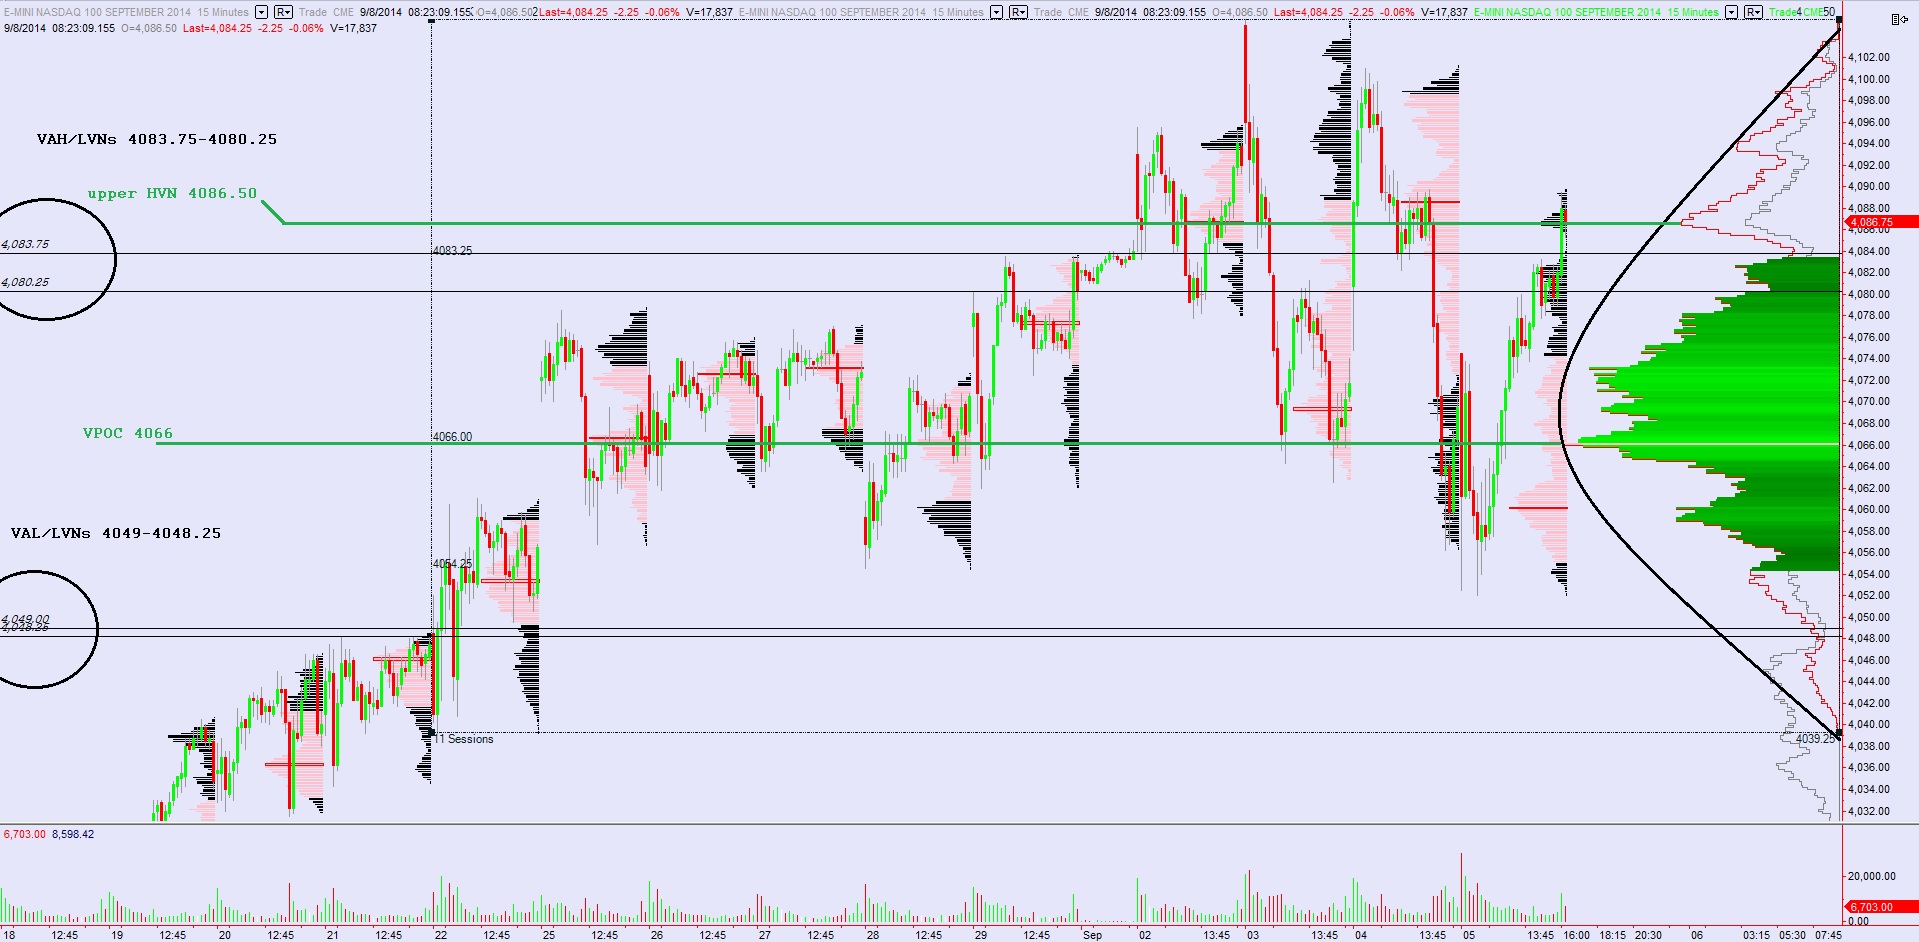
Intermediate term we are fairly neutral at the moment.  This can be seen best on the following volume profile which encompasses eleven session of trade:

09082014_intterm_NQ

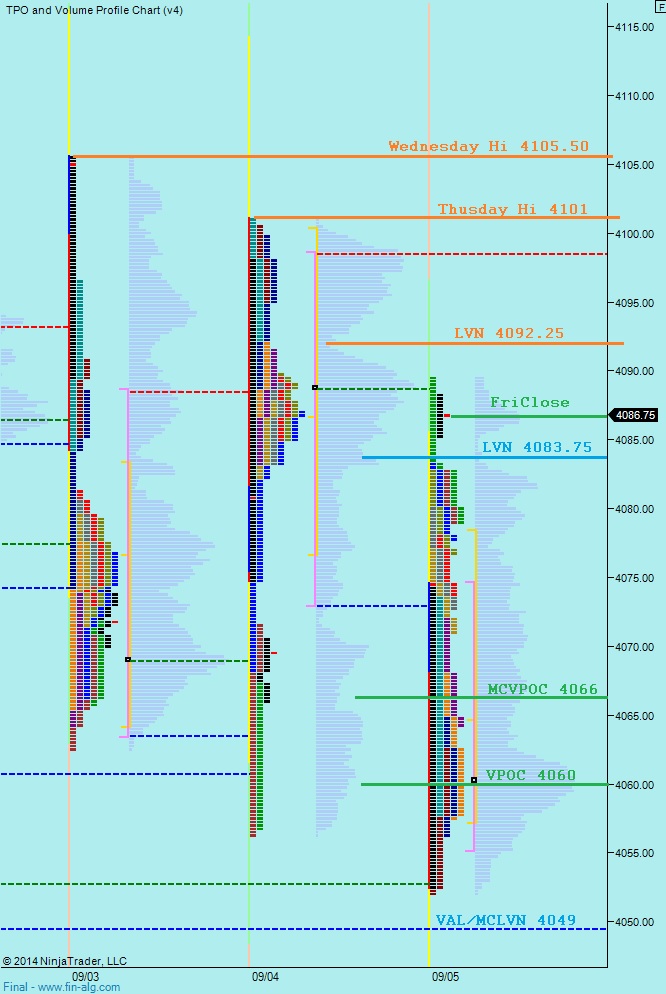
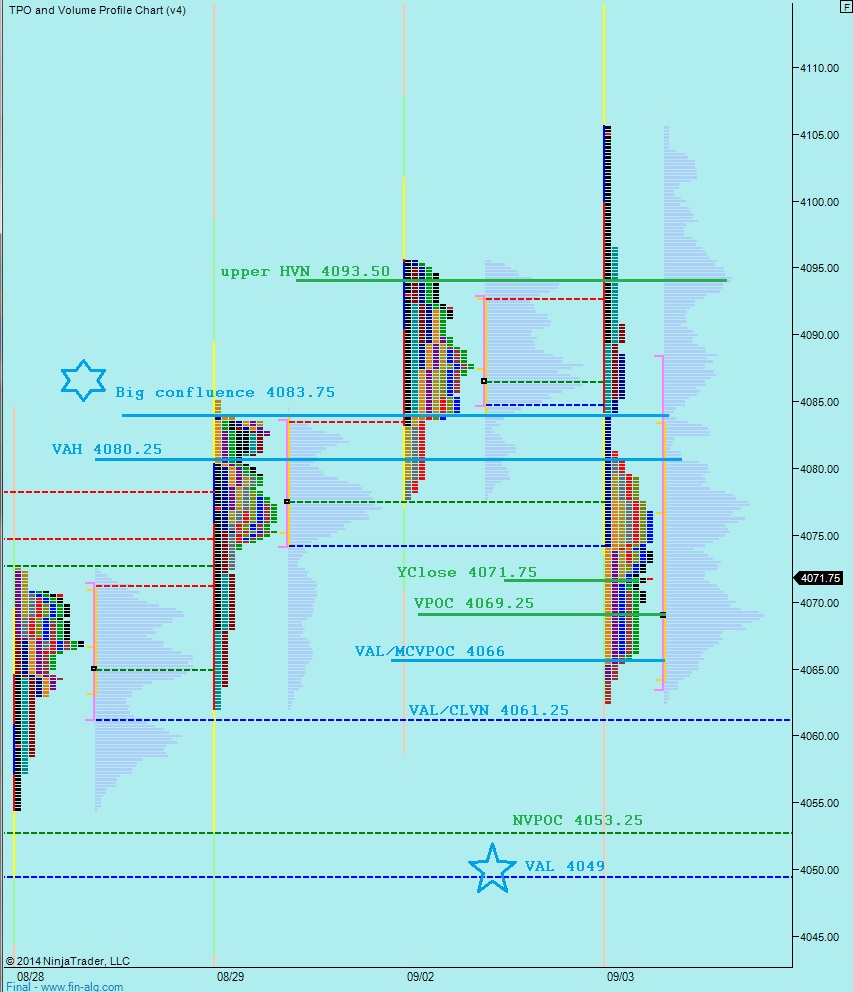
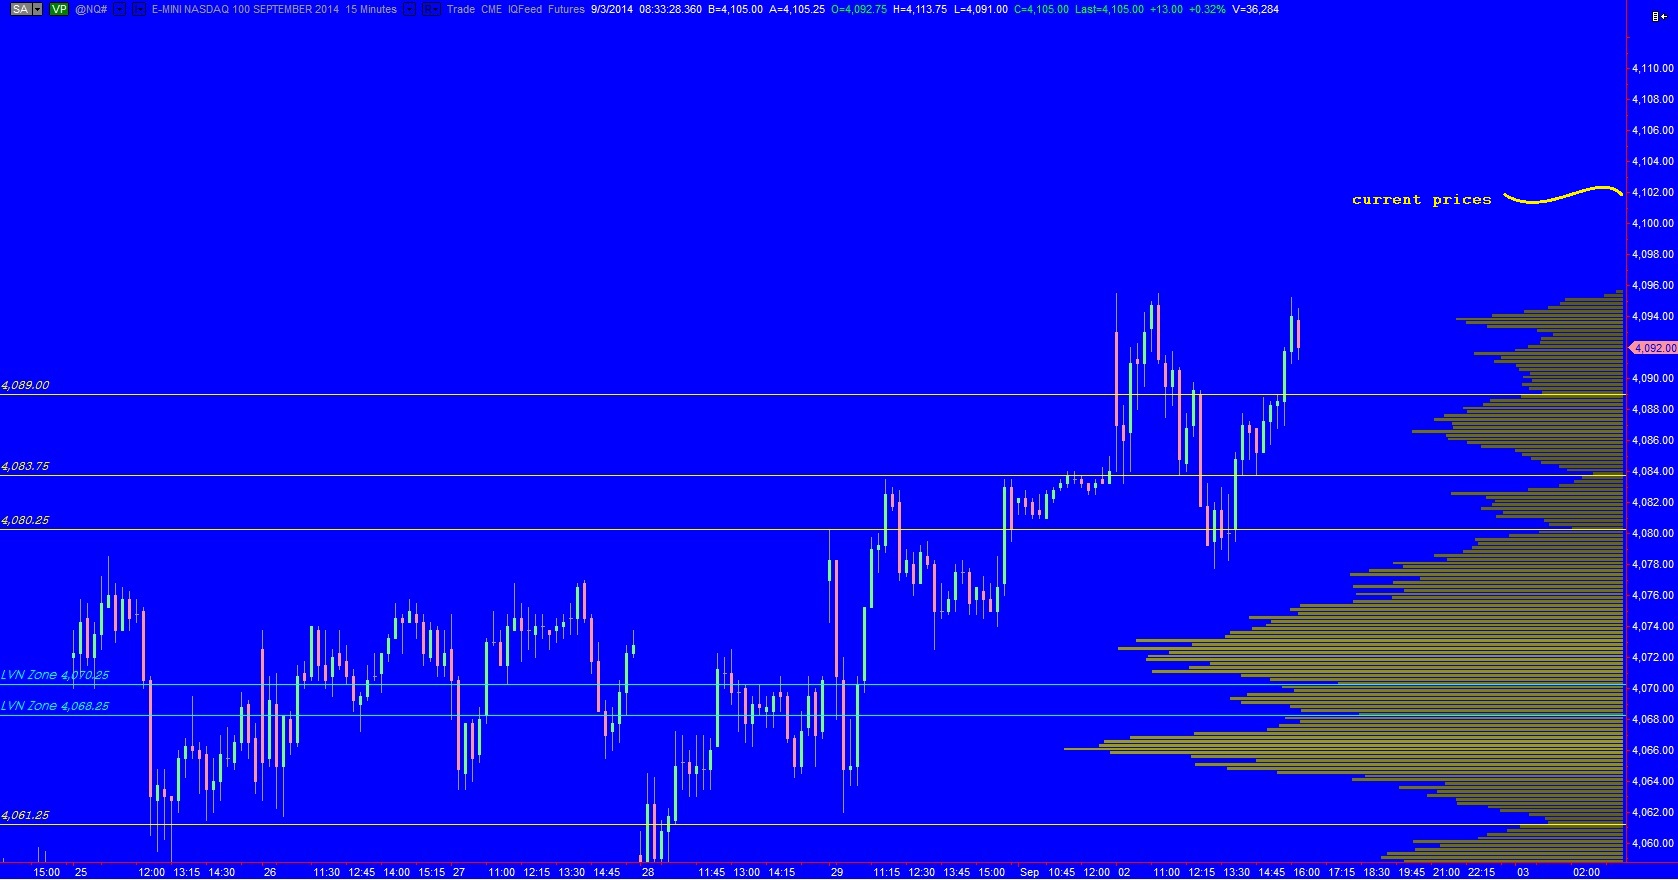
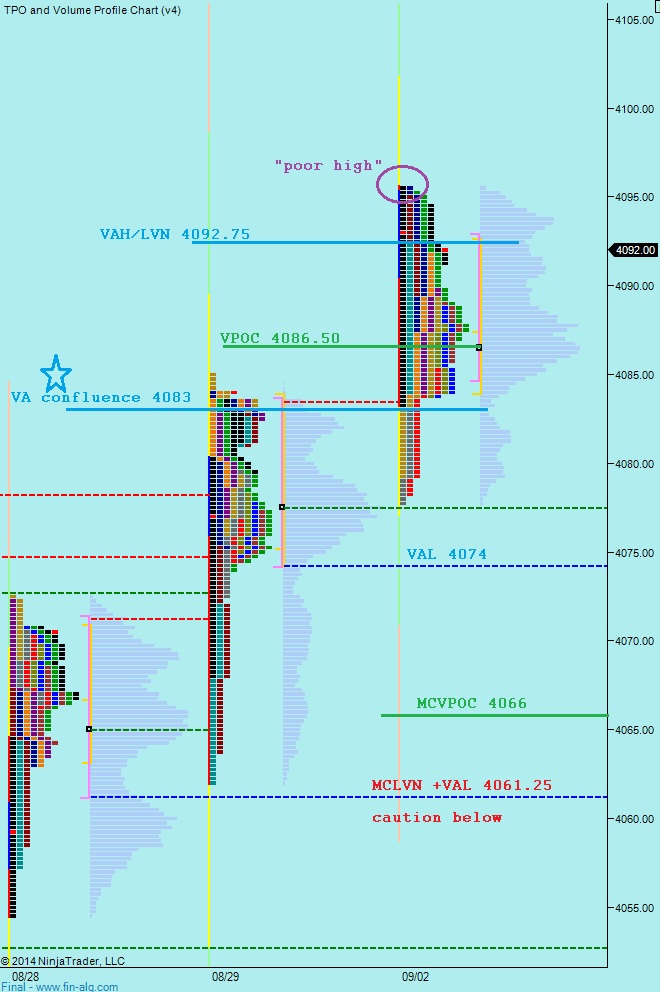
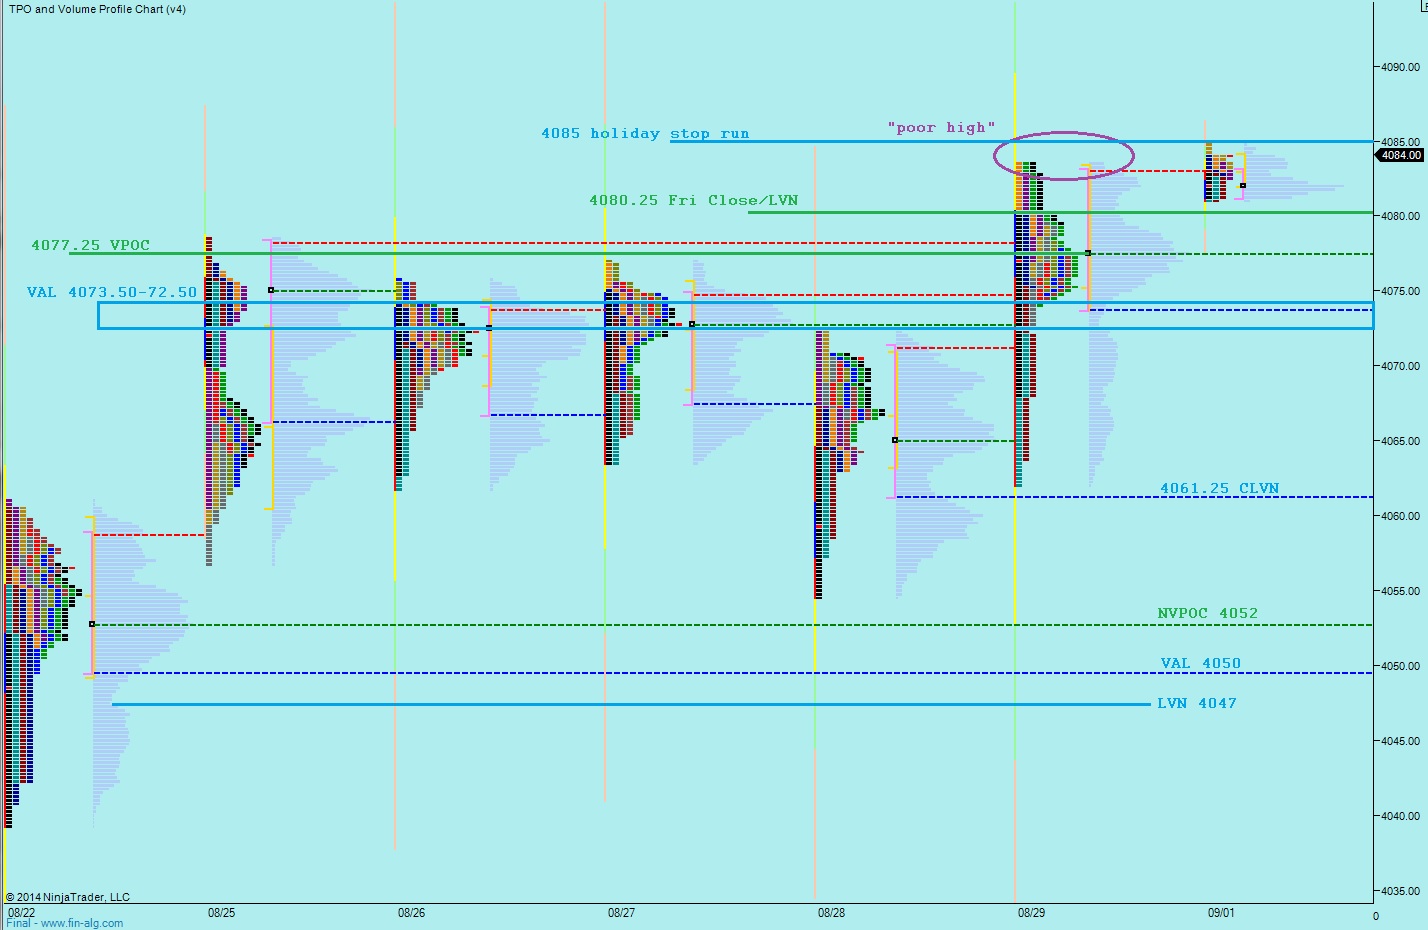
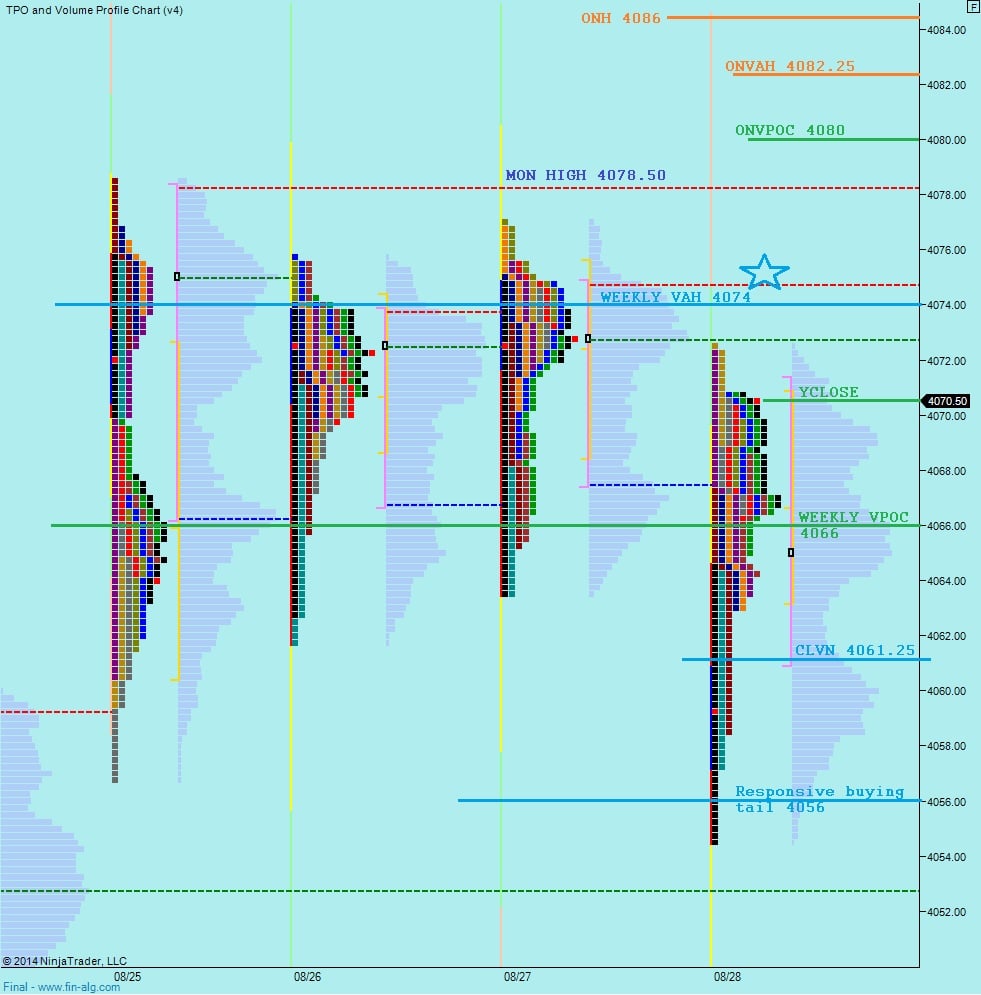
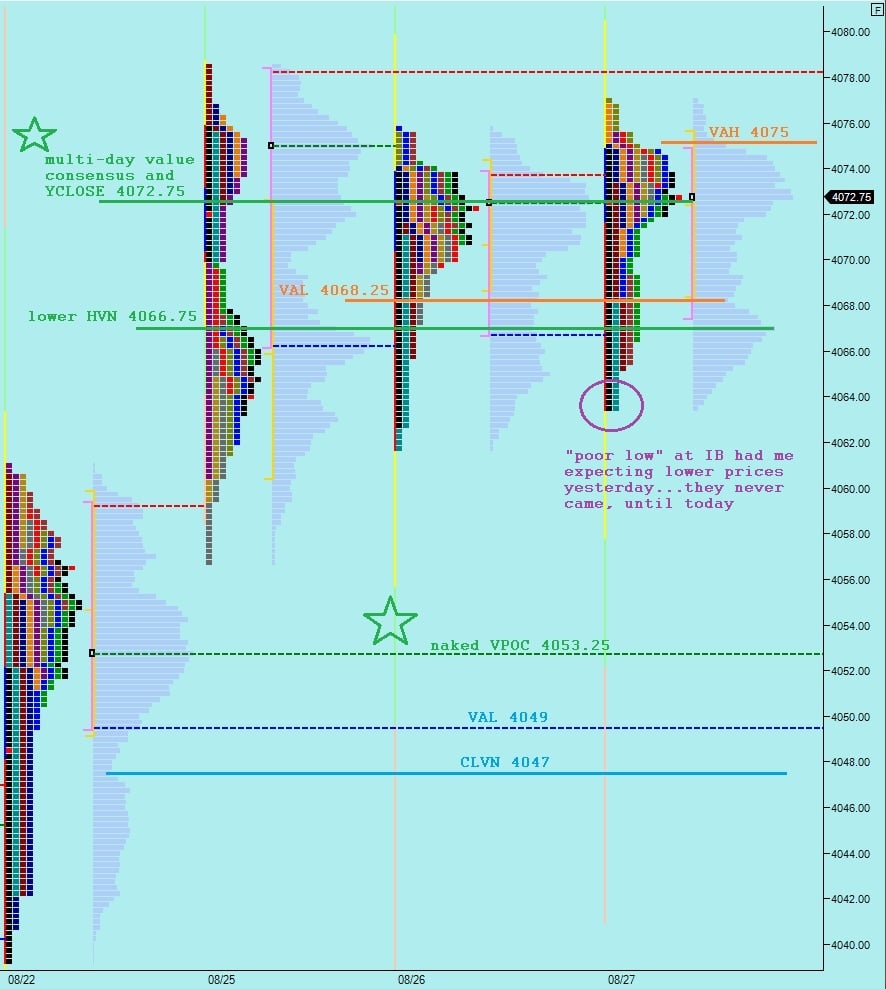
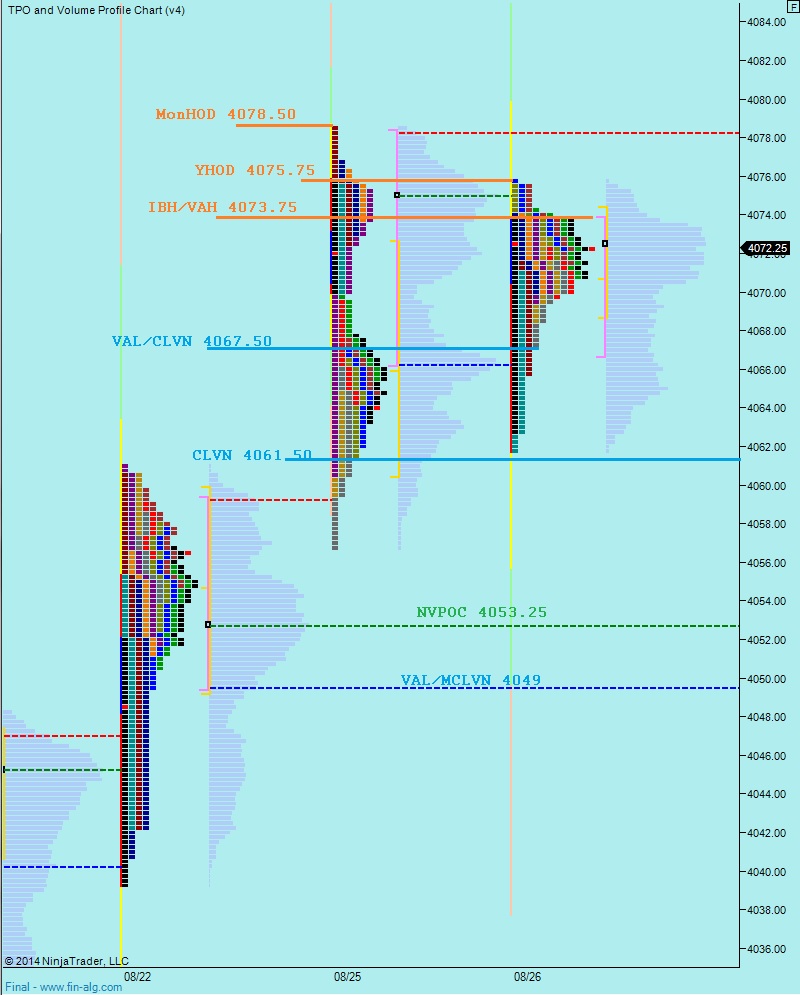
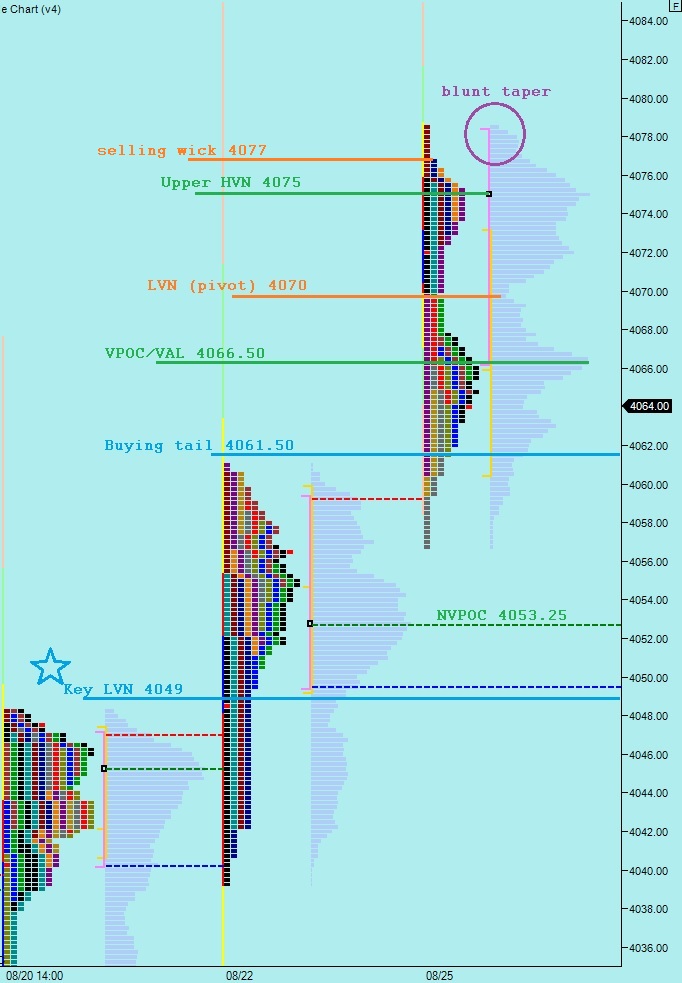
I have noted the short term price levels I will be observing using the market profile chart below:

09082014_marketprofile_NQ

Comments »

Balance Can Be Bumpy

Nasdsaq futures are up in initial response to a weaker-than-expected NFP data point this morning.  The news sent the dollar lower, treasuries higher, and equity prices to their high of the overnight session.  As we approach cash trade, there are also unconfirmed reports of a ceasefire protocol in The Ukraine.  The initial reaction to any sort of economic figure or news event is often difficult to glean insight into the auction.  You are usually better able to observe the reaction to the initial reaction.  Developing…

The intermediate term is balanced after trending higher for much of August.  Balance can be challenging to trade.  The risk you face is chasing longs up into the upper boundary, stopping out in the lower boundary, then going short into the lower boundary, only to again stop out somewhere near the mid.  Or you can stick with one side, wait for resolution, then adjust accordingly.  I have marked up key intermediate term prices on the following composite chart:

09052014_intterm_NQ

You can see how the pace of trade accelerated during the last two sessions relative to the tight, small profiles to the left of them.  The environment is improving for trading the Nasdaq futures.  I have noted the short term levels I will be observing on the following market profile chart:

09052014_marketprofile_NQ


Comments »

Index Futures Up on Euro Zone Surprise

draghi2Nasdaq futures are up on overnight after starting out rather weak when trade initially opened in Europe.  Traders’ attentions were focused on the Euro Zone this morning, where we were set to hear from both the Bank of England and the European Central Bank (ECB).  The UK left their rates at historic lows and will remain steady with their asset purchase targets.  The surprise came from the ECB who dropped their bank rate 10 basis points to 0.05% as well as decreased their deposit facility rate to -0.20%.  The news sent the Euro dollar falling, the US dollar rising, and US equity indexes higher.  We also saw initial jobless claims at 8:30am which was a bit higher than expectations.

Thus far, the net result was about a 25 point range on normal volume in the Nasdaq globex session.

At 10am we have ISM Non-Manufacturing composite which is listed as a high-impact event.  Energy traders will have a whole slew of oil and gasoline data to digest at 11am, and there are some Fed speakers after the market close (no Yellen).

The intermediate term has come into balance.  The balance spans 9 sessions and can be seen on the following chart.  Below this balance the volume composite is very sparse, and prices below about 4050 are susceptible to fast moves.  However, above here, we are likely to see the balancing process age a bit.  See below:

09042014_intterm_NQ

I have noted the short term levels I will be observing on the following market profile chart:

09042014_marketprofile_NQ


Comments »

Bend The Rules

The Nasdaq futures are up overnight after printing a normal range on slightly above average but normal nonetheless volume.  The premarket economic calendar is empty but at 10am we have US Factory Orders and the Bank of Canada rate decision.  Later in the afternoon, at 2pm, The Fed Beige Book will come out.  After hours tonight the Bank of Japan is set to release their monetary policy statement and early tomorrow morning there are several central banking activities to keep in mind from both The Bank of England and the ECB.

We discuss day-types often and their implications.  Although yesterday was a normal variation with range extension lower, a day which normally would suggest seller control on the session, you have to be aware that none of these market profile terms are concrete.  They are simply ideas for us to assess the auction and who is participating and who might be in control and how good of a job they are doing.

Yesterday we nearly printed a neutral extreme to the upside.  The afternoon rally was well timed and buyers were able to sustain their push into the bell.  Their force was not overwhelming enough to press through the high, but the high on the session was of poor quality—another feather in the bull cap.  Conversely, the taper on the low of the session was clean, the rotations lower were smooth pushes lower as well, nearly perfectly compliant with a wave 3,4,5,a,b,c type reversal.  It was fairly clear by the end of lunch that the market had done a good job finding a buyer and the auction could start anew.

This is all hindsight.  What the market has done.  What else has it done?  On a larger timeframe we pressed higher through most of August, based out to end the month, and made a fresh thrust higher to start the month.  The beginning of the month has slightly bullish skew for equities, therefore the real intermediate term assessment takes place after 3-4 sessions.  For now, I have noted the key composite levels below:

09032014_intterm_NQ

The market appears to be keen on trying higher.  Over the last week volume has been stronger on green candles.  As far as price history goes, the Nasdaq composite overshot the 14 year gap from 2000 and is now in a bit of a fast zone from back in the dot com mania.  The market appears to be trying to find a seller up here by exploring higher.

Finally, I will be using the following market profile levels to aid my hypothesis process in determining what the market is likely to do from here:

09032014_marketprofile_NQ

Comments »

A Fresh Month’s Context Read

Nasdaq futures turned in a relatively normal session overnight after drifting higher a bit during the shortened Labor Day session.  As we approach cash trade in the US the Nasdaq futures are trading up about 7 points.

The only major economic release for today is slated for 10am when ISM Manufacturing and Construction Spending data are released.  Looking out on the week, we have Factory orders and The Fed Beige Book during tomorrow’s regular session.  Thursday we have an ECB rate decision before market open with a Draghi presser and US Jobless Claims.  Thursday we also have ISM Non-Manufacturing composite.  And finally Friday before market open we have Non-Farm Payrolls and Unemployment stats premarket, arguably the only economic data point worth observing aside from The Fed.

On a long timeframe, looking at the monthly volume profile prints, we can see how much progress was made during August.  Much of the thin profile makes sense if you consider how well the prices we auctioned back in July.  However some prices received very little consideration and might welcome a retest at some point in the month.  See below:

09022014_monthlyVP_NQ

Looking at the intermediate term, we can see the market beginning to come into balance although buyers still control this timeframe.  The value migration higher began to slow last week.  Overall the structure just below current prices is well-auctioned and likely to provide support in the short term.  If we push down through it however, it would then be considered an overhang of supply.  I have noted the key intermediate price levels below:

09022014_intterm_NQ

Finally, I have marked up the market profile with short term levels I will be observing today.  One piece of context which gave me confidence to press long through the weekend was the high on Friday.  This was a prime example of a poor high, one vulnerable to be taken out.  I will likely merge the small Monday auction into Friday’s profile, but kept them separate for us to observe the poor high:

09022014_marketprofile_NQ

Comments »

Up Gap To Wrap The Week Up

Nasdaq futures pushed higher overnight and achieved a news swing high in the globex hours.  The thrust occurred right around 3:30am and does not align with any economic release, thus it is the result of either a news development or simply more buyers than sellers.  As we approach US cash open, prices are off the highs of the session.

Personal Consumption statistics came out at 8:30am in line with forecasts which initially has brought little activity into the market where we are holding onto the overnight gains.  We have Chicago Purchasing Manager at 9:45am and U of Michigan Confidence numbers at 9:55am.

Yesterday’s auction was effective and methodical.  You will often see the Nasdaq futures operating in this manner.  It will go about the day resolving unsettled items one after another.  The gap higher on Monday did not quite resolve on Monday when prices stopped a tick above the full gap fill.  Yesterday we filled the gap before finding a responsive buyer who returned us back into the upper balance formed this week.  They closed the weekly gap, then they closed the range gap between Wed/Thurs, then they targeted a full overnight gap fill, stopping just one tick shy of this achievement.  It was a very methodical process.

I have highlighted the key LVNs as well as a measured move target which is a point shy of where we printed our overnight high:

08292014_IntTerm_NQ

I have also noted the short term levels I will be observing on the following market profile:

marketprofile_08292014

Comments »

Back in The Thick of The Auction

There is only so much analysis one can do when the price of an instrument is climbing to fresh highs.  Mostly I rely on measured move targets to the upside and highlighting support levels.  This is important, but I much prefer the confines of territory we have already auctioned.

I have these expectations sometimes, based upon analysis, where I expect something like lower prices.  Yesterday I was expecting some follow through on the morning weakness in the Nasdaq.  The challenge with expectations, especially those built upon market profile logic, is the timing.  The old axiom says the market can stay irrational longer than you can stay solvent.  The duration of “longer than you can stay solvent” is drastically shortened when you add a big leverage element to your trading.

GPD numbers came in better than expected and jobless claims worse than expected.  The initial reaction to this cocktail of economic numbers is buying across the equity index complex.  Overall however, it appears we will be gapping lower on the open, an event we have not seen in the Nasdaq since 08/12.

I have highlighted the key composite price levels on the following chart.  I will be watching how we behave at these low volume nodes for clues about the ledge of overhead supply and looking for signs of dip buyers creating demand below:

08282014_IntTerm_NQ

I have noted the short term price levels I will be keying off of on the following market profile chart:

marketprofile_08282014

Comments »

Gap Fill Complete

If you have been following along, then you have been aware of this big picture technical piece dating back to the year 2000.  “The 14 year gap” has been a feature of the premarket analysis since it came into range.  I am both satisfied and a bit sentimental that the gap has been filled and is now gone.  See below:

08272014_Weekly_NQ

Such is life and markets, change is inevitable and we must now be aware that the resistance free environment is complete.  How we handle this gap range will still be of interest going forward—whether buyers can sustain trade above the midpoint, whether we use the strong thrust to overshoot, or whether sellers reject us back below.  The simple trade was to press longs through the gap which saw little if any media coverage.  Simple, but not easy.

Nasdaq futures are down just a bit overnight and we have no major economic data out for the week.  There are Gasoline and Crude Oil numbers coming out at 10:30am to be aware of and also 2Q GDP tomorrow before market open.

Intermediate term continues to demonstrate buyer control and I have updated the LVNs to observe below:

08272014_IntTerm_NQ

Short term, taking our eyes inside the daily bars and observing the market profile, we can see value overlapping the prior day.  This is an early indication that prices are coming into balance.  The key question in whether we are pausing or if the market is done finding sellers.  Monday was a neutral day and yesterday we traded inside the range and value tightened.  This compression may preclude a swing high, however I will be observing the following levels and withholding any judgment until more information is made available:

marketprofile_08272014

Comments »

Neutral Footprint

Nasdaq futures are up a touch premarket in a quiet session of trade.  Durable Goods fell off a bit according to this morning’s release where numbers came in a bit softer than expected.  The initial reaction is a bit of sell flow.  We have consumer confidence information coming out shortly after the open at 10:00am.

After gapping higher to start the week, we printed a tight open auction, explored higher out of the tight initial balance and then went neutral on the session.  Price stopped just one tick shy of a full gap fill before turning higher and rejecting out of Friday’s range.  The afternoon snap back was not strong enough to press prices back to the VPOC in the upper distribution.  Instead we saw a VPOC shift lower to end the session.

Taking a zoomed out look at the intermediate term time frame we can see just how ruthless the upside progress has been.  Prices have been gapping and legging higher since taking out prior swing highs.  The resulting volume composite resembles a series of peaks and valleys as the market explores higher to discover a fair value.  I have noted the key low volume nodes on the following chart as well:

08262014_IntTerm_NQ

I have noted the key price levels I will be observing in this morning’s trade below:
marketprofile_08262014

Comments »

Gold Per The Futures

A request has been made to assess the conditions of a certain metal, gold.  The following analysis is of gold and is conducted using the December 2014 Gold futures contract which trades on the COMEX.  I am using the complete trade data, not the regular trading hours, because this instrument tends to make moves outside of regular market hours.

Long term prices are bearish to neutral.  Prices took a sharp move lower starting mid 2012 and accelerating during 2013.  Since then prices have been basing.

Intermediate term is neutral.  After an excess low printed in July of 2013 we began the process of balancing.  The balance is best seen on the following volume profile which dates back to about June 2013.  We can see buyers and sellers reaching a consensus of value on the intermediate term, and we are currently trading near the lower end of where one might expect to see buying:

GC INT TERM

My current bias score is just a shade over neutral but not quite medium bull.  The volume is coming in a bit heavier to the downside over the last week.  However we do have signs of excess lows.  And even though the trend of the last few weeks has been lower, we have been essentially flat over the last 2-(almost)3 days.  If we are indeed coming into balance on the short term, then the micro composite VPOC at 1279 becomes a magnet with an even larger composite magnet existing at right about 1295.

If considering a long, one might be able to obtain a better entry by waiting for another lower low to complete a possible correction cycle.  This is very much a speculative roadmap, but I have highlighted my vision below:
GC_08252014

Comments »