Nasdaq futures ticked higher overnight and peaked out around midnight before settling back to about the midpoint of the session. Interestingly, we made a new swing high overnight and the swing high is rarely set outside of normal market hours.
The economic calendar is quiet today. We have the Alibaba IPO set to price out today and also Leading Indicators at 10am.
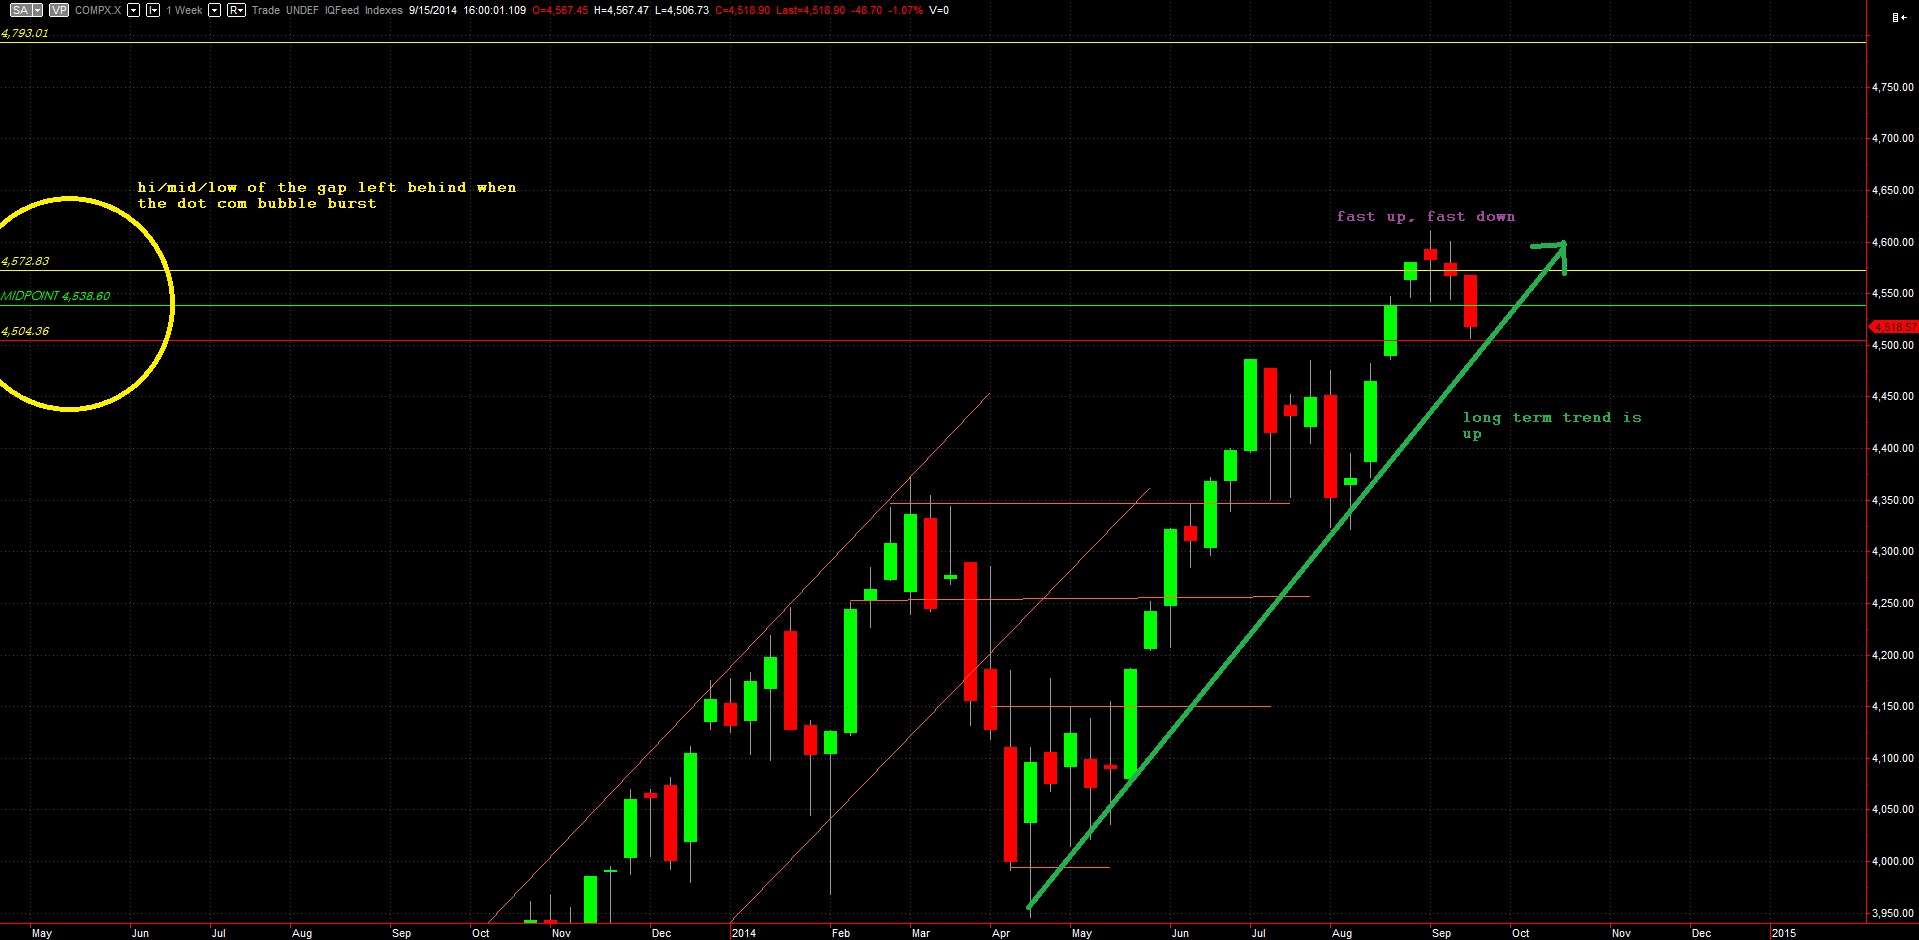
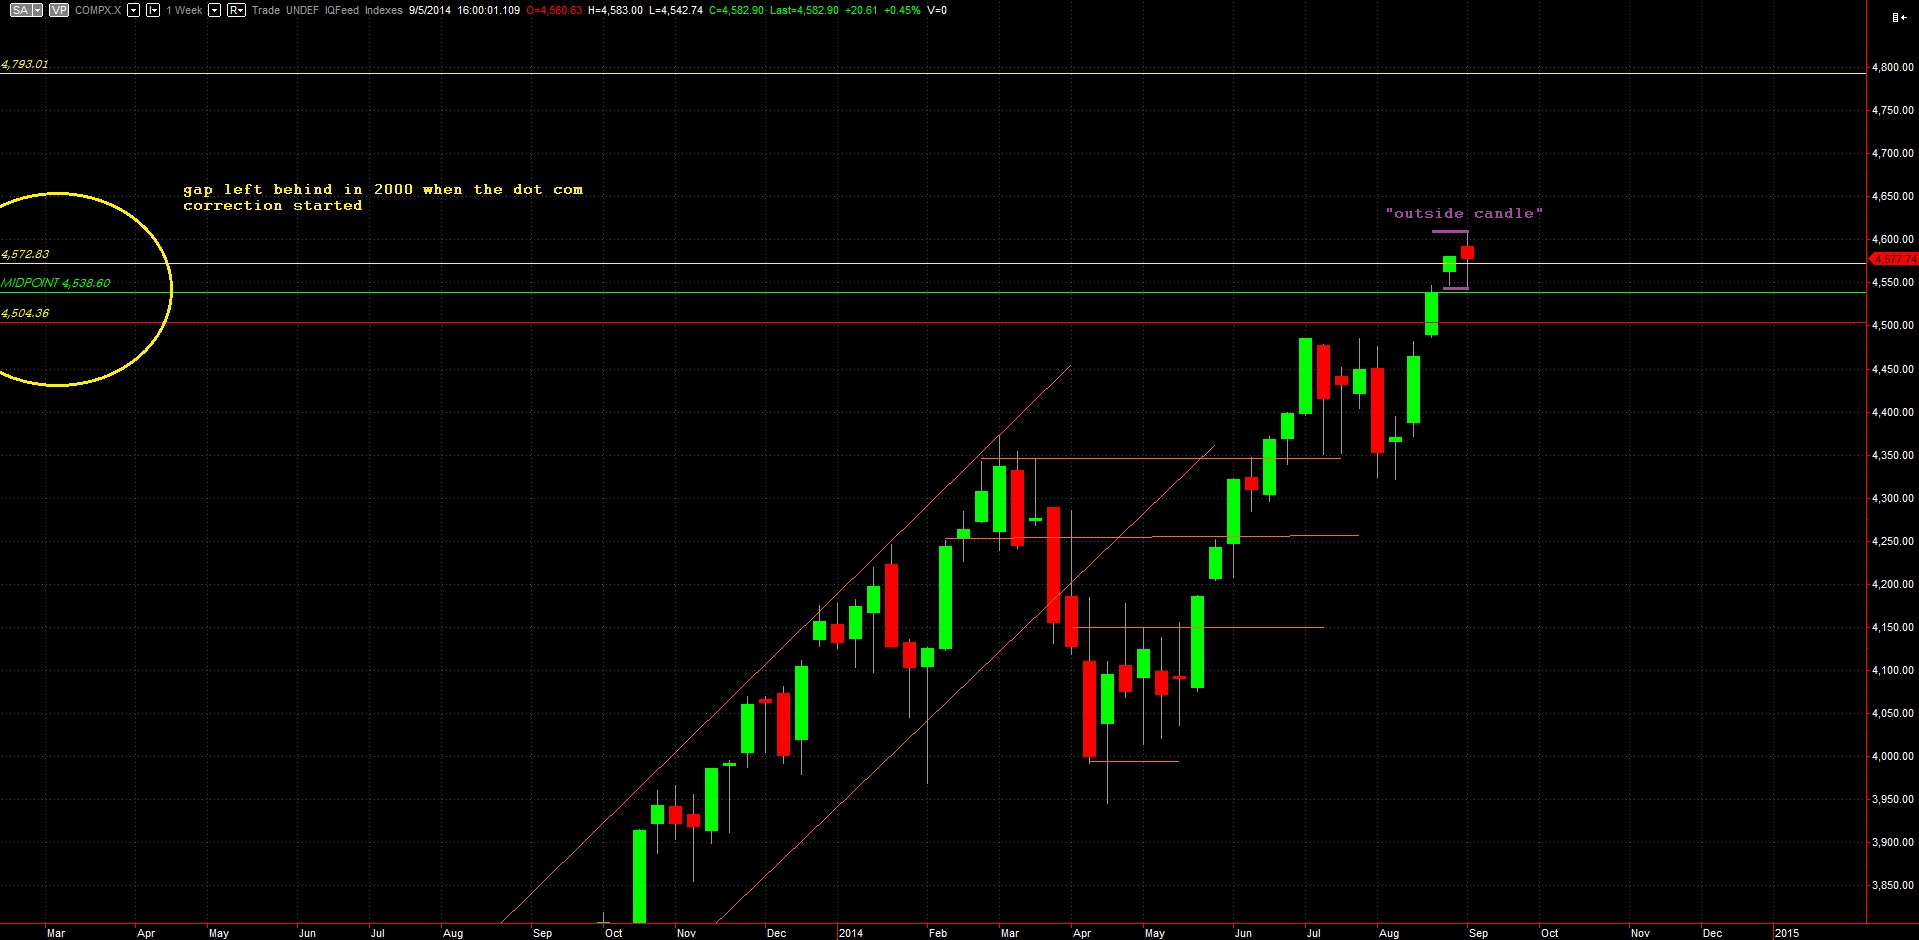
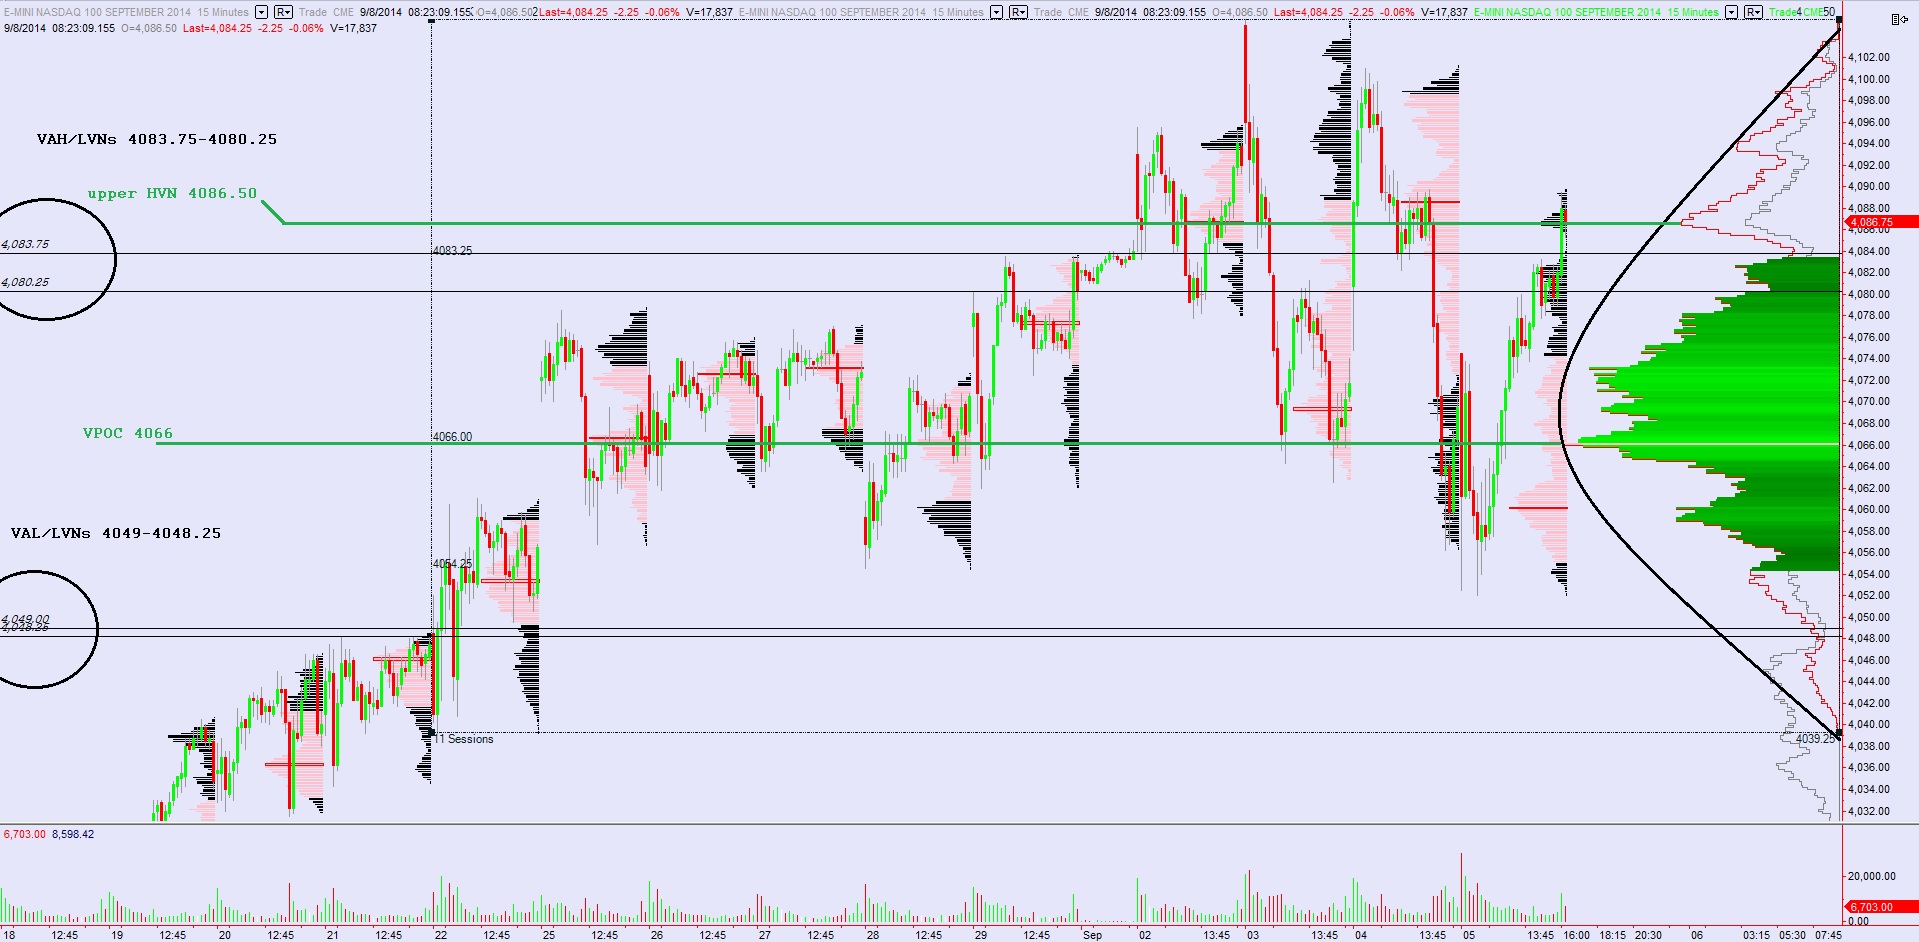
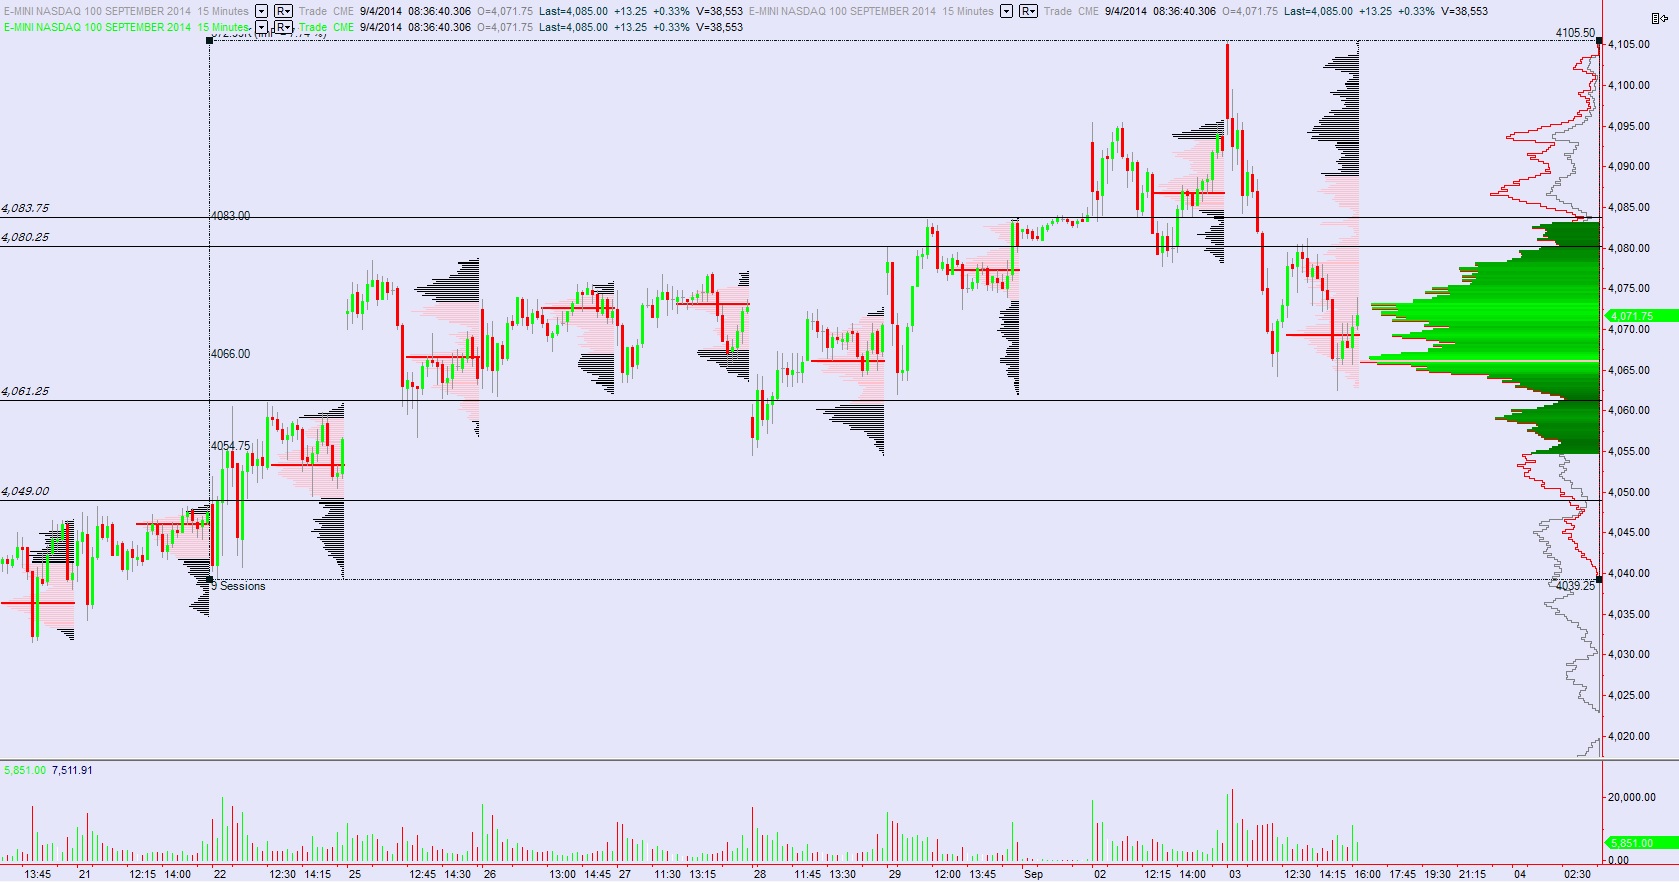
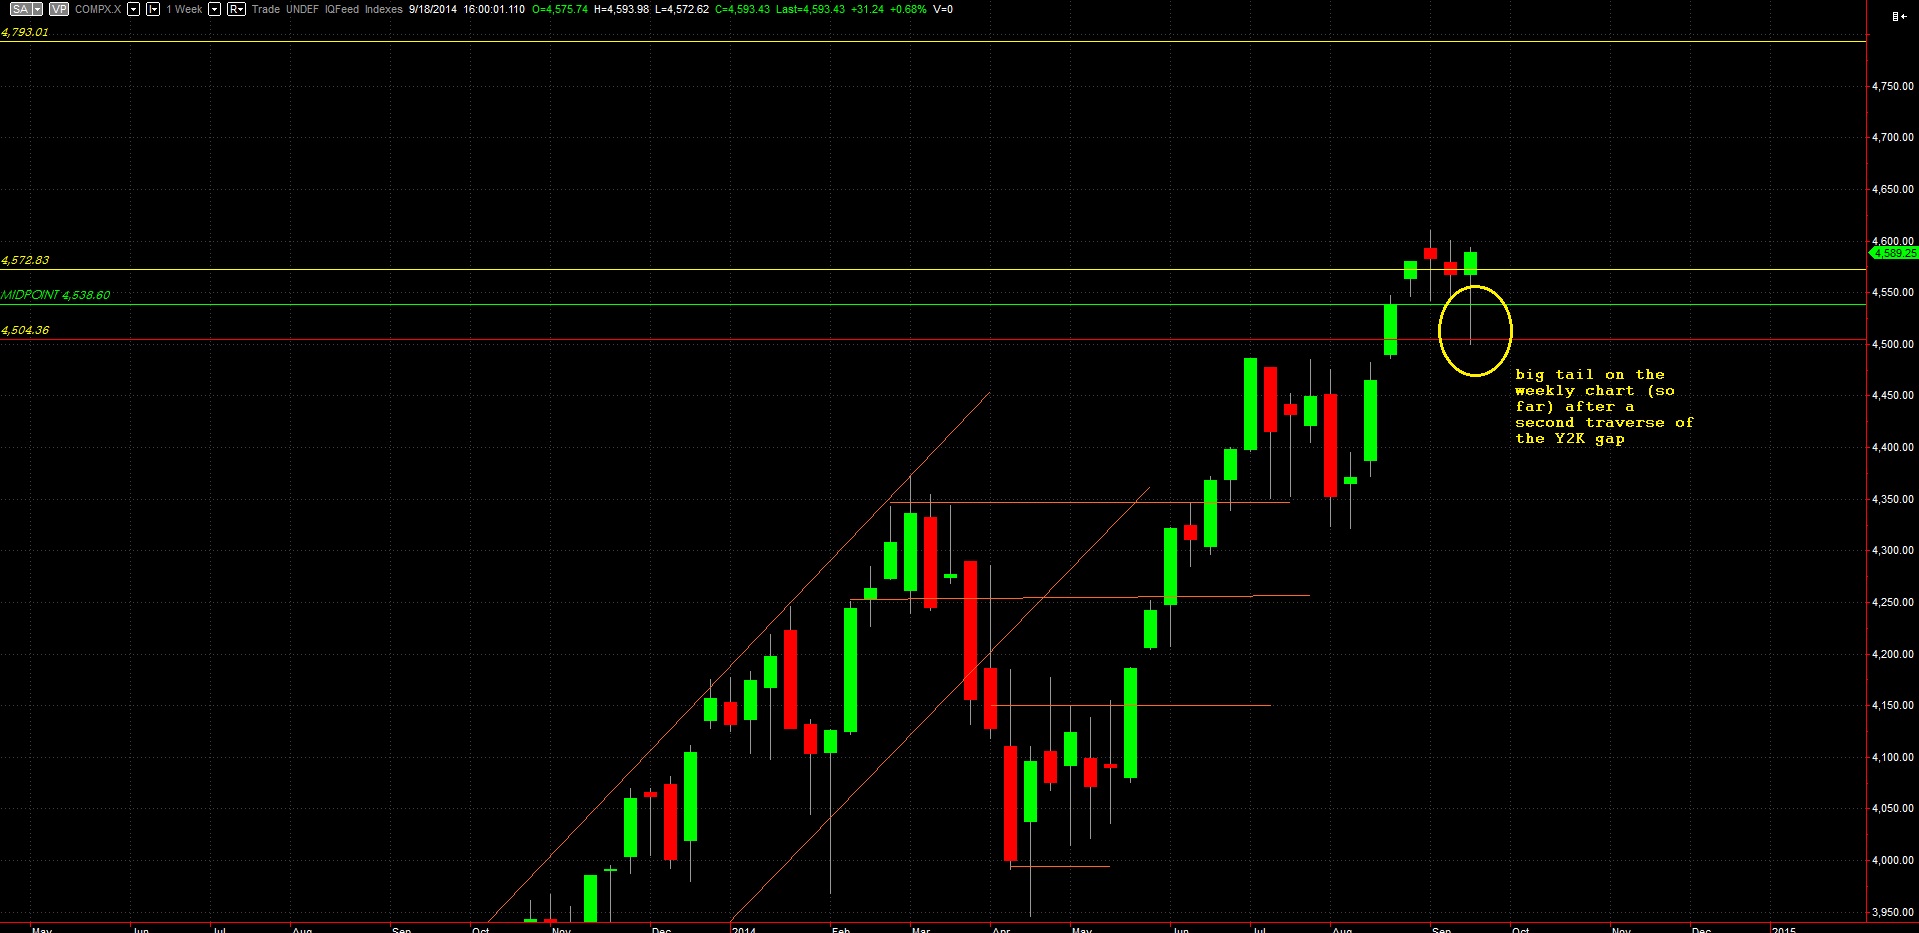
Revisiting the weekly chart, you can see the strong responsive buy that occurred throughout the week which resulted in a long tail on the composite index. What we need to wonder is whether buyer expended all their energy in this response, or whether they will be able to make a fresh push higher. See below:
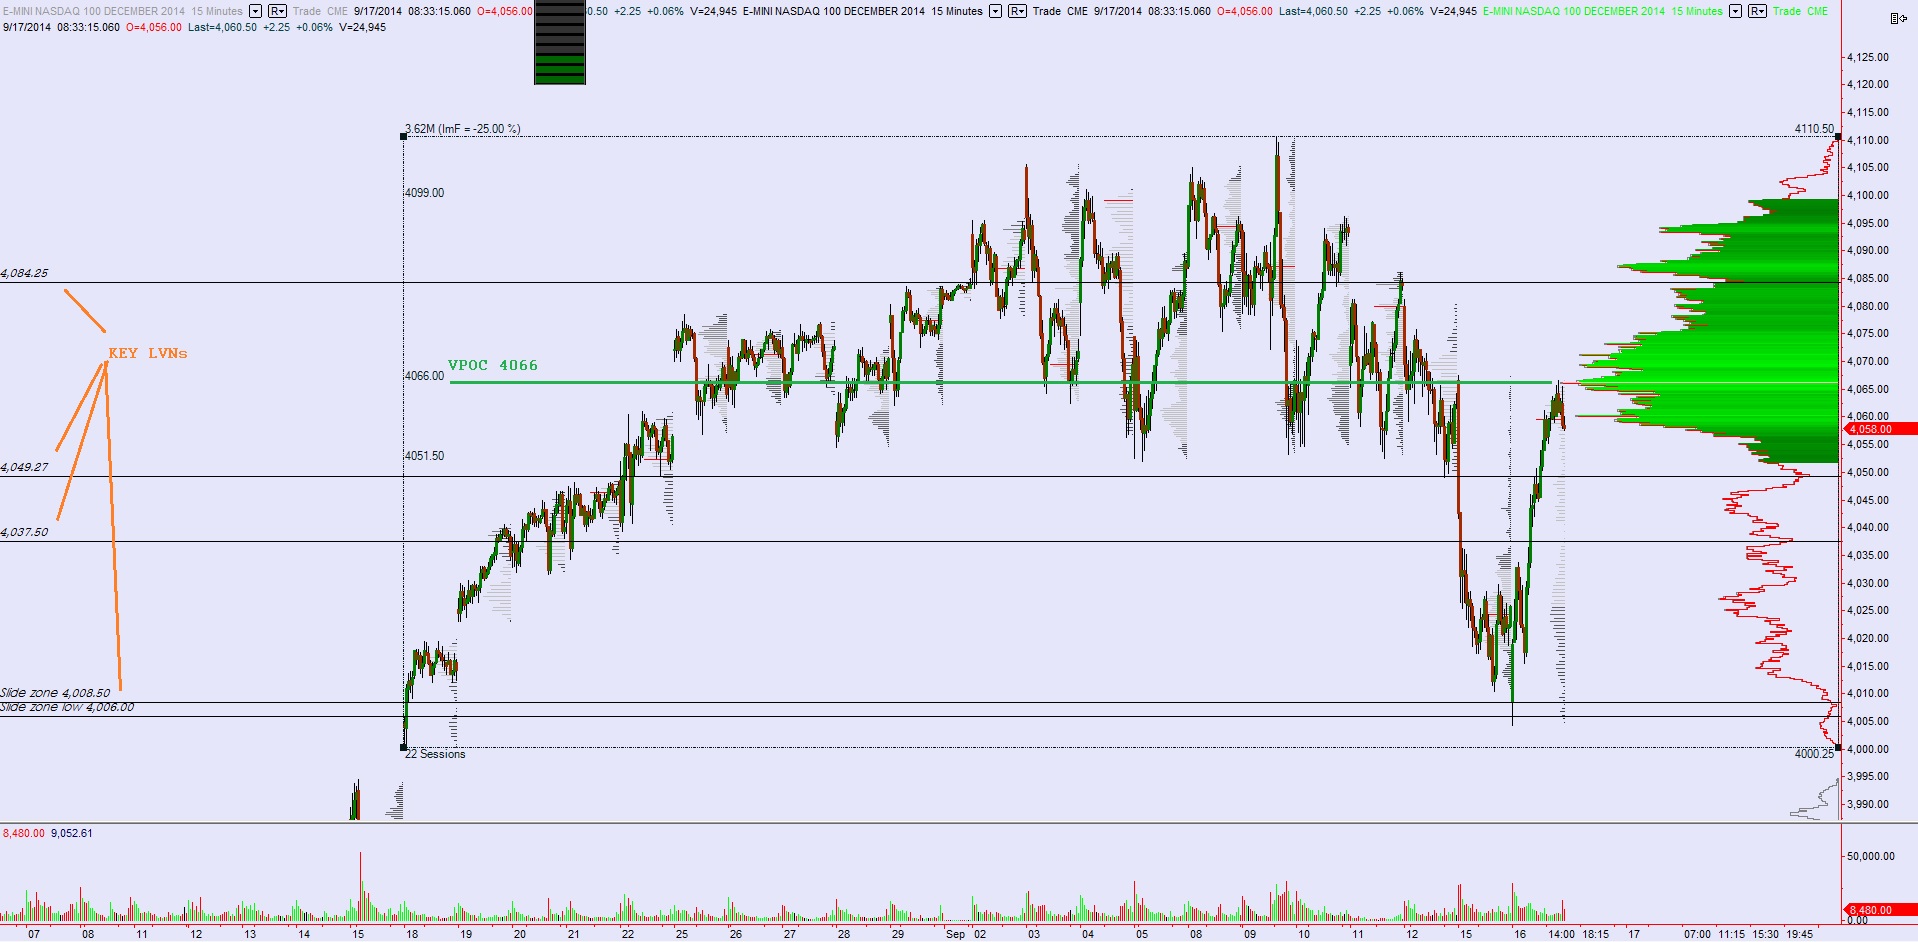
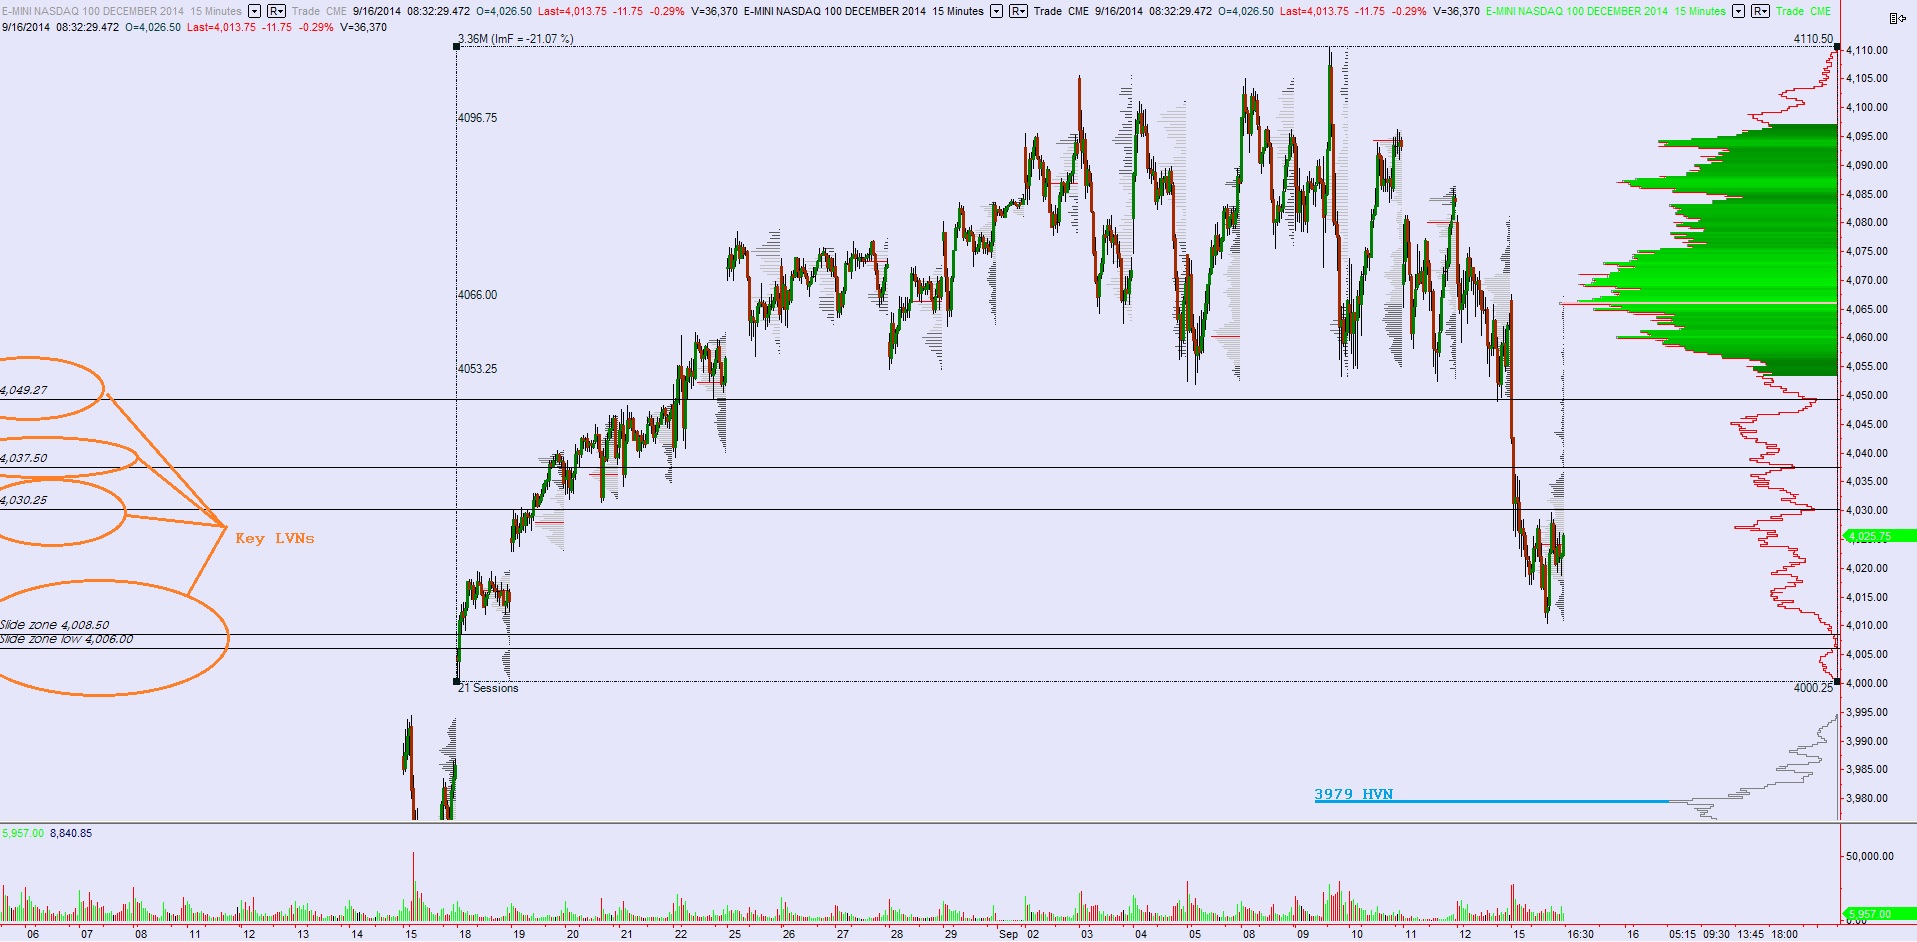
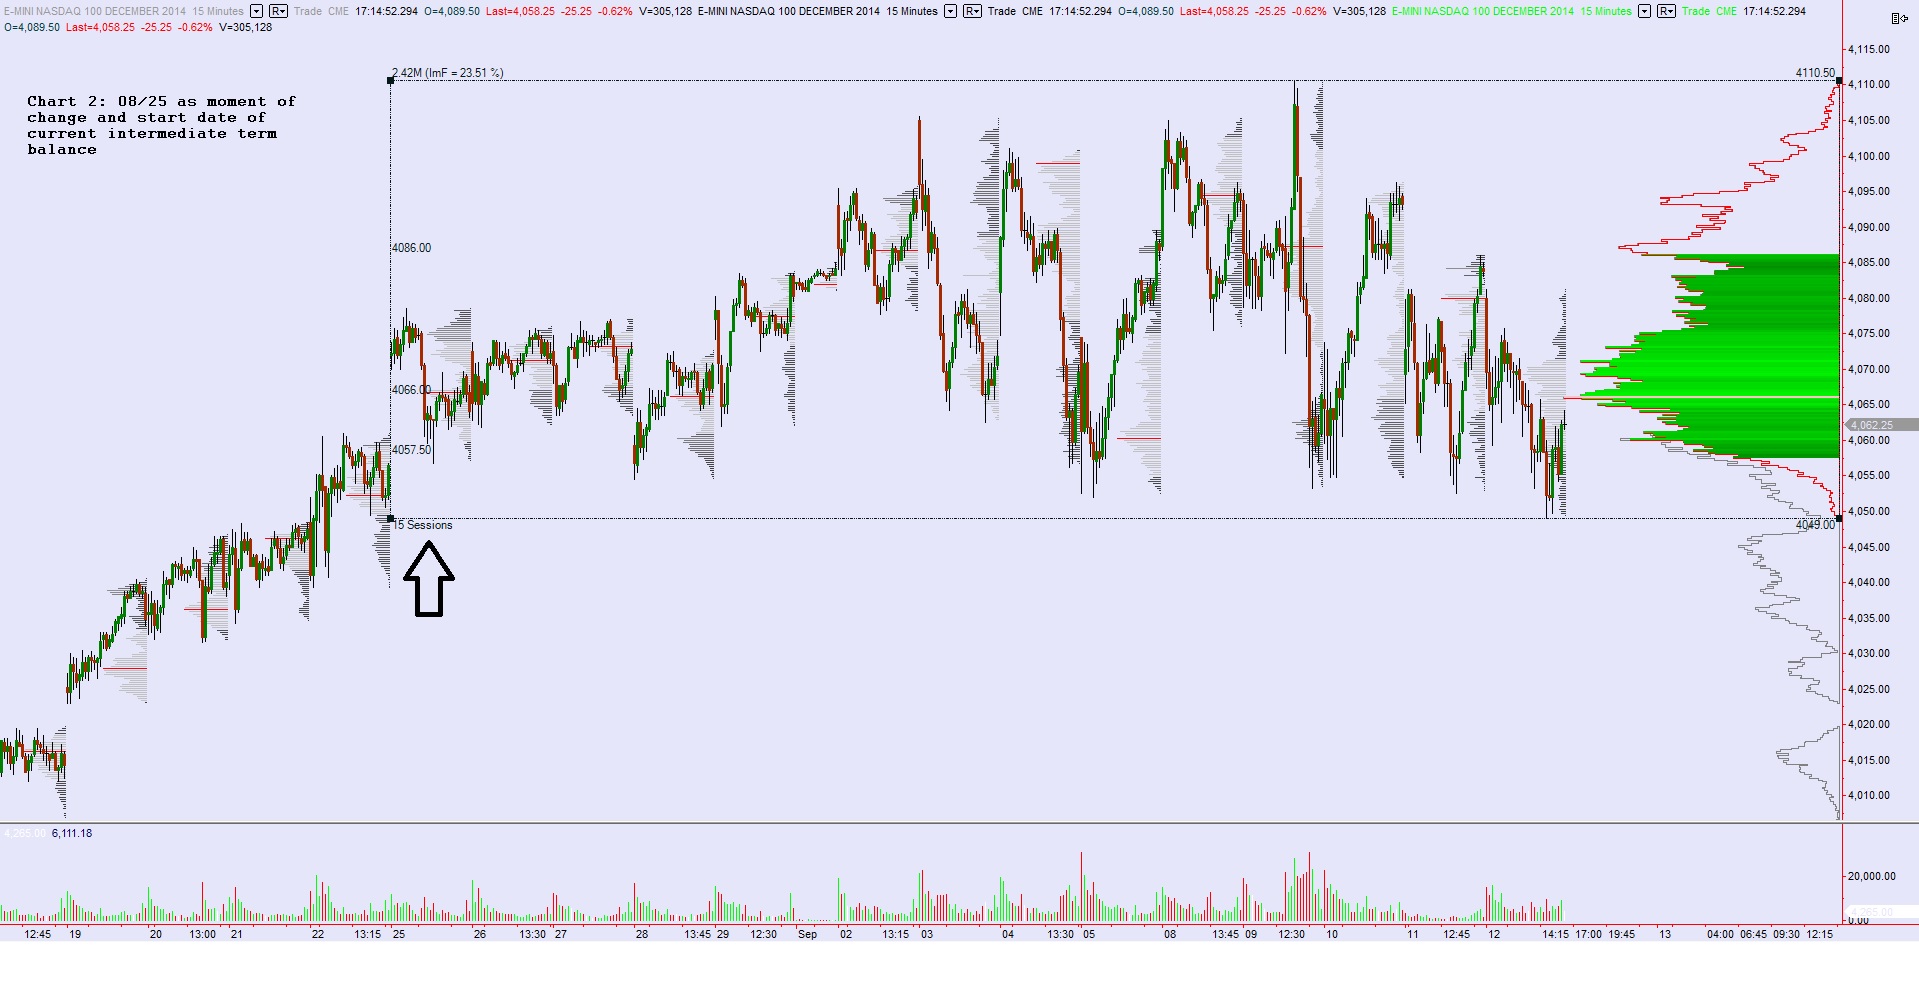
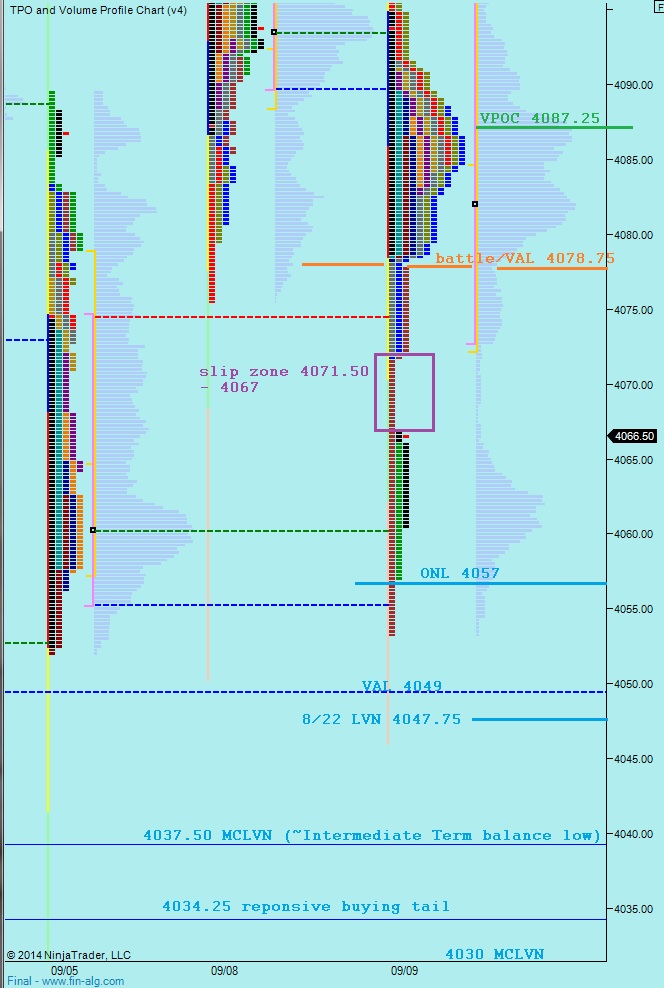
Intermediate term, we are in the precarious position of hanging out on the fringe of intermediate term balance. As we saw Monday and Tuesday, the gravitational force of the mean can cause a rapid revision. As we press the upper boundary, we need to be cautious. Keep in mind however, this balance is old, and the market is likely to begin exploring soon. I have highlighted the intermediate term balance and some key levels within it below:
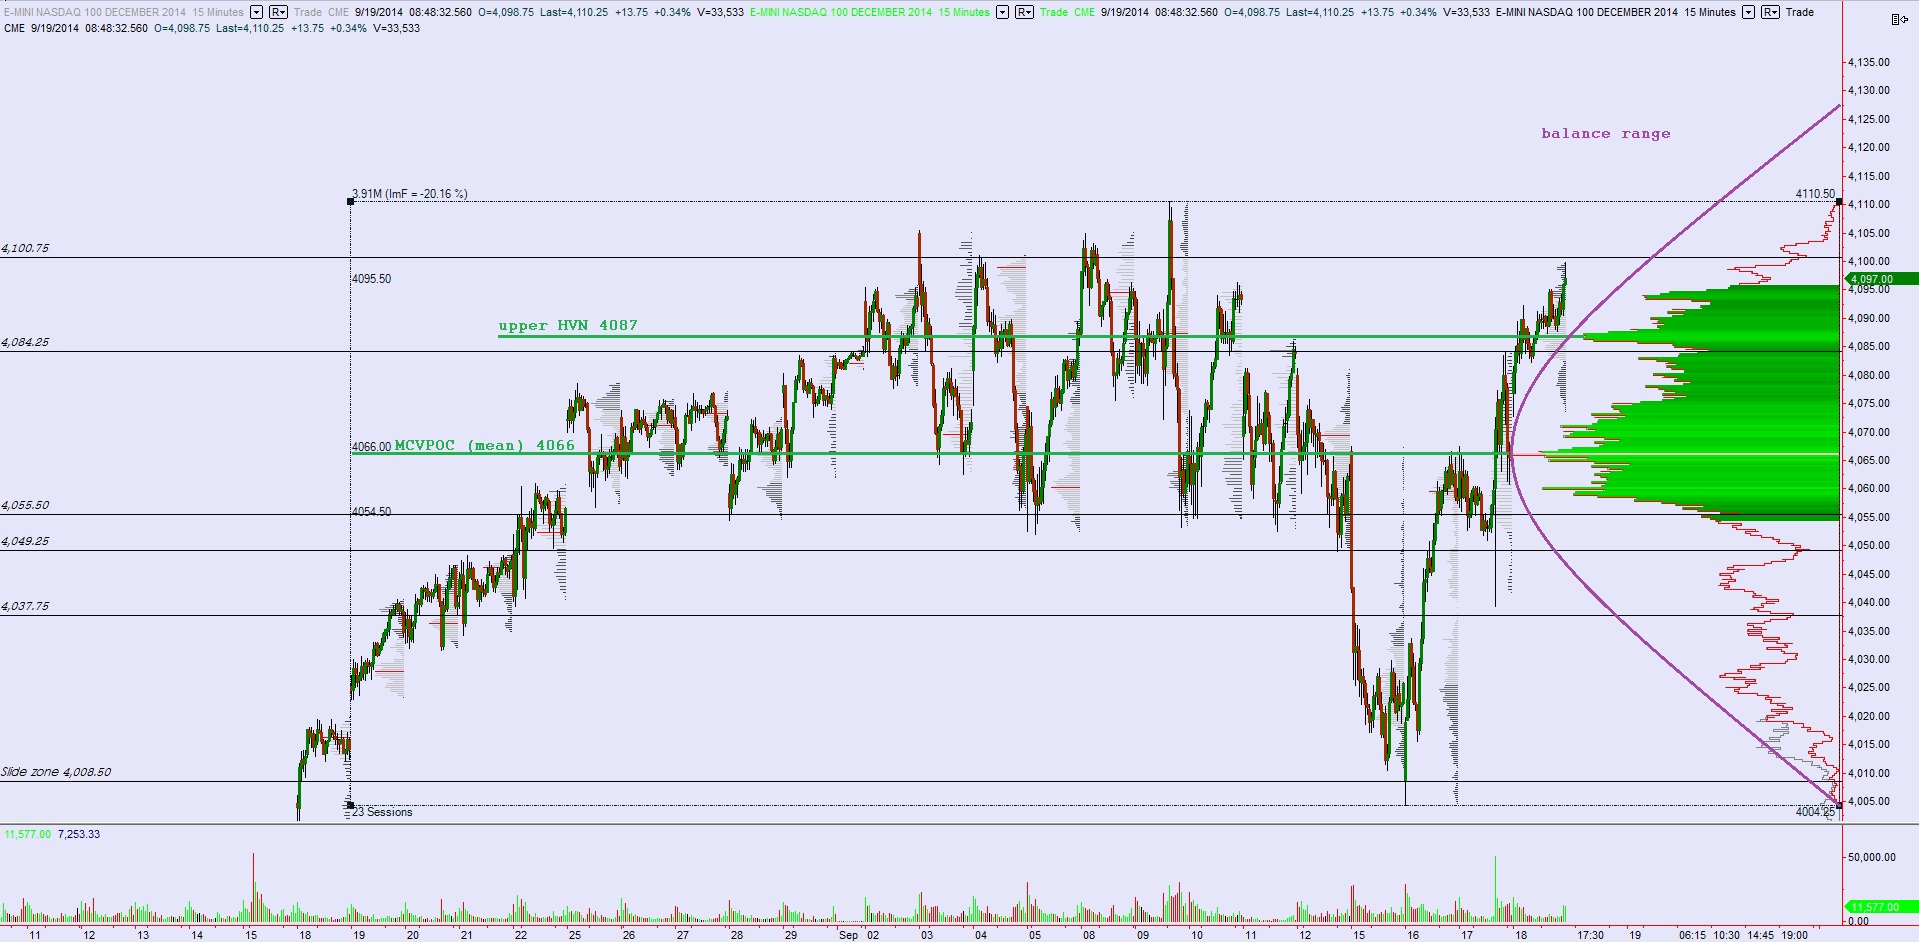
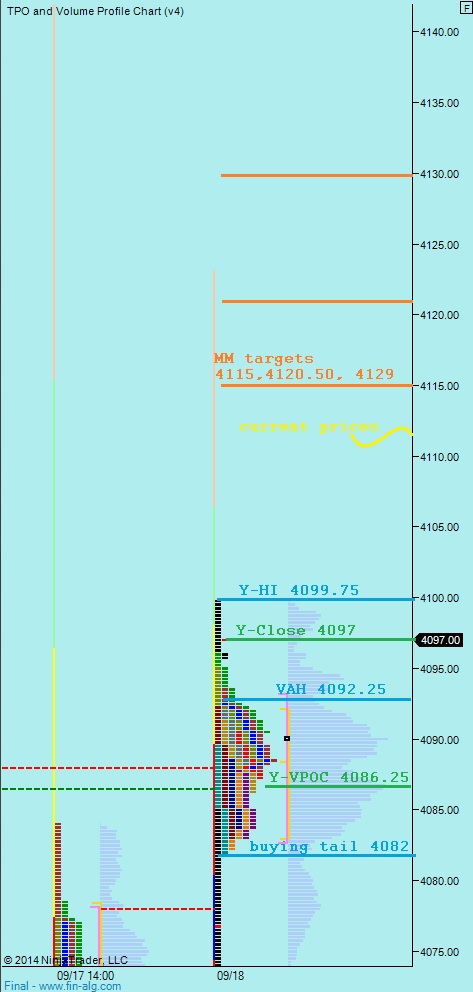
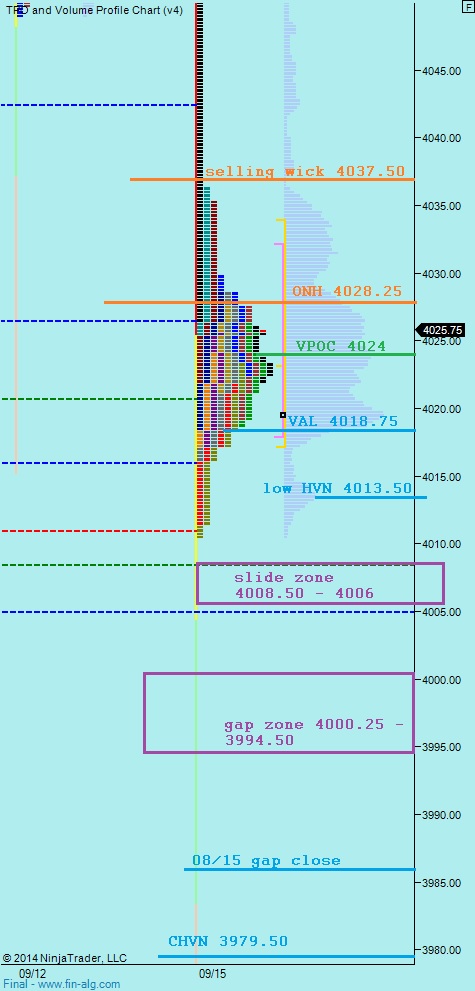
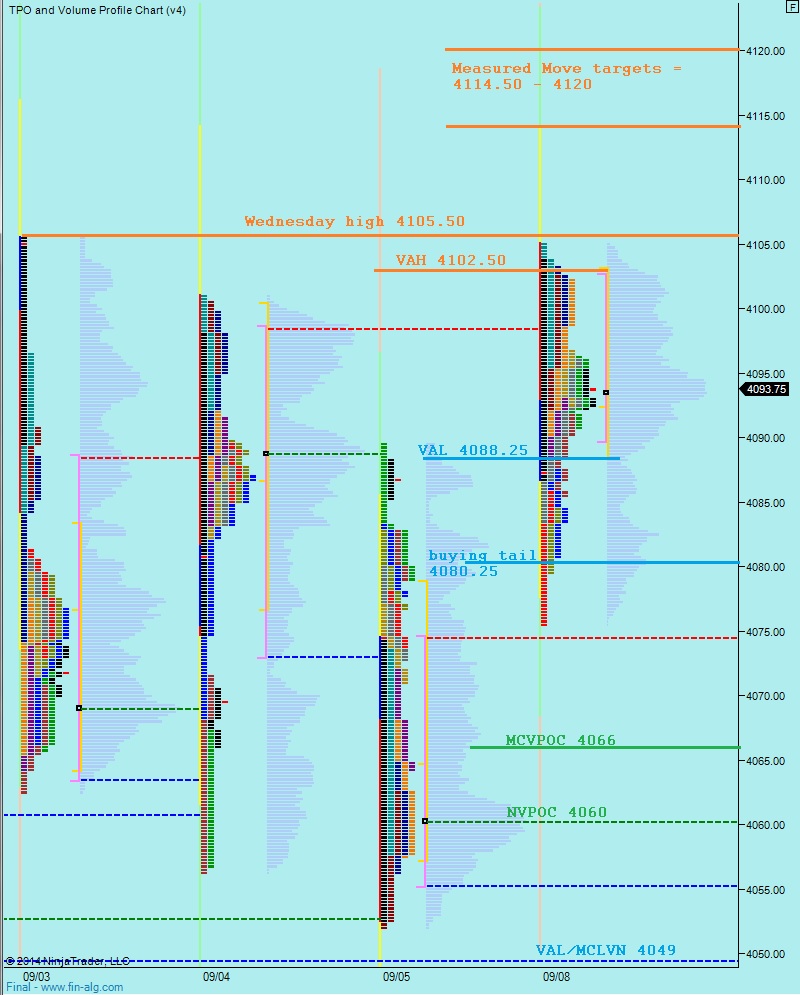
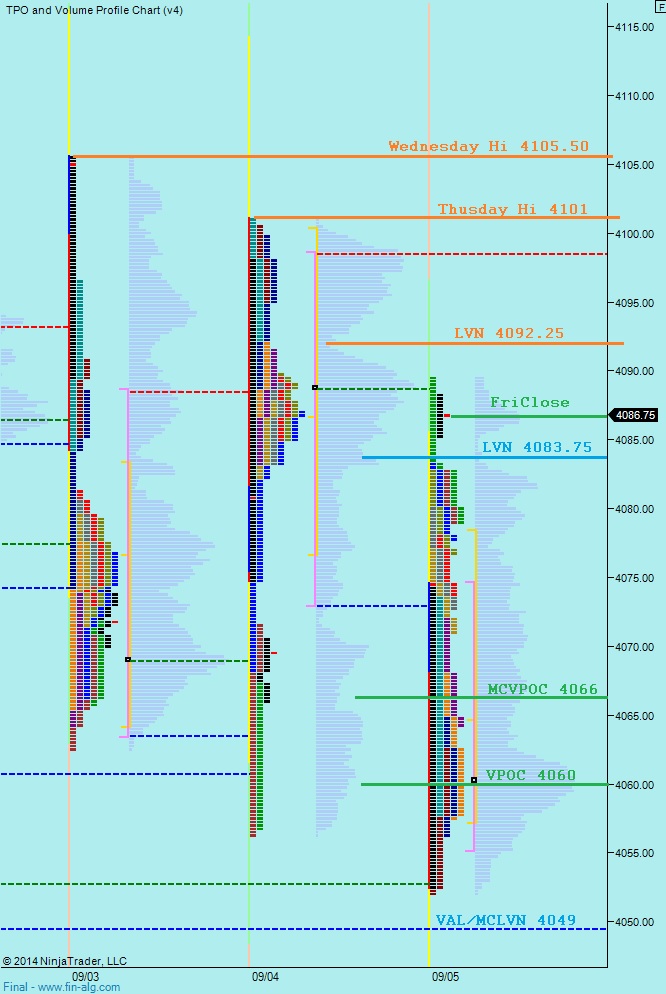
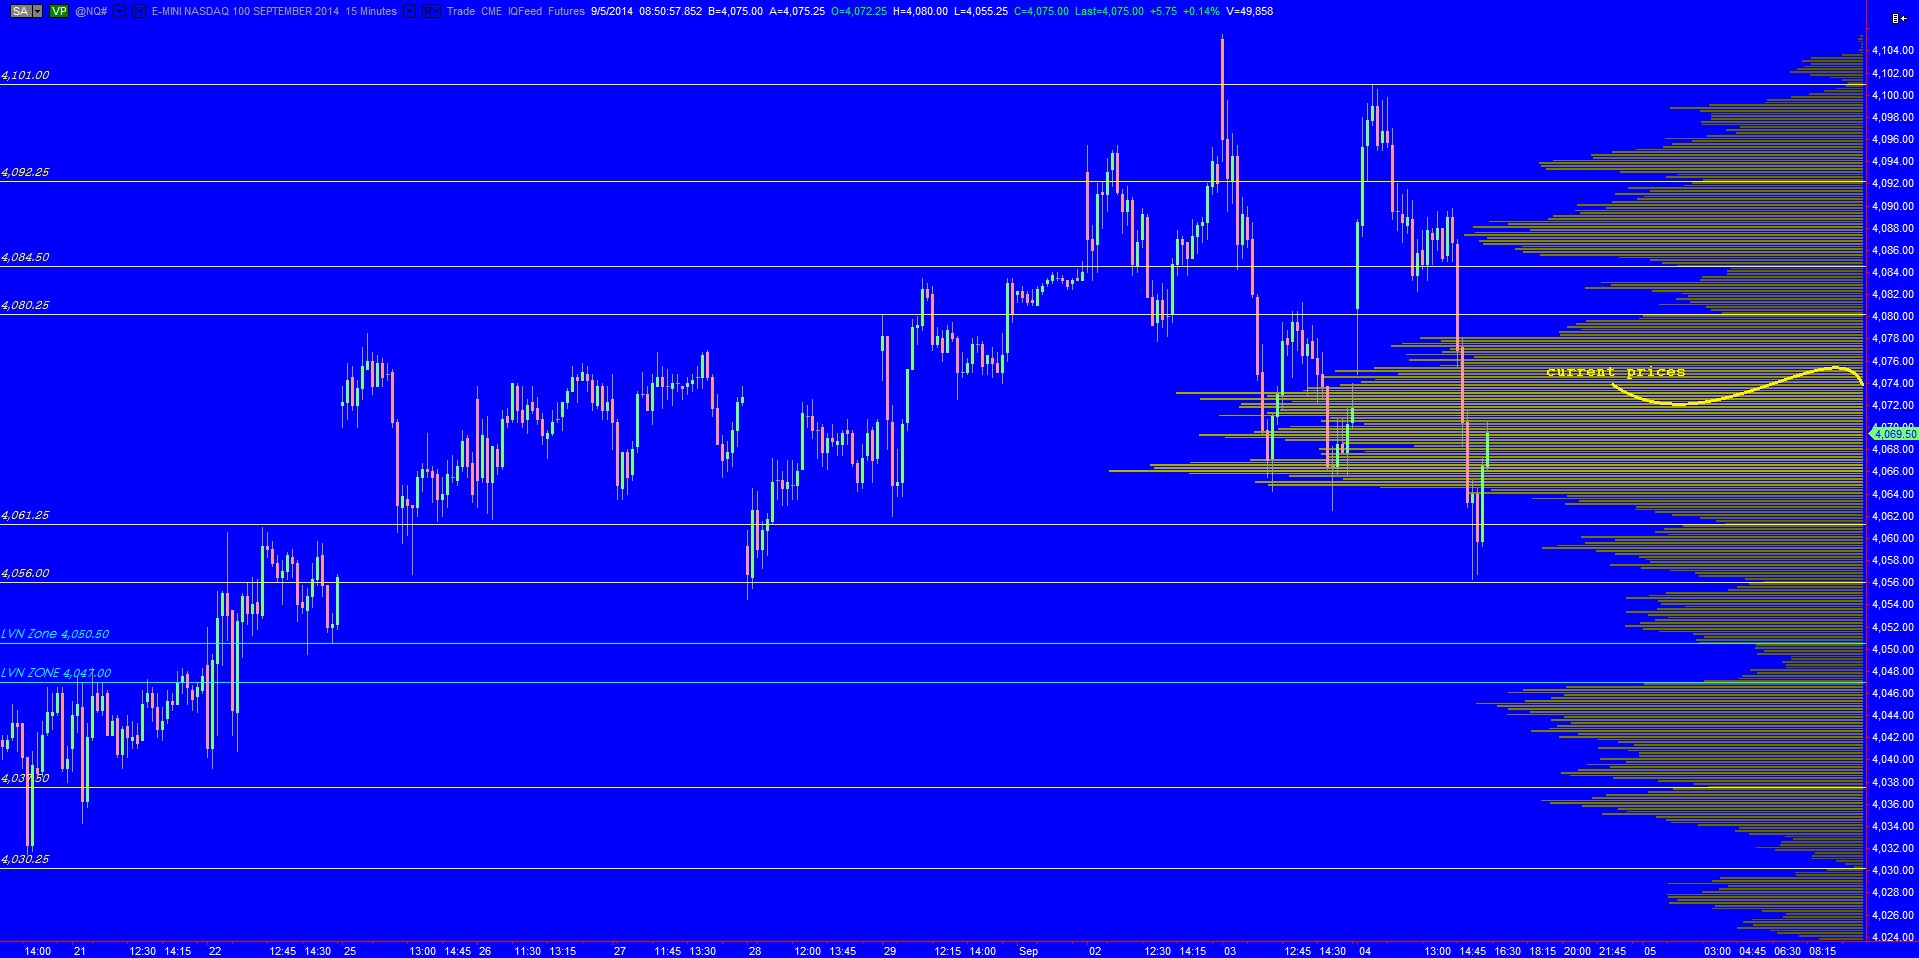
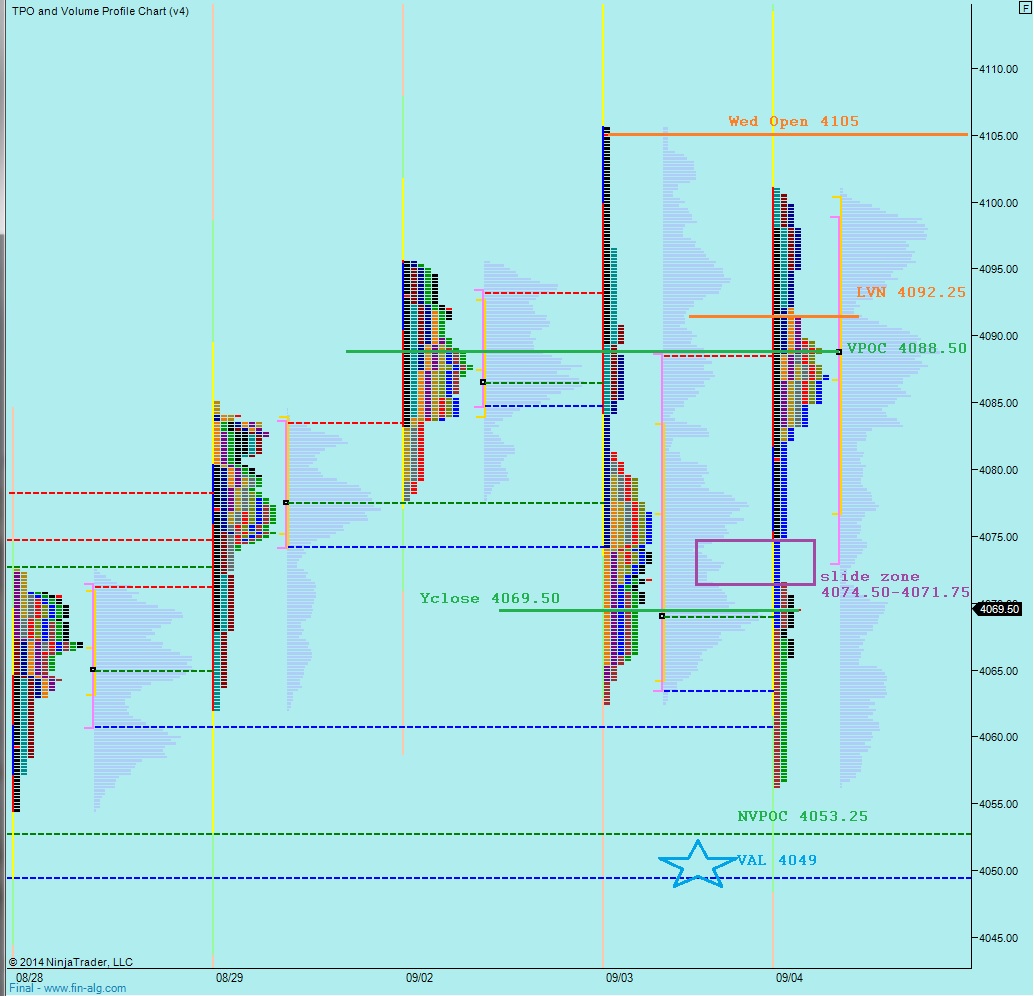
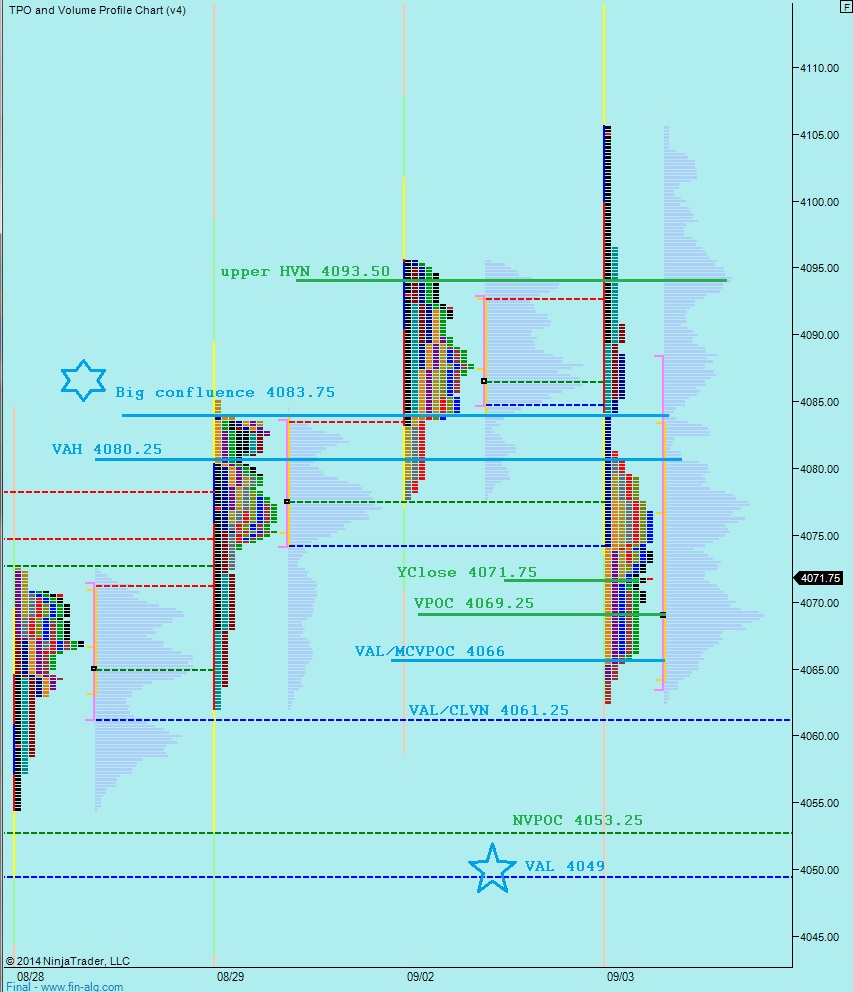
I have noted the short term levels I will be observing on the following market profile chart: