Something to keep in mind whenever using a tool or indicator or data set to observe market behavior is the risk of confirmation bias. As objective as numbers and graphical representations of numbers are at first impression, as we shape them and select pieces from them we form our own data. The key is perception and whether it is guided by the logical mind or the more instinctive, yet emotional mind.
One of the essential tasks for any trader is knowing when conditions have changed as early as possible. Some strategies fare better in certain conditions, like balance. Other strategies would be better suited for the price discovery phase. If these concepts are a bit over your head, then I suggest taking a few hours to bring yourself up to speed with market profile. This however is not mandatory to interact with today’s post.
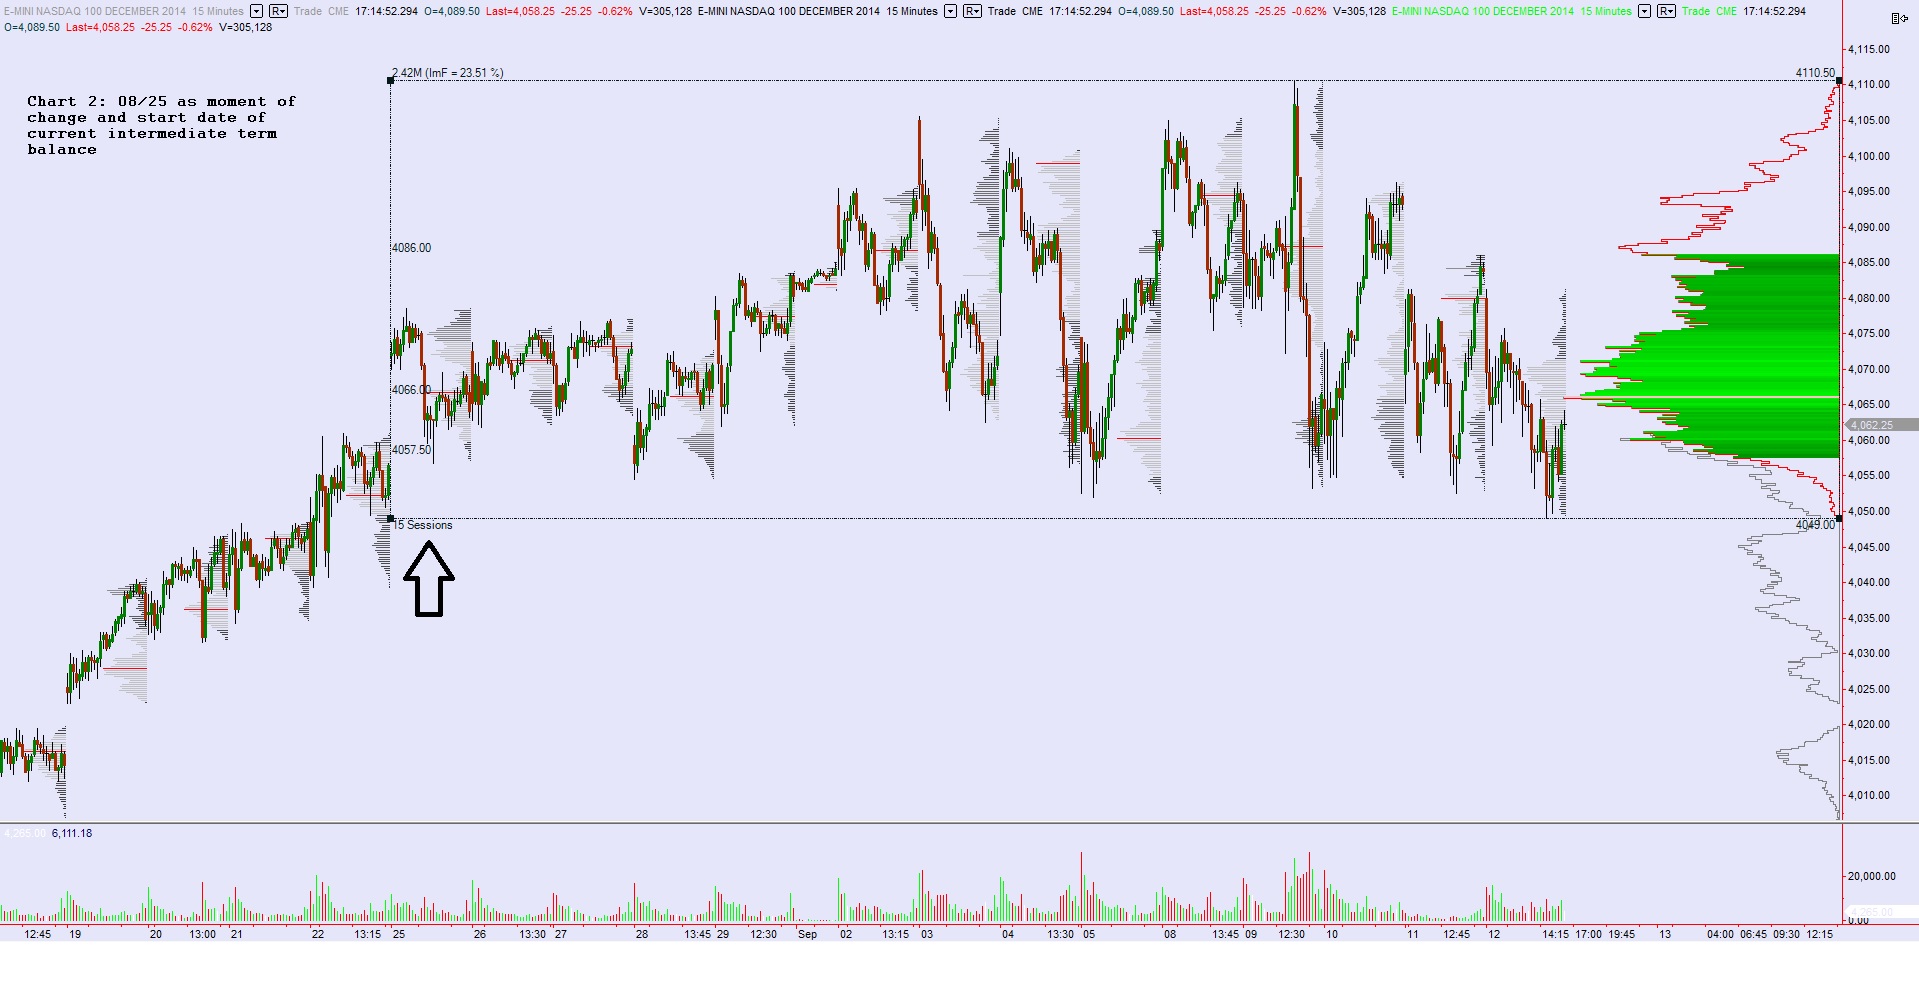
Below I present the same chart in every way except one—the first chart shows our developing balance as I have presented it for the last several sessions, with 08/22 being the point of change where our current balance initiated. The second chart instead uses 08/25, the following session. What I need your help with, traders, is determining when the CHANGE event occurred.
The implications are important for a few reasons. I will discuss these in detail if I have at least five votes. Observe the two charts below and simply leave a comment whether your think chart 1 (08/22) or chart 2 (08/25) marks the moment when a change occurred which led us into our current balance. If you feel like it, add a few notes about why you answered the way you did. See below:


Raul, I’m going to cast my vote for Chart 2. Really curious to read what you have to say later.
Chart 2 from 8/25. I’m just going to guess. It looks like the range contracted from 4039.25 to 4049 on the low side. I’m assuming the pink line is the intermediate term you’re referring to. Also, due to the range contraction it kind of makes it look like a poor low? Just a guess. I’m still trying to learn.
Vote- Chart 2. It felt like the low on friday’s broke previous low, closed below pink line 4065 while value of the session seems to at higher side 4069? Do these factors set different tone and possible move to new and lower price range in your eye?
I’ll go out on a limb here and take Chart 1.
I hypothesize that the gap on the 8/25 chart (incidentally, thank you for posing the question in such a way that I had to look it up) was due to the CME fuckup and unrelated to a fundamental catalyst. http://www.reuters.com/article/2014/08/25/cme-group-trade-issue-idAFL3N0QV08J20140825
The interesting question is what about all those times when there’s a gap, and nobody reports on a catalyst. Is there a catalyst or isn’t there? Recent stock-related example: NOR (no position) +30% on Friday lolwut?
Touche sir. I had forgotten about that CME screwup.
Good points. Gaps suggest strong motivation behind a move. Whether it’s a glitch or legit strong demand in the above case certainly adds a layer of fog.
Great stuff. Big fan of your work Raul.
I’m going w/ chart 1; guessing the 22nd shows where value was accepted higher and setting the stage for the next move.
vote chart 2 as I think the gap (reason be damned) showed acceptance of higher price. Big question now is if we open below balance, do we trend down?
Final tally: 4 votes for chart 2, 3 votes (mine included) for chart 1.
WE SHALL GO FORWARD USING CHART 2, post forthcoming.