On the economic calendar today we have New Home Sales set for release at 10am. Interesting anecdote, I was speaking with the largest lumber dealer in the metro Detroit area over the weekend who said they are having their best year on record. Odd, or he’s lying. Energy traders will be watching the 10 and 10:30am releases of crude oil, gasoline, and distillate. Fed Mester will speak on monetary policy at 12:15pm and Fed Evens will s peak at 1:00pm on the labor market. Pre-market Thursday we have US Durable Goods Orders on the docket which is something to keep in mind for any overnight positions you intend to hold.
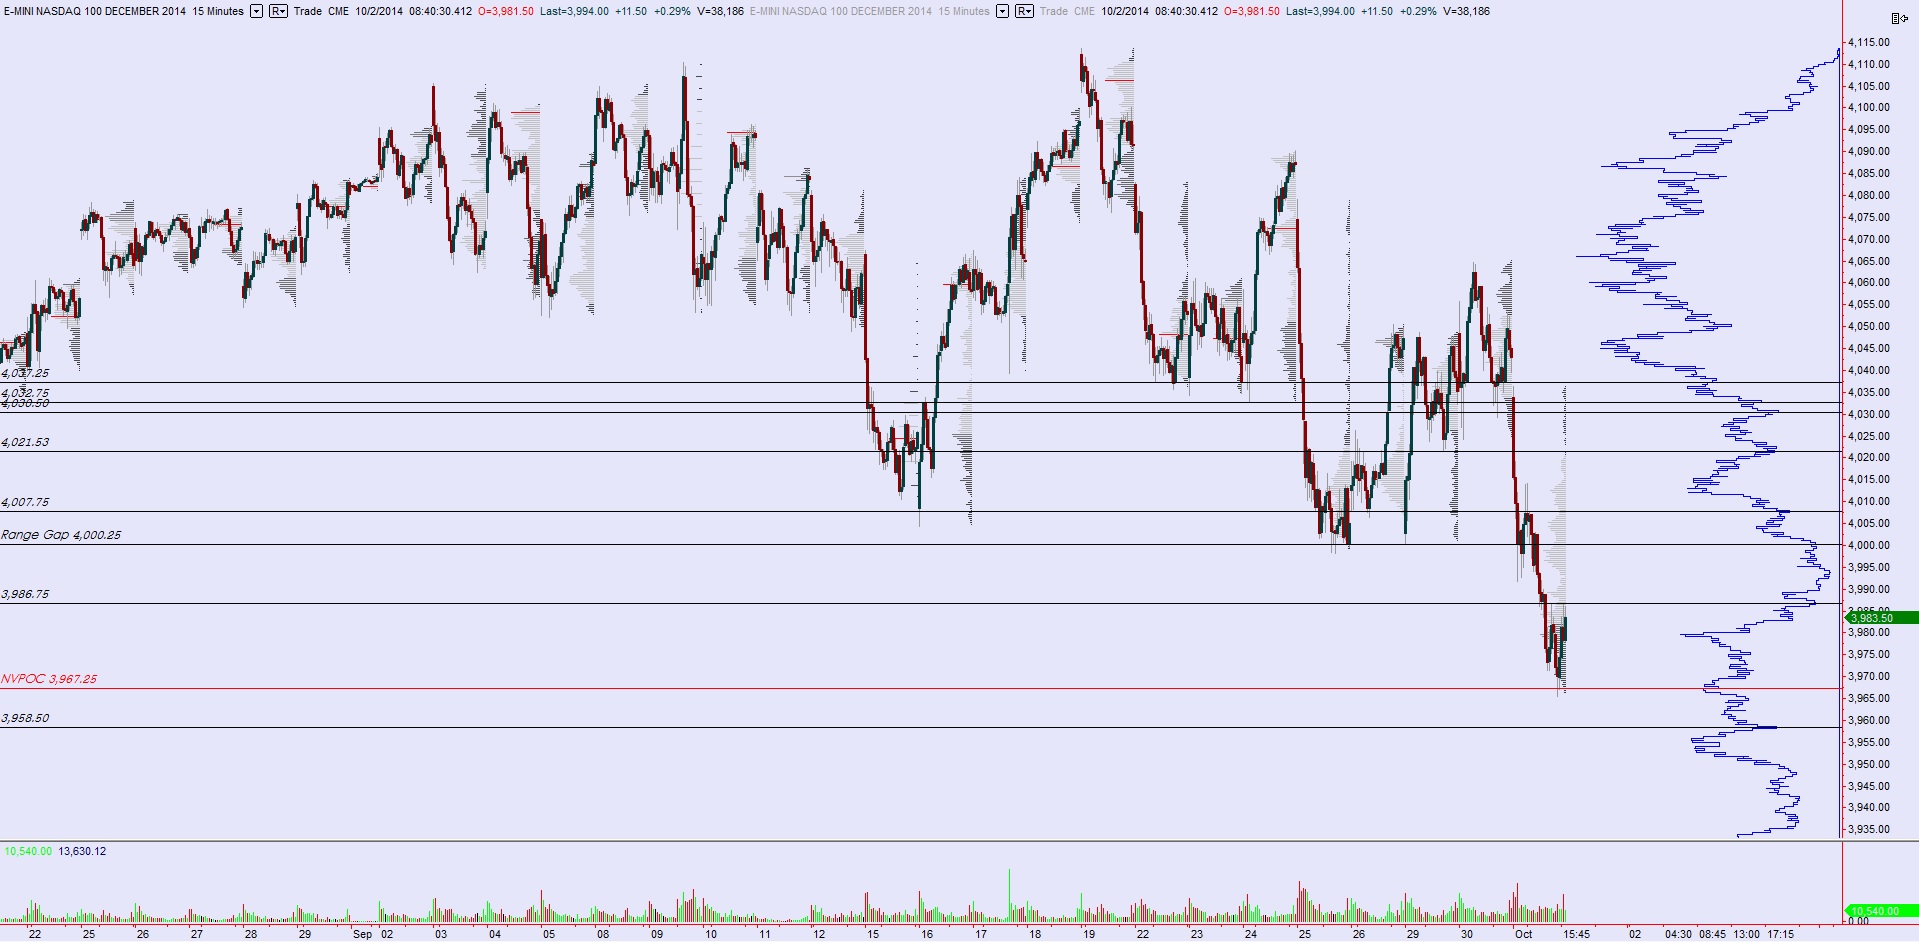
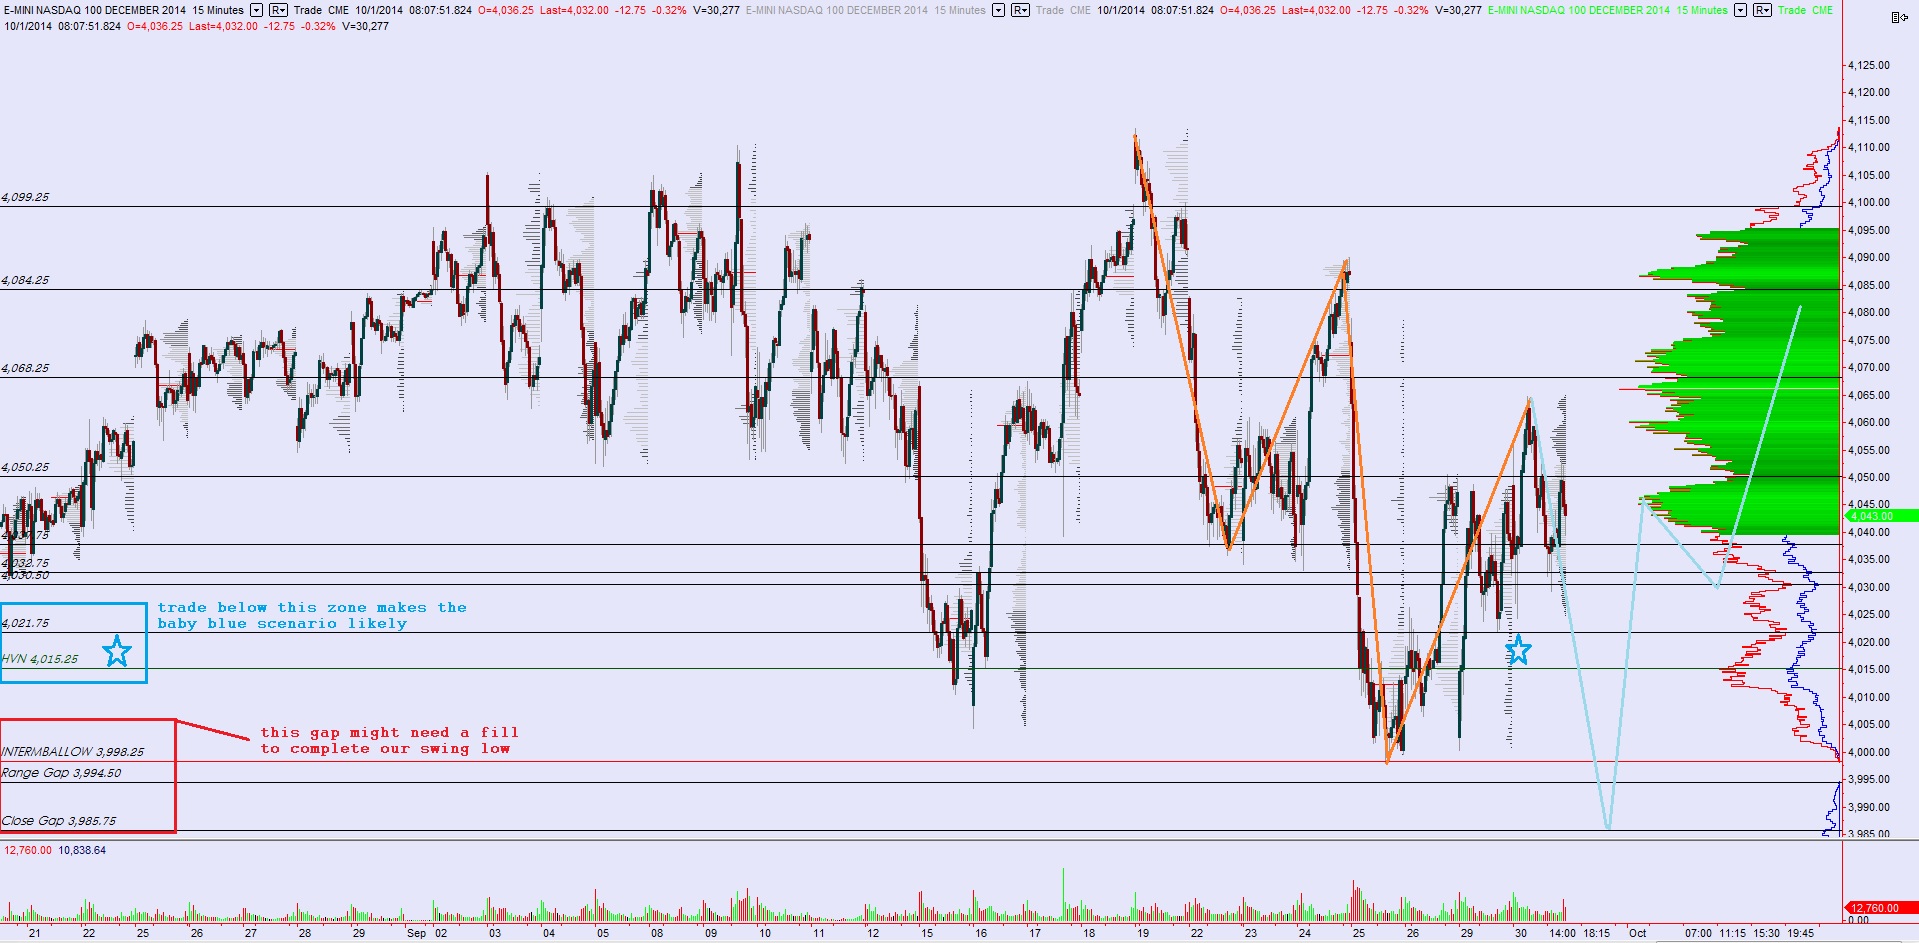
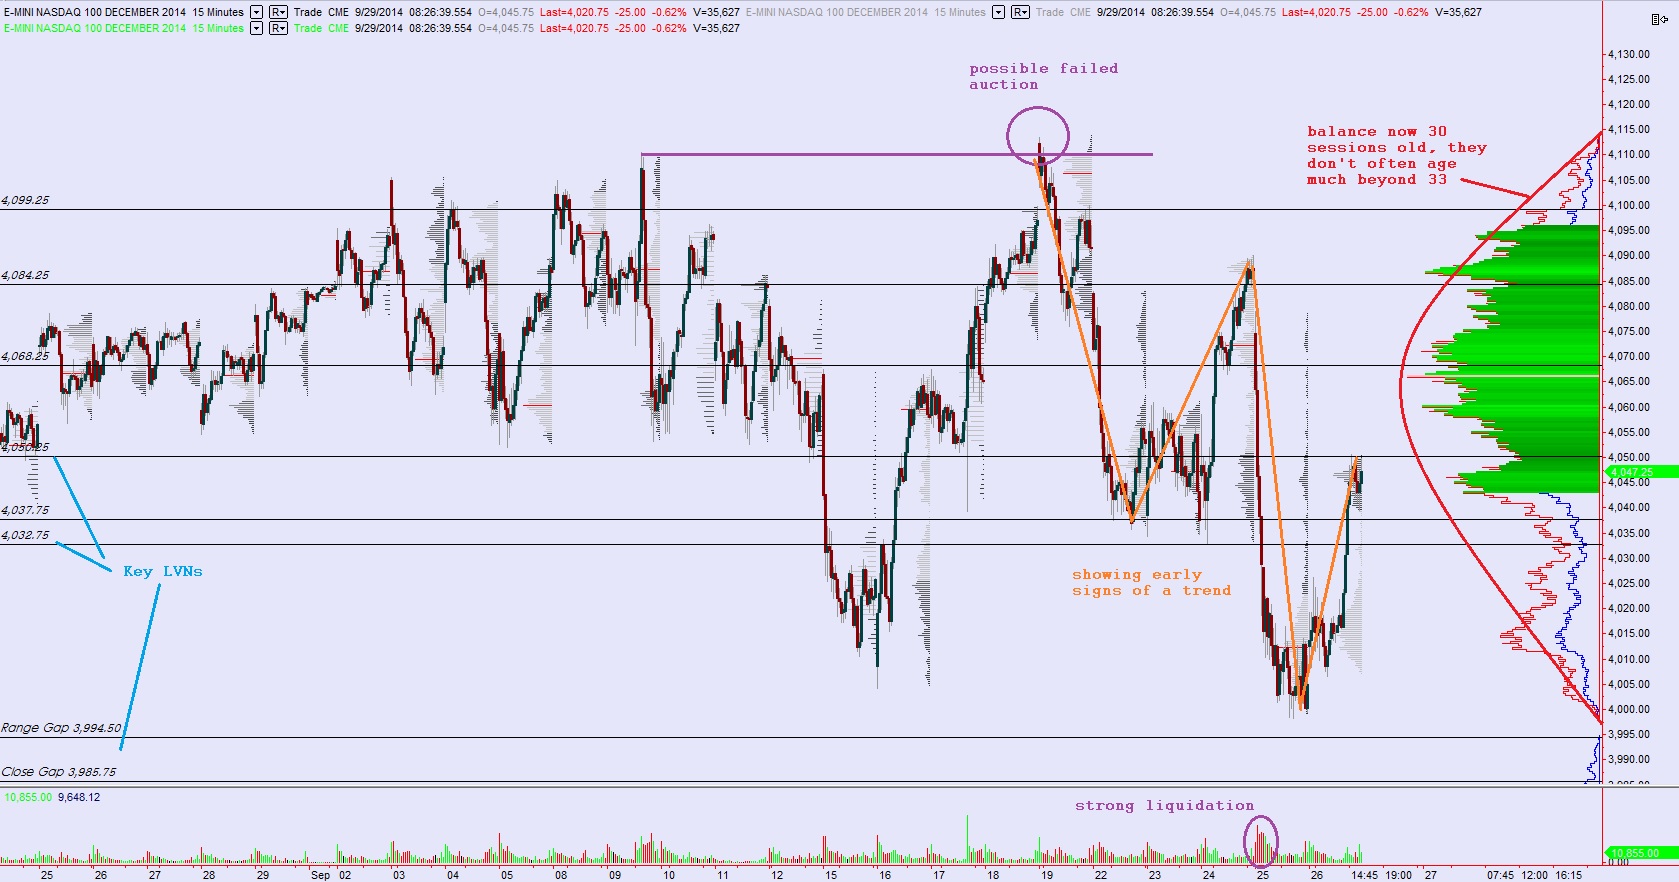
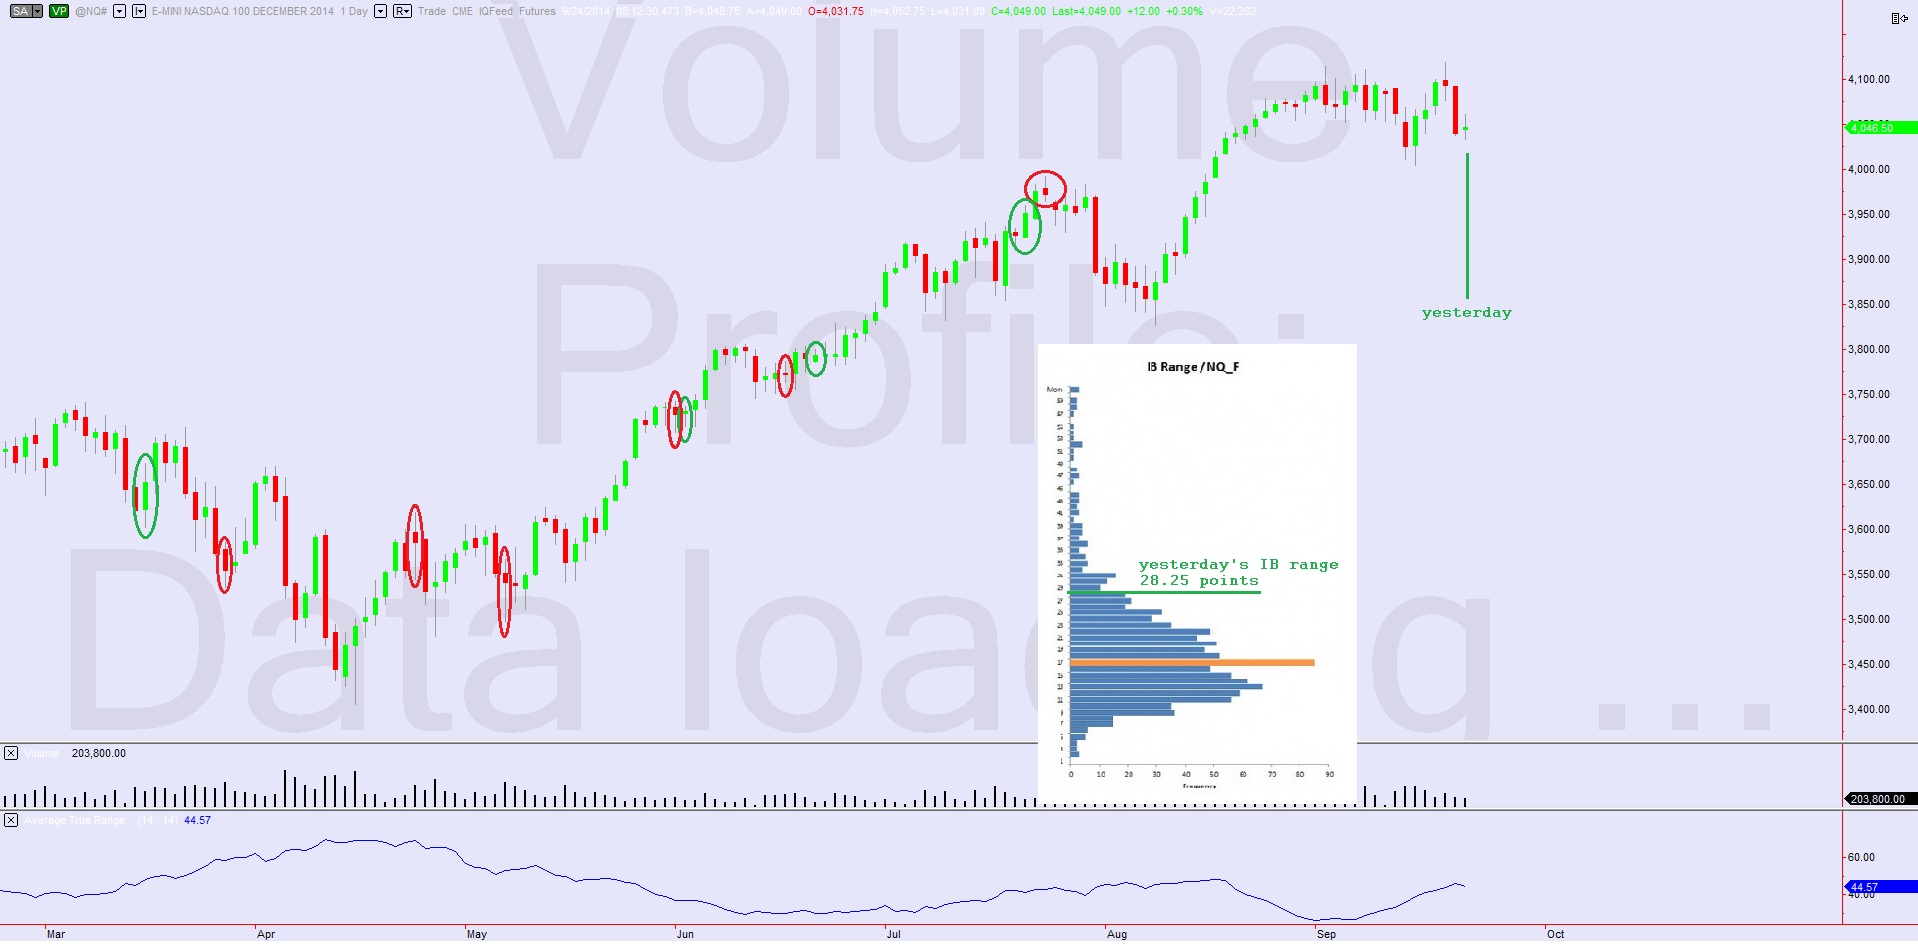
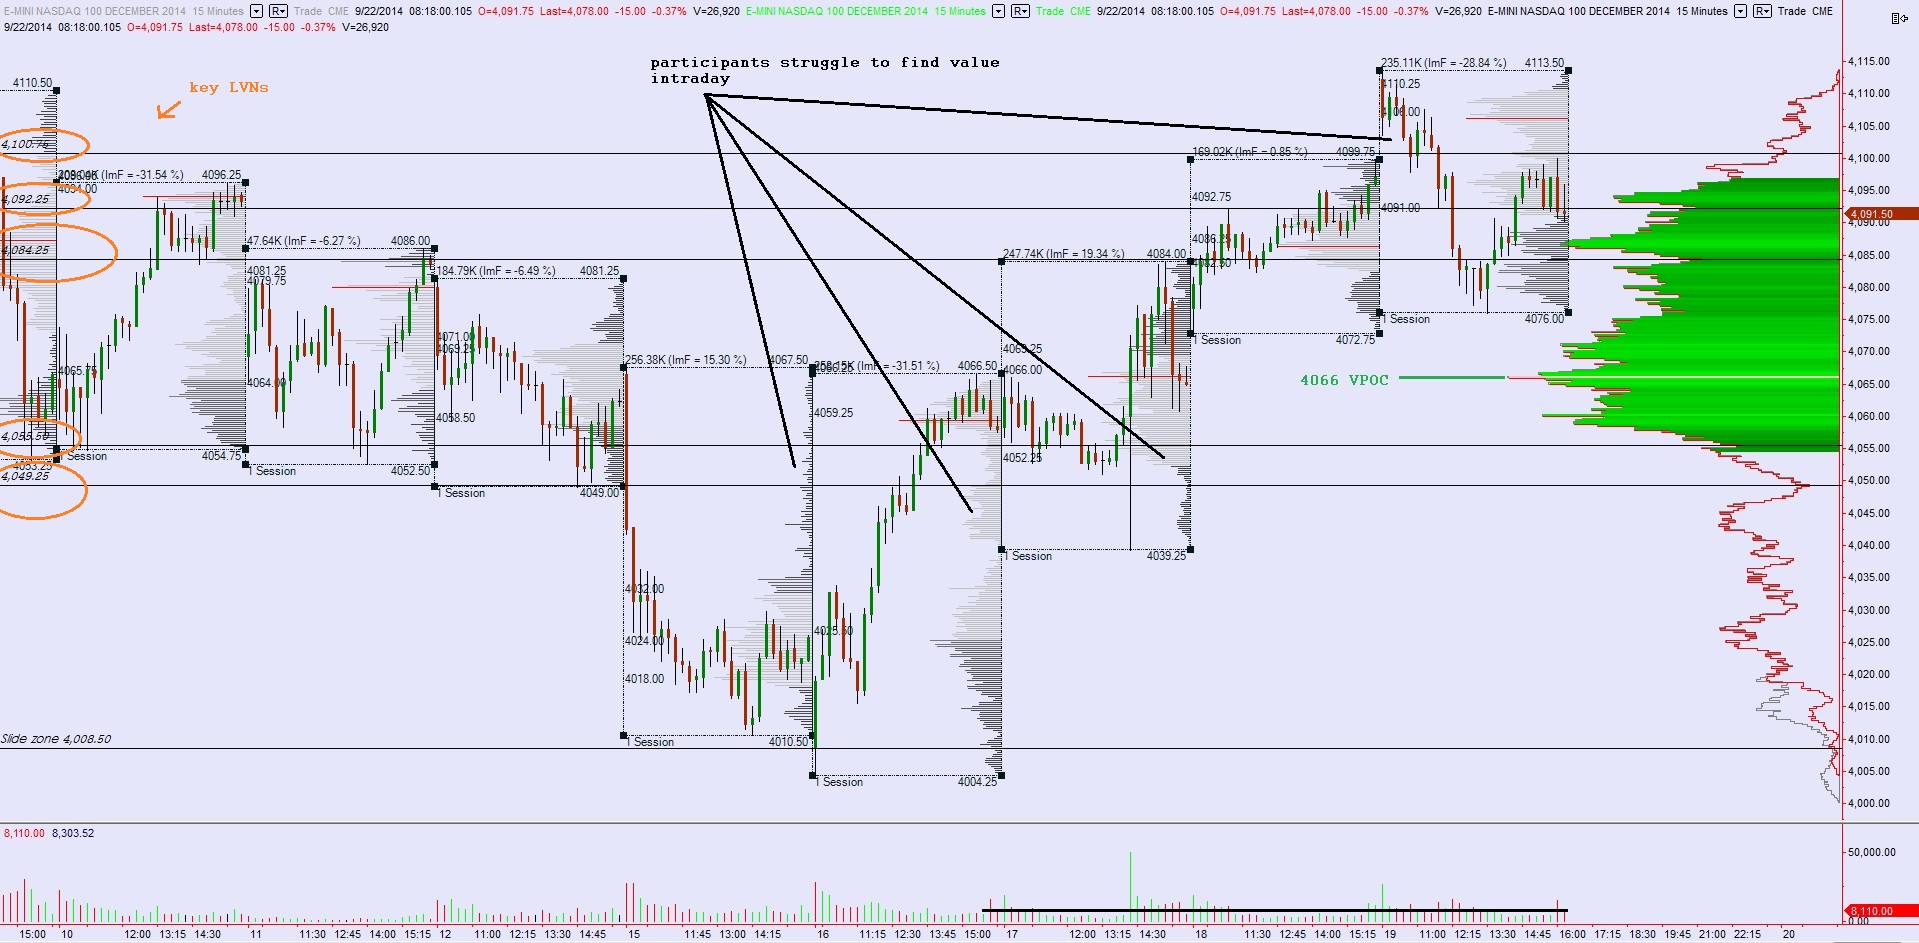
I love when rare events occur and yet receive no coverage in the financial media because it means I have something interesting to share with you. Yesterday the Nasdaq futures printed a ‘normal’ day-type which interestingly enough is anything but normal. There have only been 55 instances since July 2010 aka 95% of the time this type of day does not print. We have printed eleven such days in 2014. A normal day is classified as a day where no range extension occurs on either side of the initial balance. Its characteristics usually include an aggressive entrance into the early markets which stretches a wide initial balance which remains as the extremes for the duration of the session. We indeed printed an abnormal IB range yesterday. I have noted our range on the embedded chart inside the below chart, which highlights all prior normal days this year:
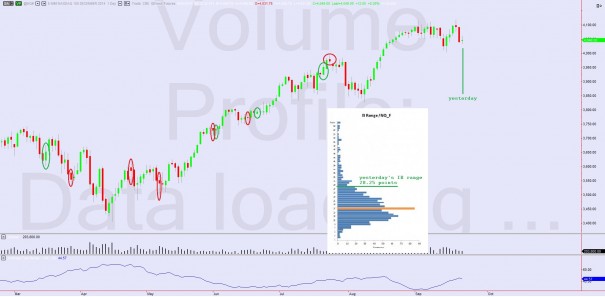
We cannot infer much information to aid in prediction using this fact, however we can examine the contextual powers at work. This is the story and we always want to read it as more information is made available. Lately this market has seen prices aggressively pushed around by other time frame participants. Their actions can be seen both on price bars and volume profile as long stretches of action with no respect for day trader levels (value areas, VPOCs, etc.) These higher time frame moves are motivated more by geopolitical events, macroeconomic data, or some other longer term perspective analysis. However yesterday, and to a certain extent Monday, we began seeing signs that the other time frame activity is abating. On Monday I actually split off most of the day’s profile from the initial balance because after the first hour of trade the market completely shifted its behavior. Pair that with yesterday’s big initial balance and you see what is occurring—early session OTF aggression but a market coming into balance.
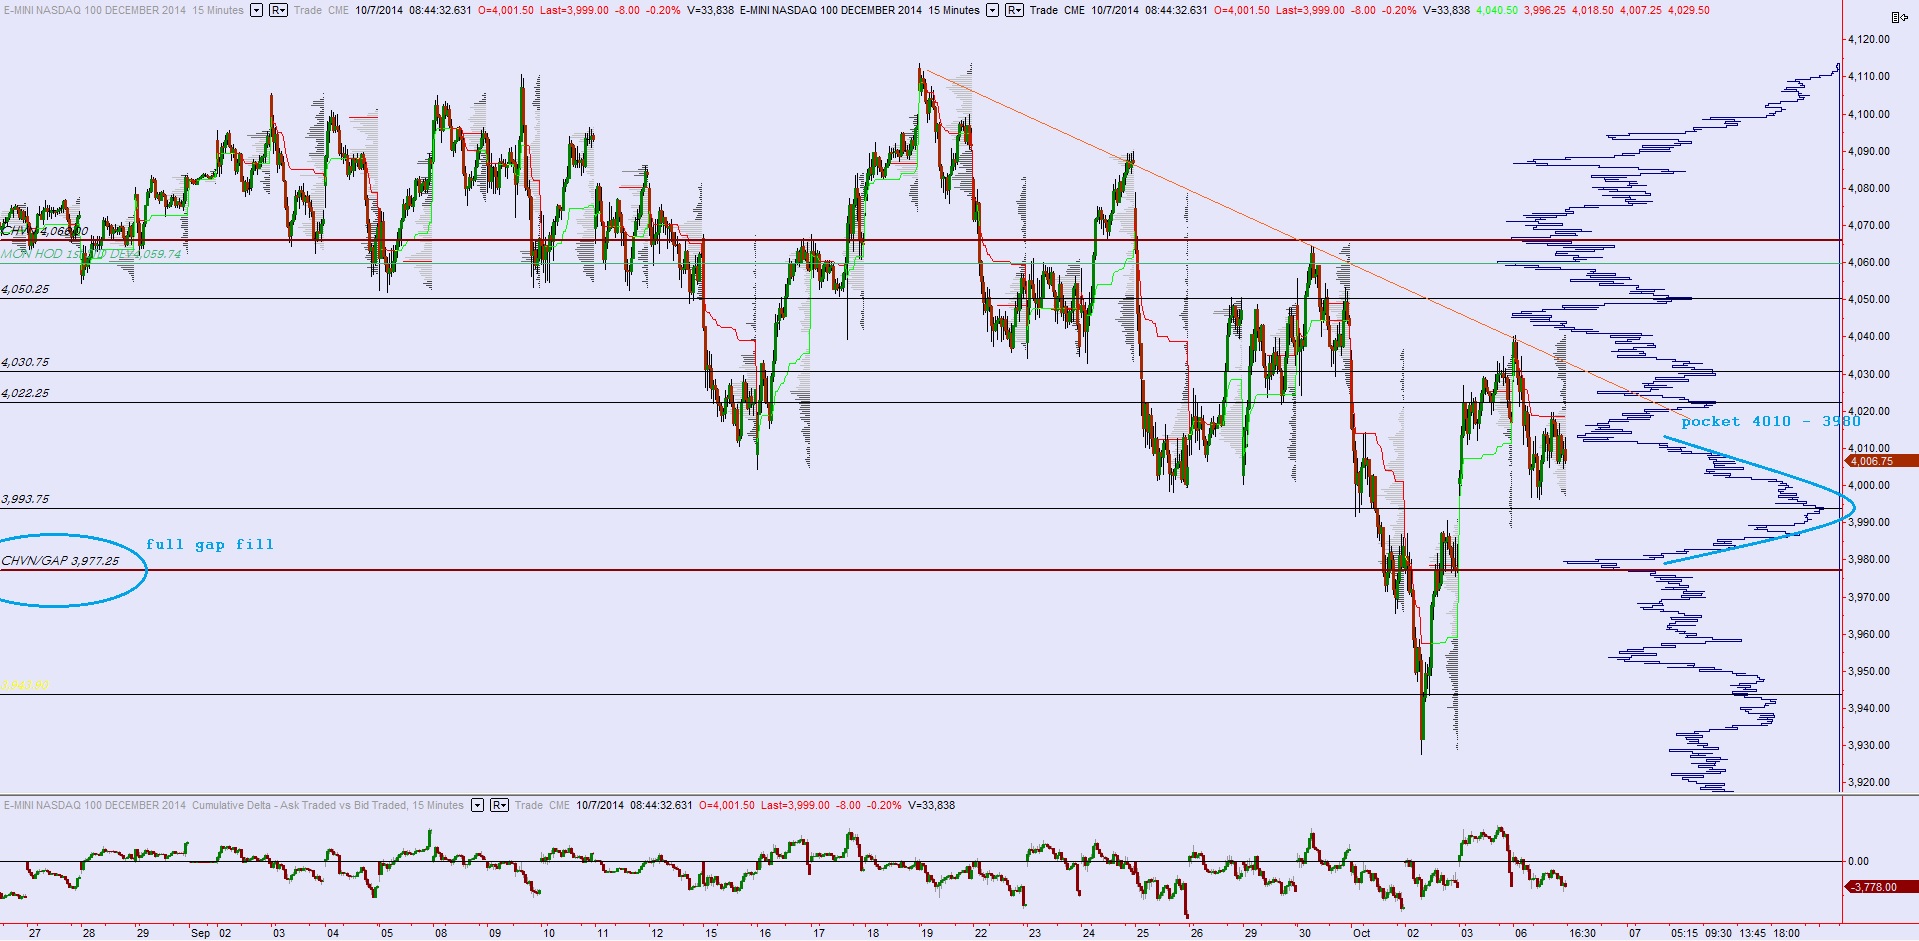
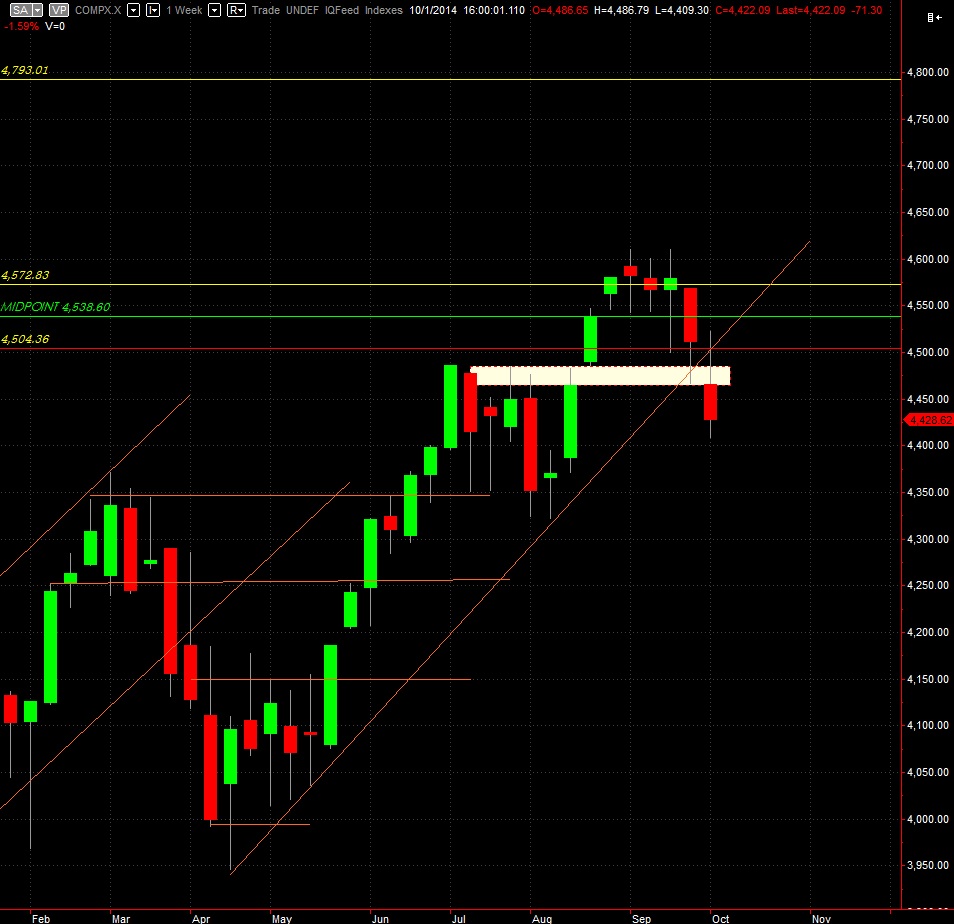
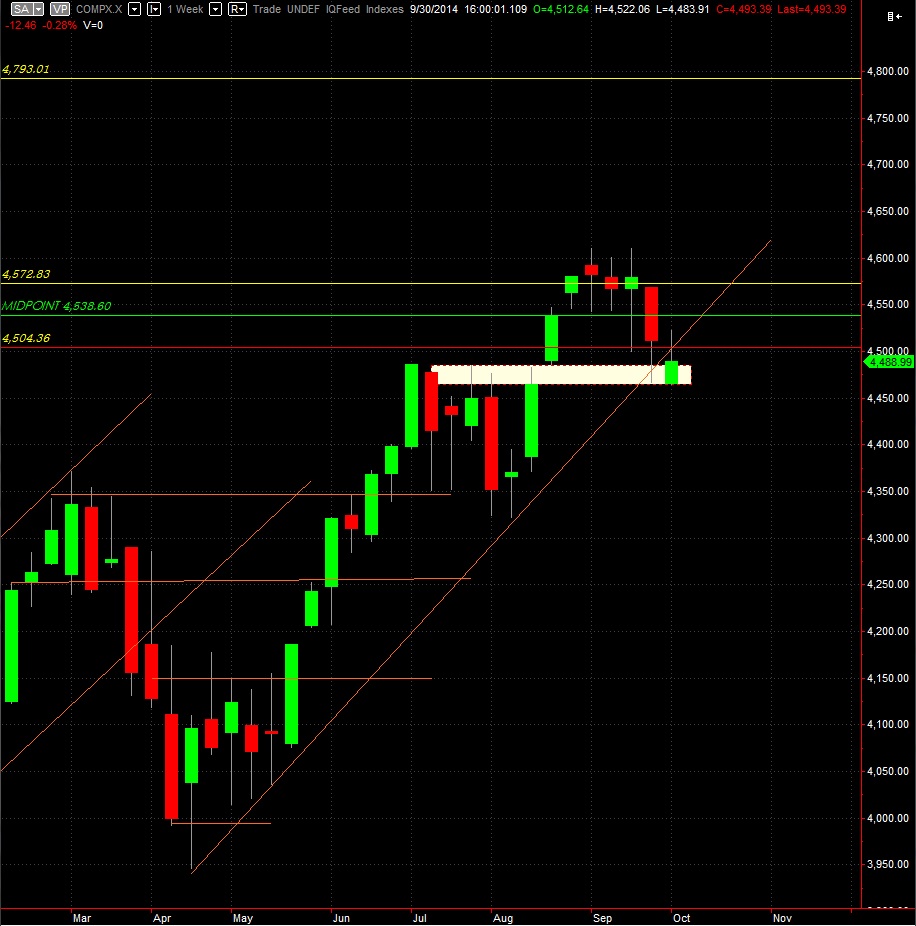
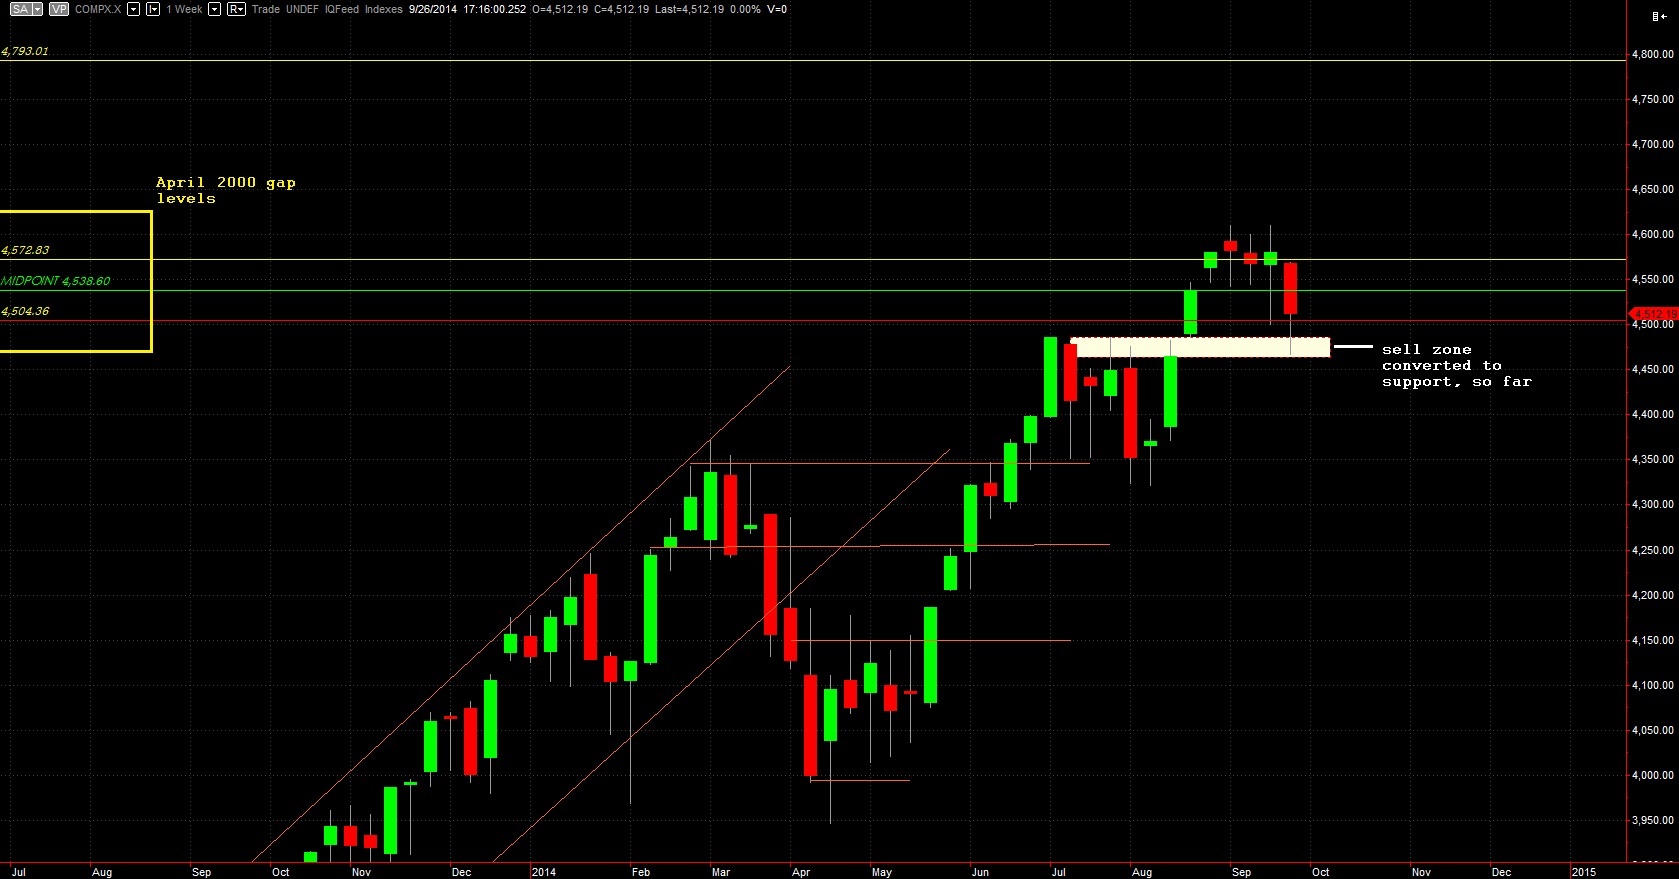
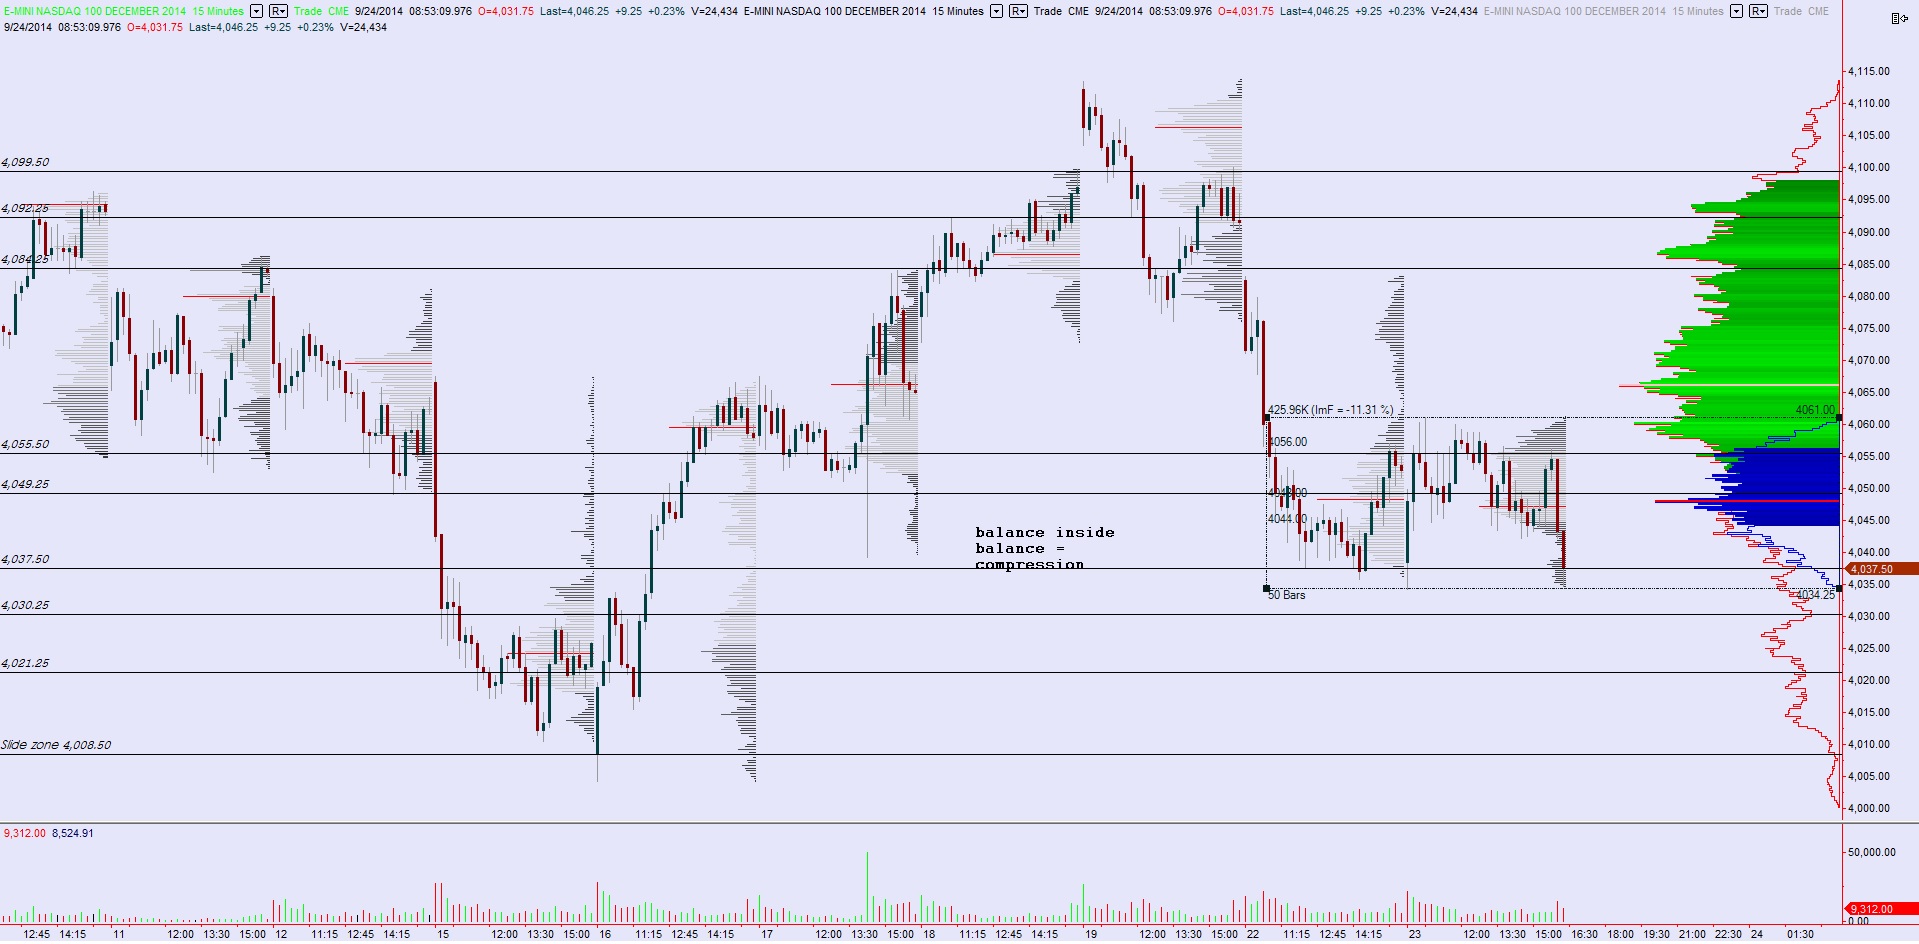
Even more interesting, this balance is forming inside a larger intermediate term balance which, as highlighted yesterday, needed some back-and-fill to properly form the symmetrical Gaussian curve.
I will stop here, for this is becoming too complex when in reality markets are very simple mechanisms for facilitating trade. We are doing a very good job of it inside of this intermediate term balance. If trade dries up on attempts lower, then we head higher to previous sources of liquidity.
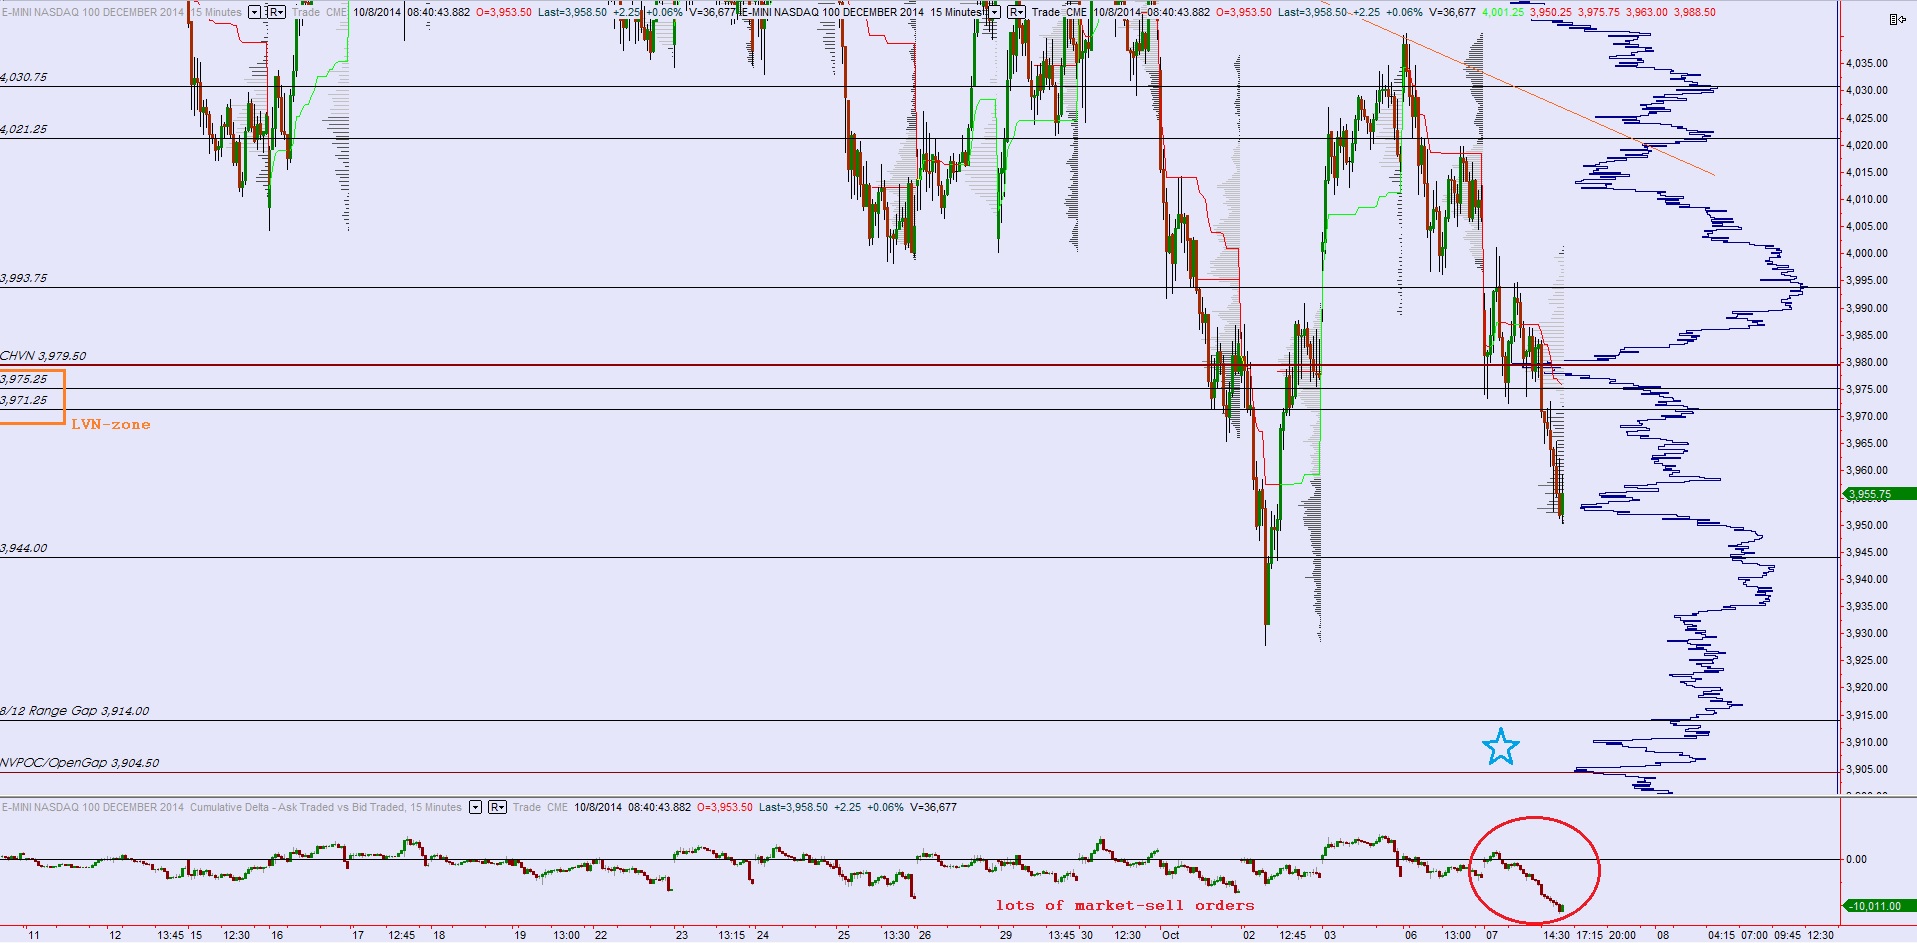
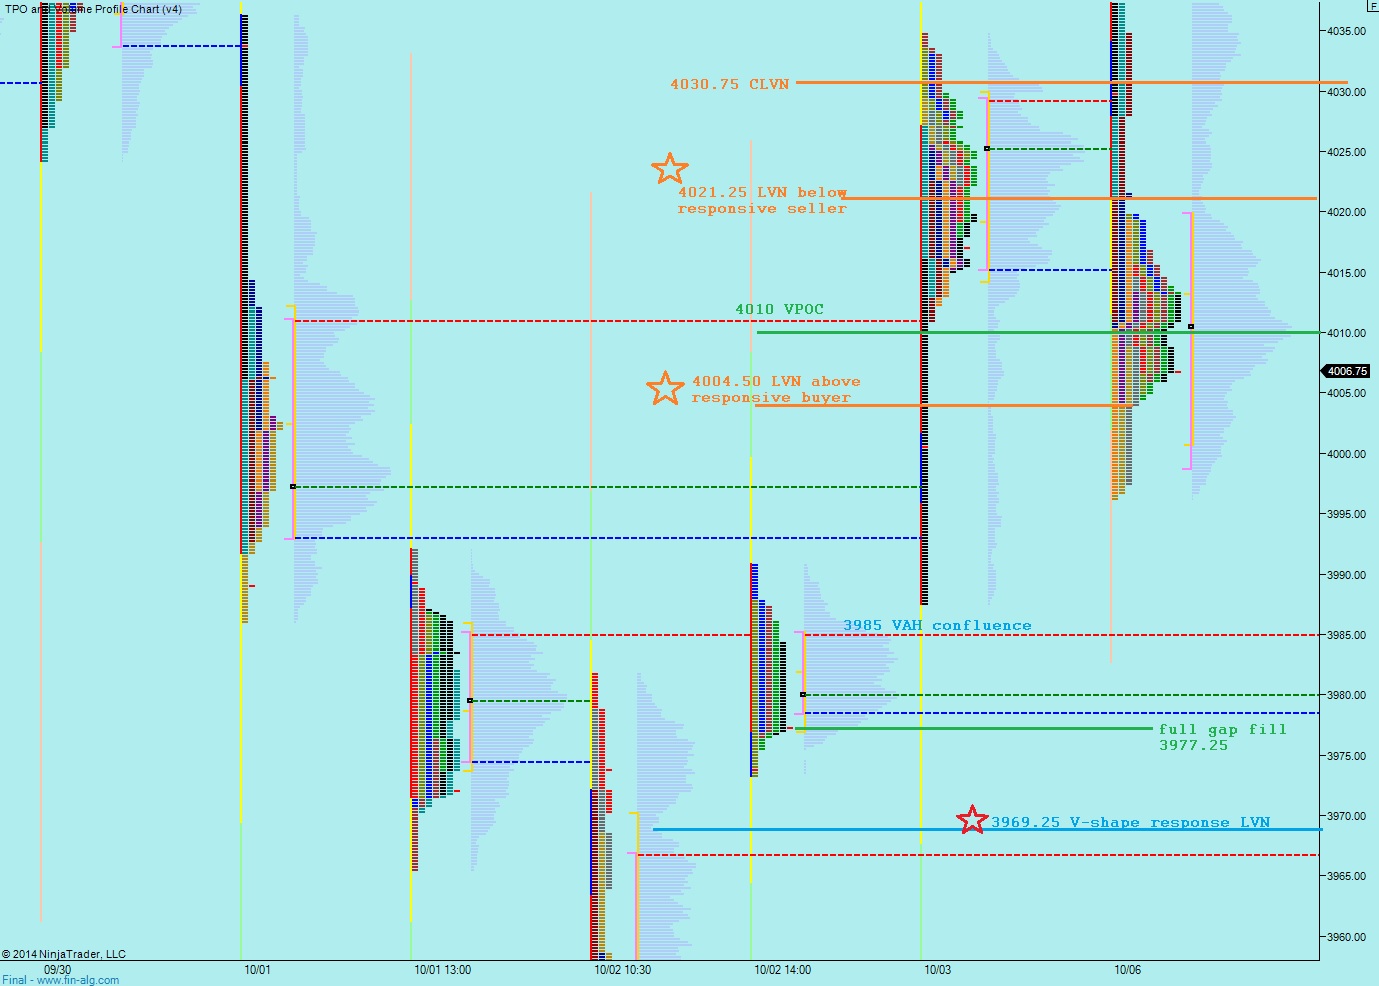
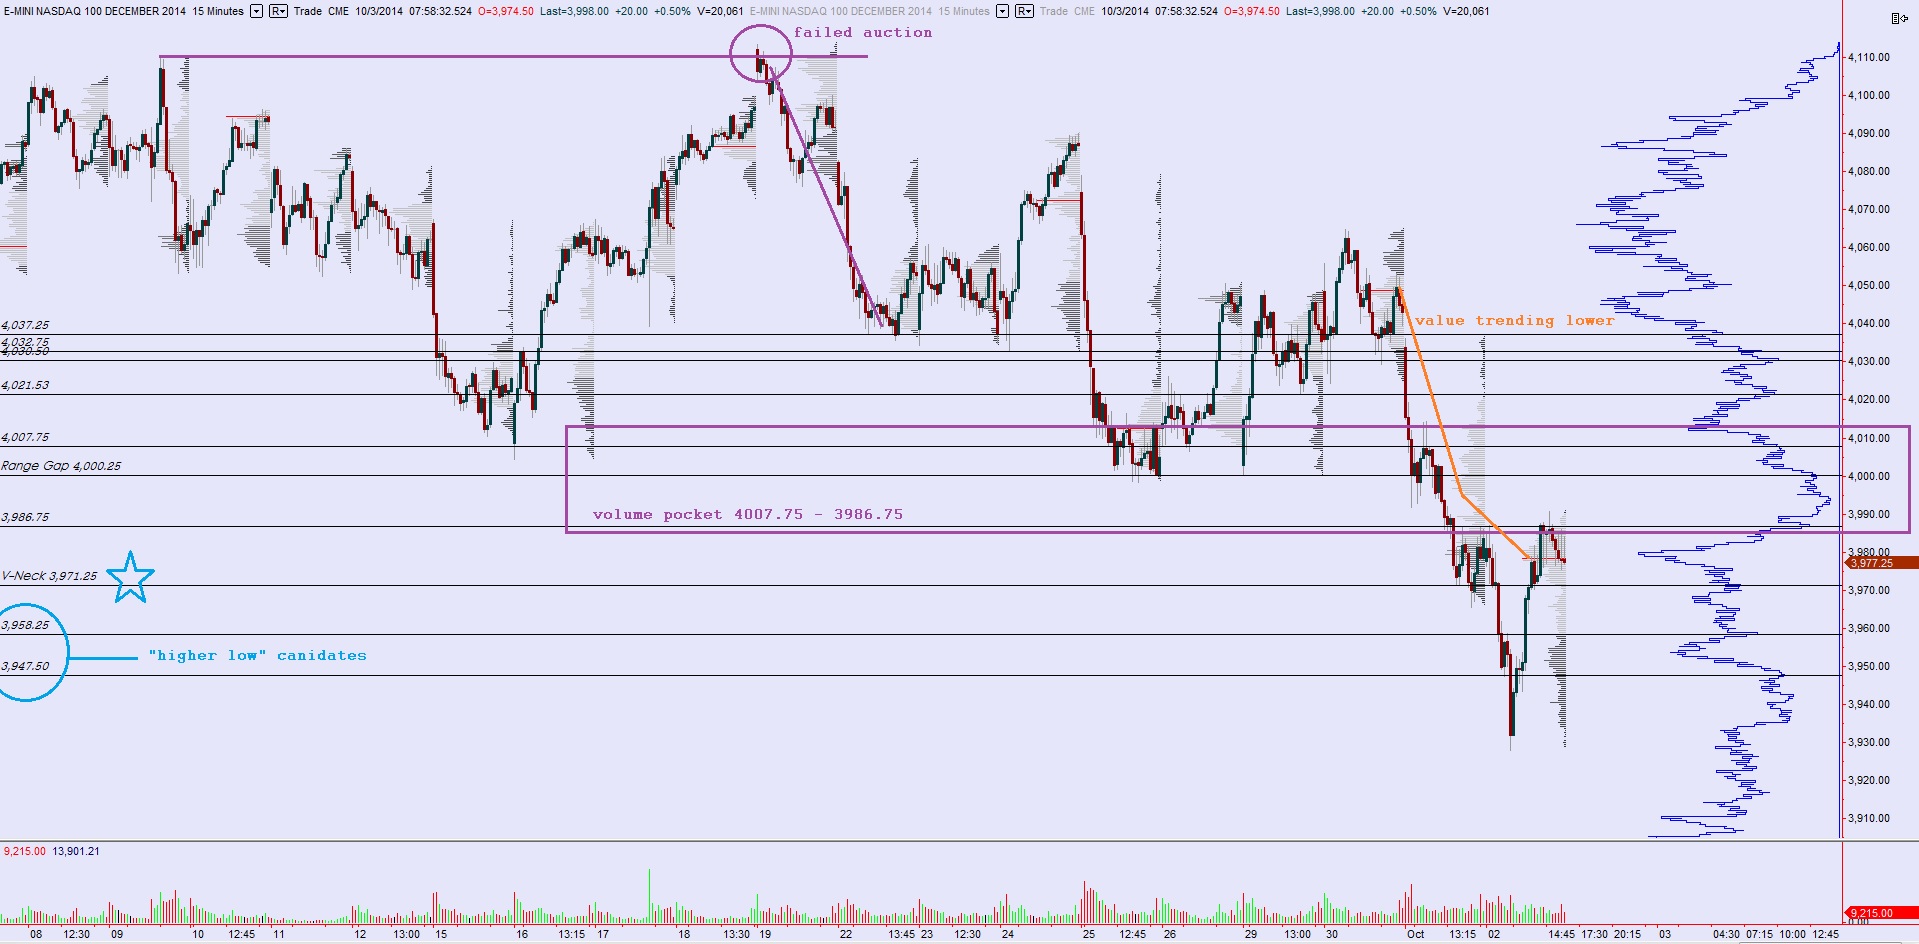
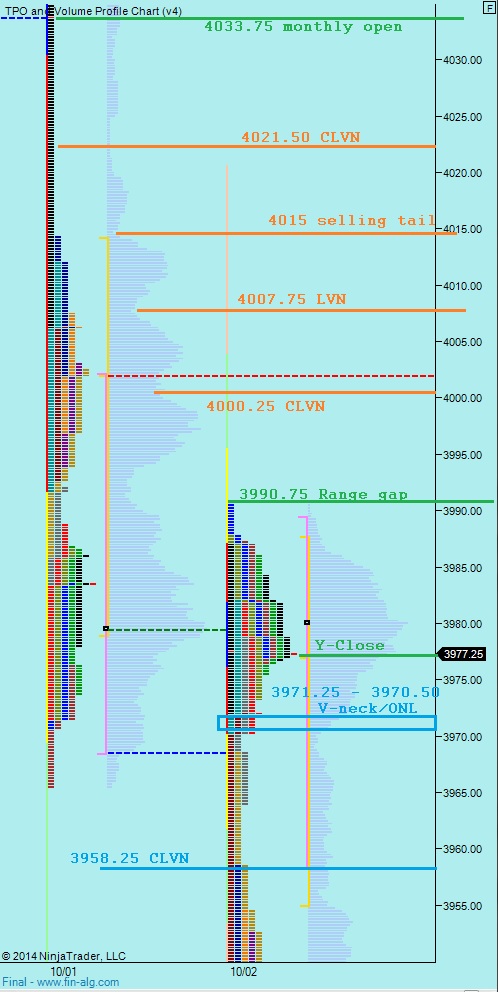
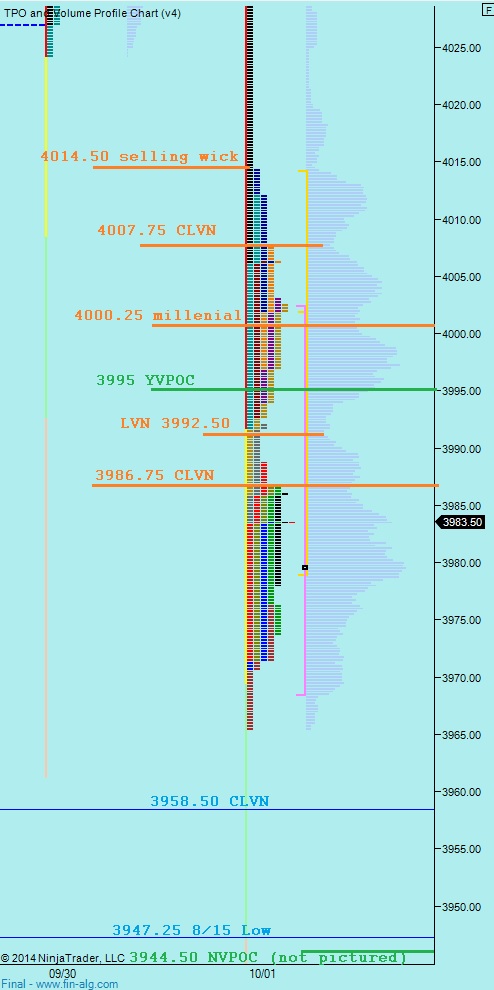
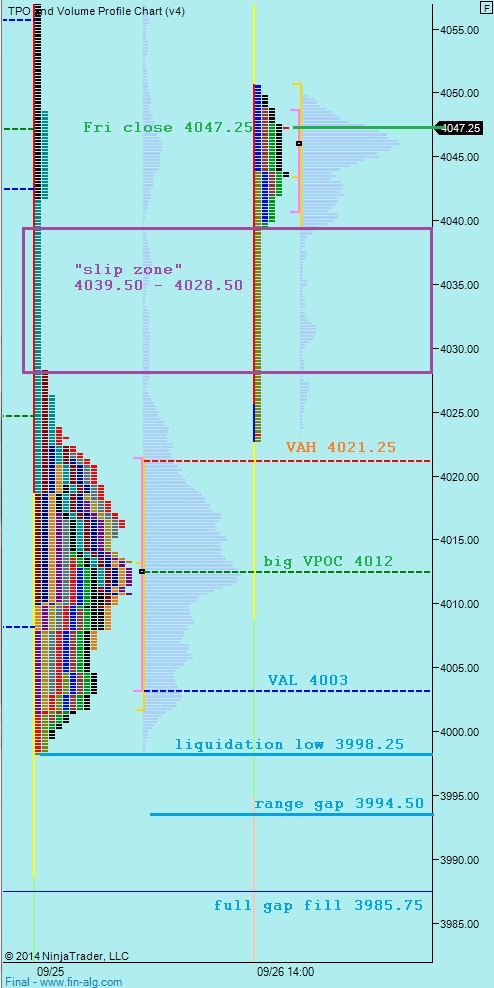
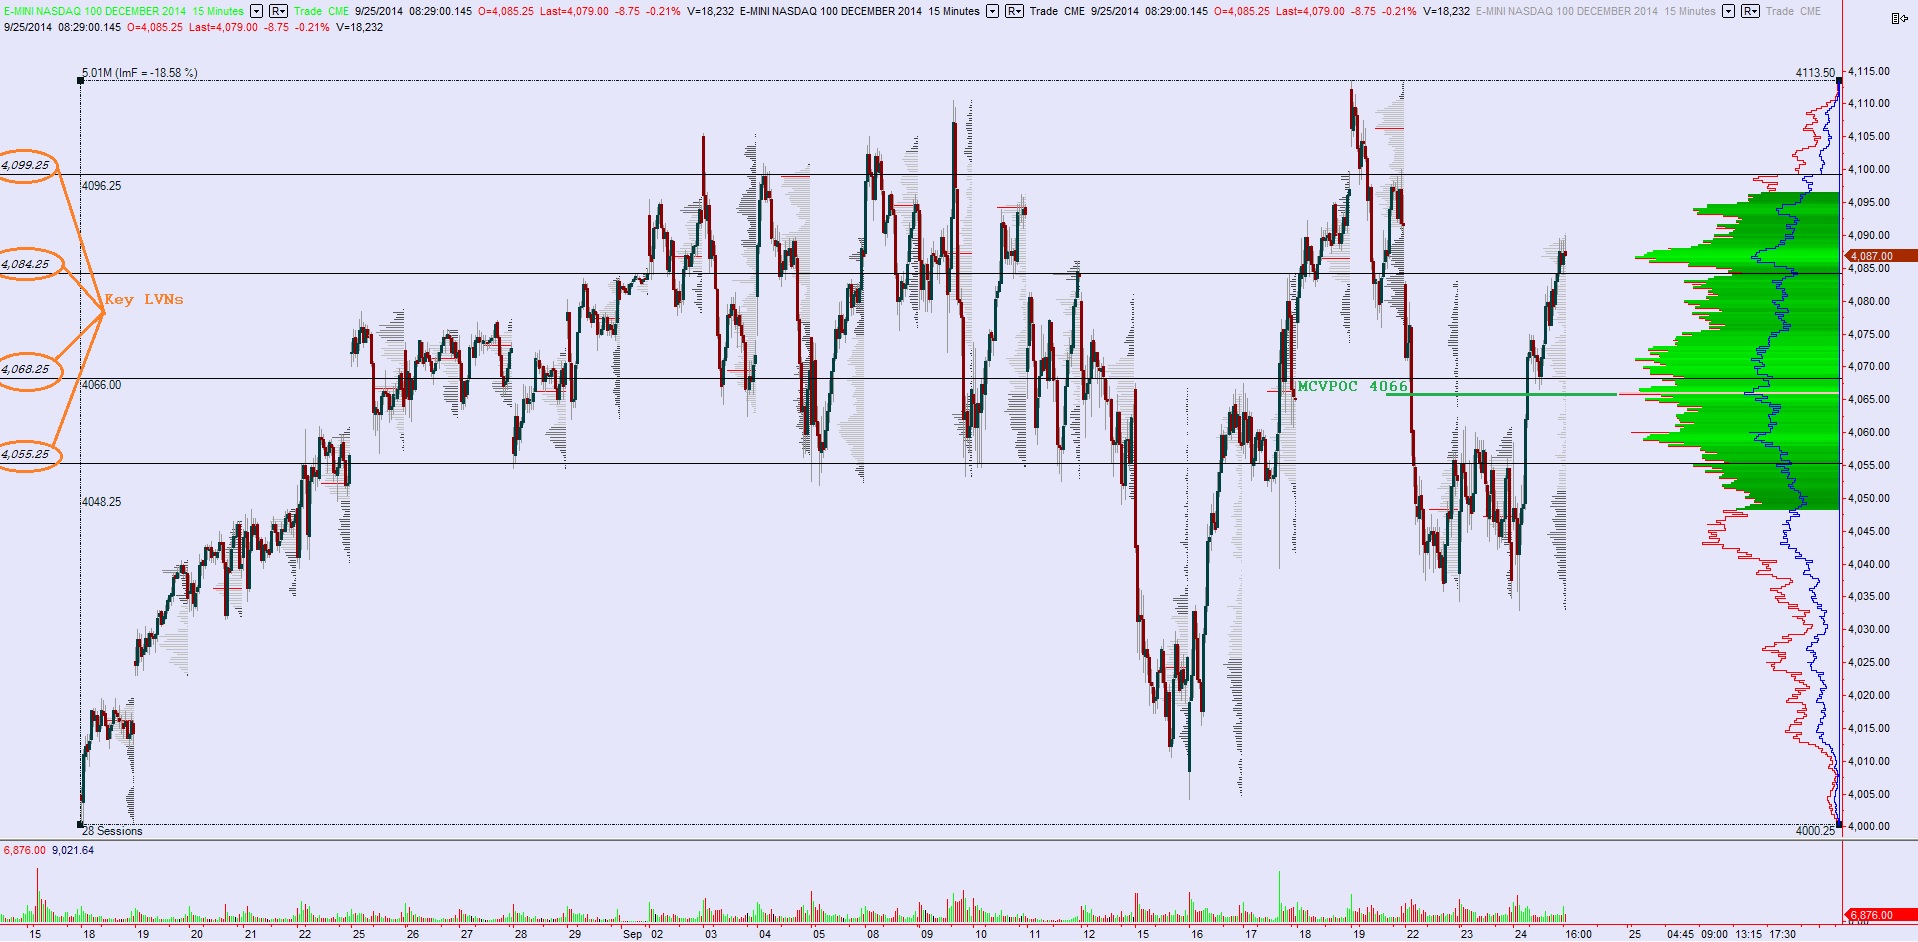
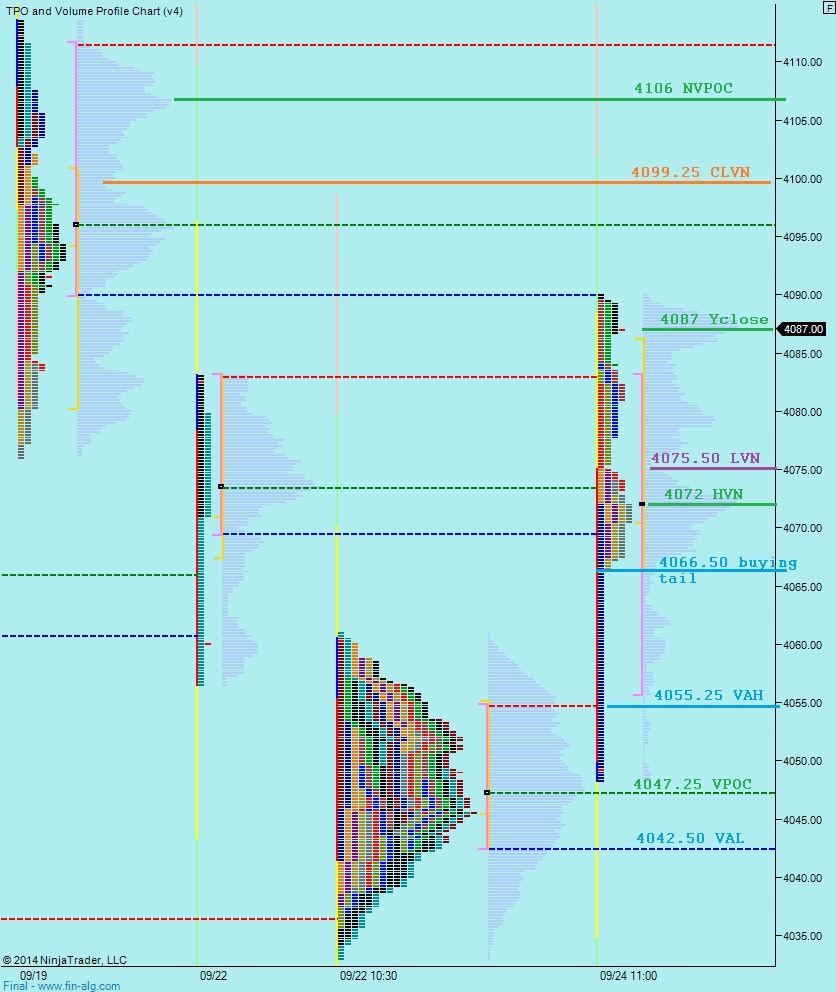
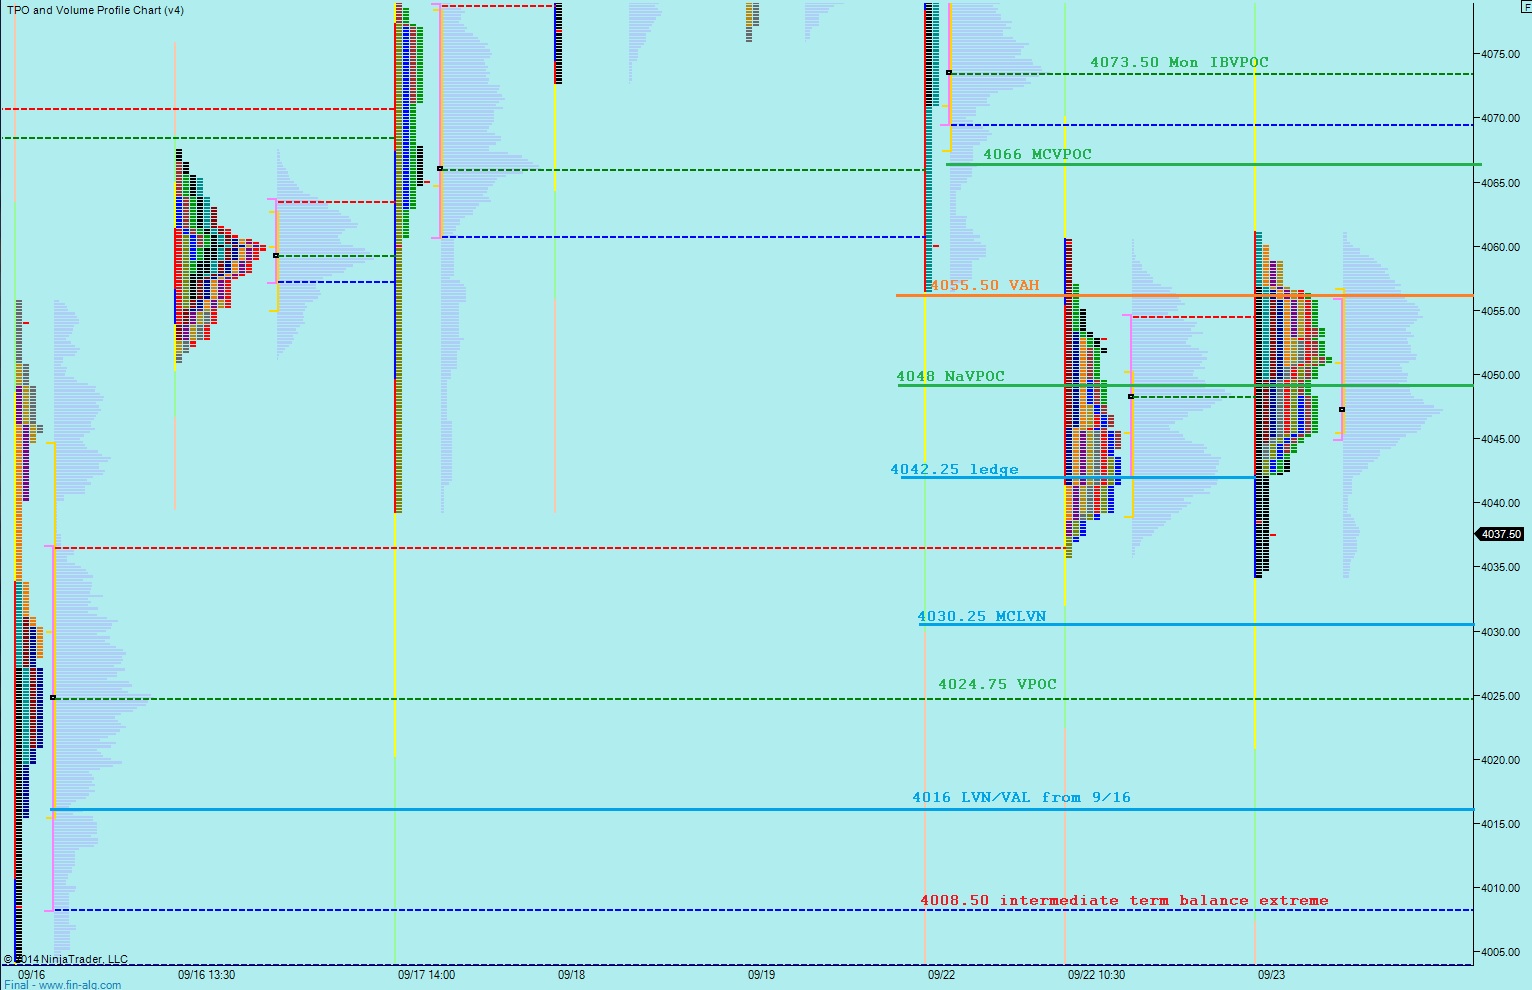
I have highlighted key intermediate term price levels on the following volume profile chart:

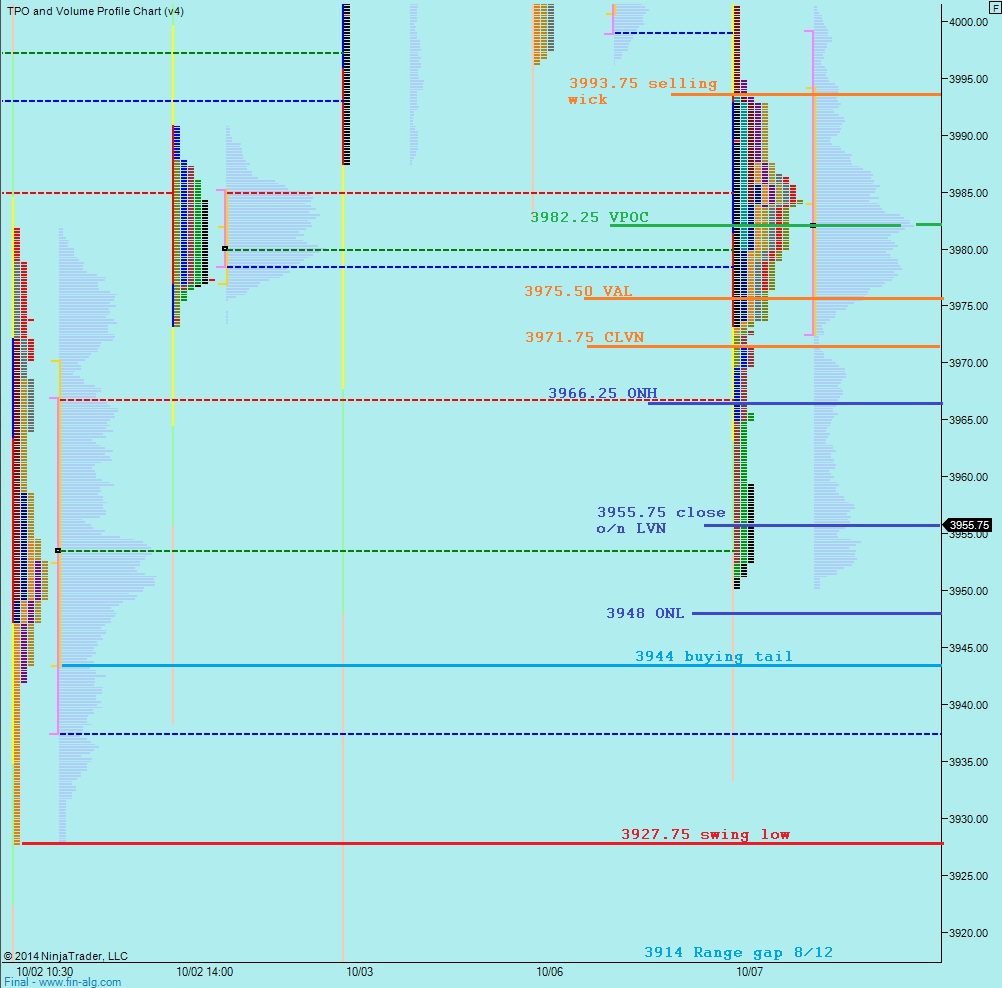
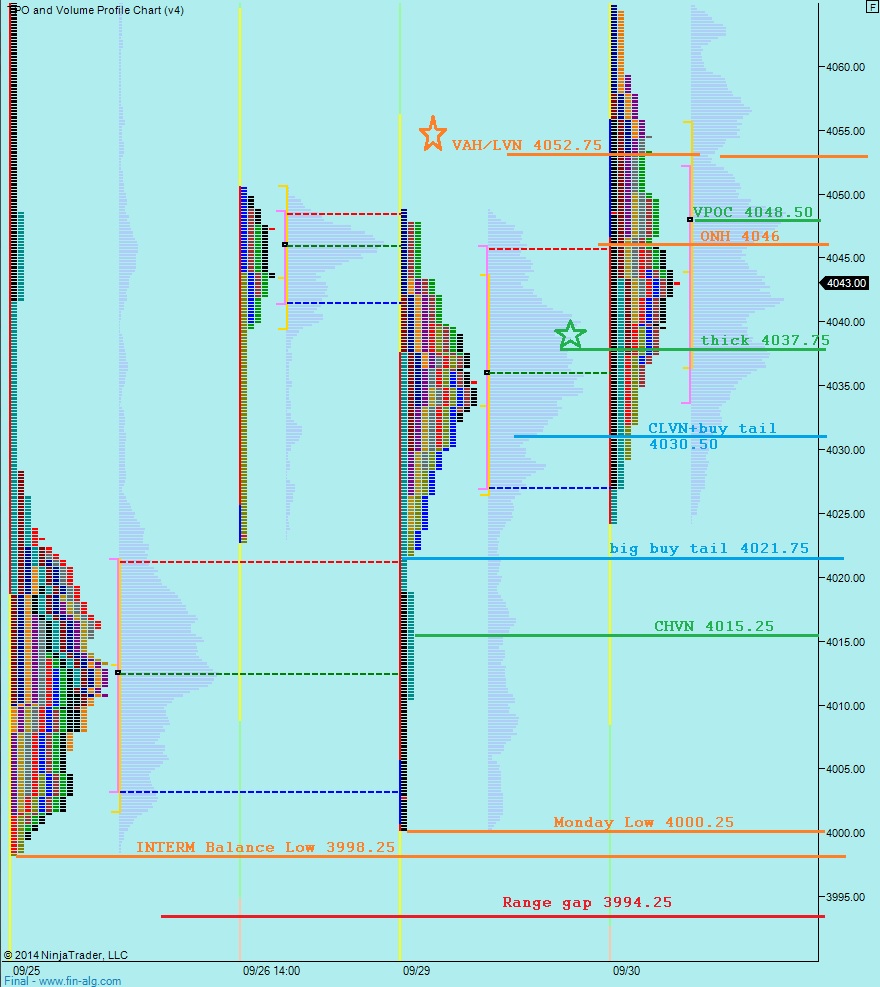
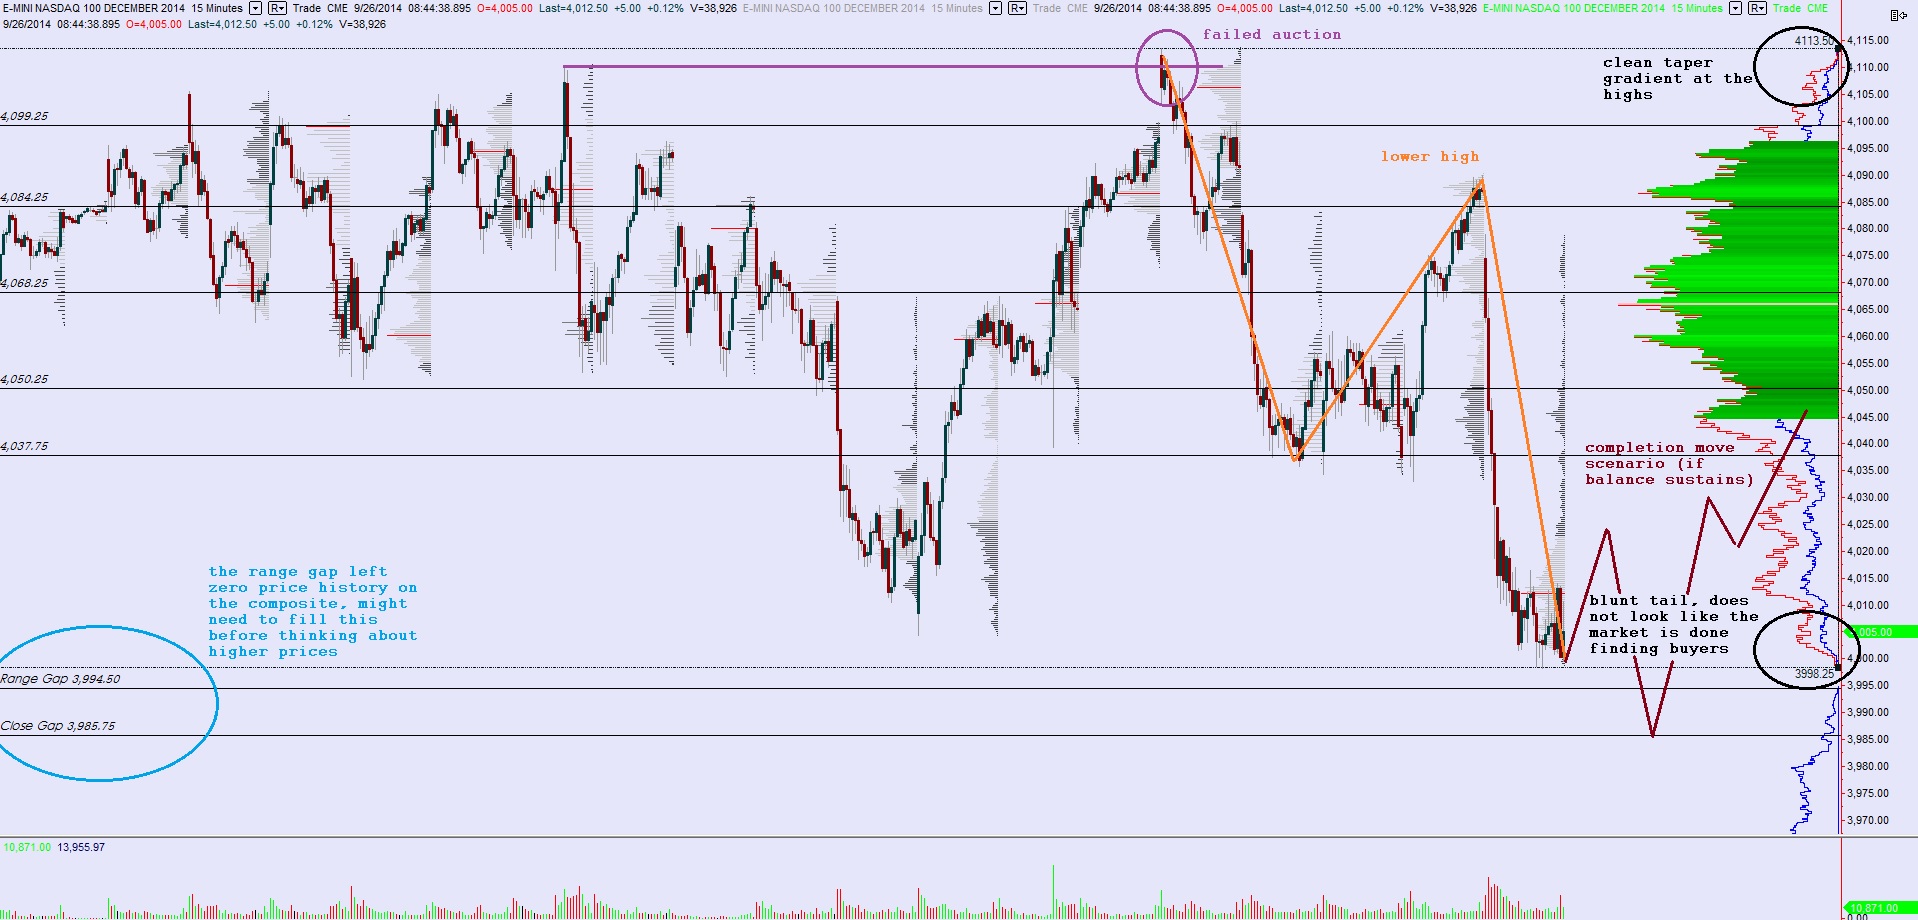
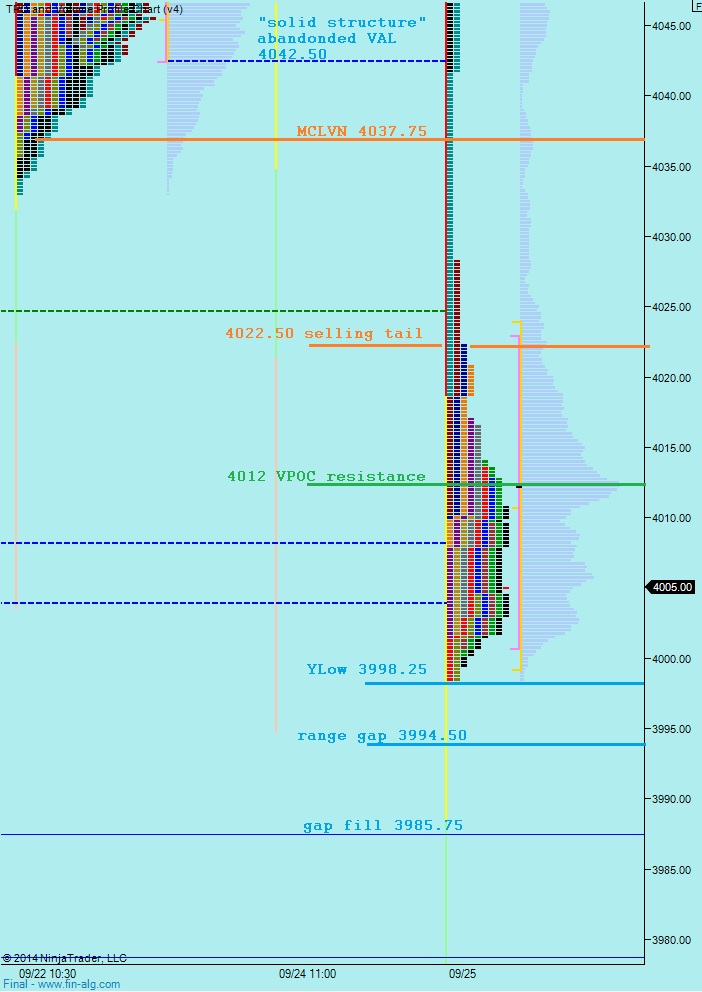
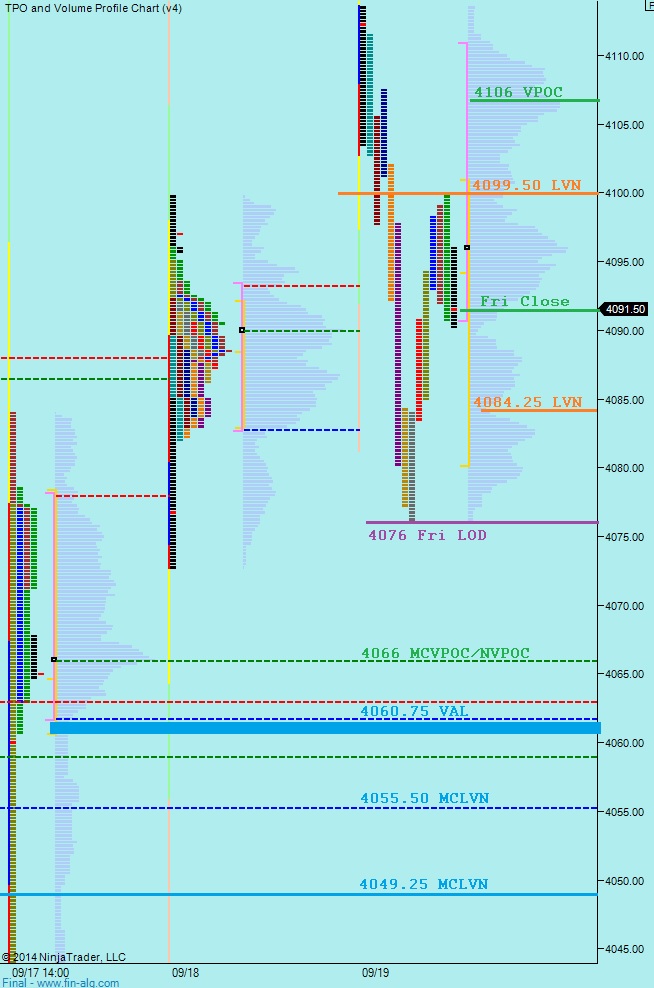
Finally and most actionable, I have marked up the market profile chart with the key levels I will be observing today. Also note, once the splits have been made to reveal the auction activity we printed an outside day yesterday:

Comments »