Futures traders had some action early this morning when equity futures abruptly fell out of balance and knifed lower. The wave of selling rolled in around 5am and it was soon met with responsive buying. The overnight profile shows no clean consensus on value and we are currently trading near unchanged in the NASDAQ.
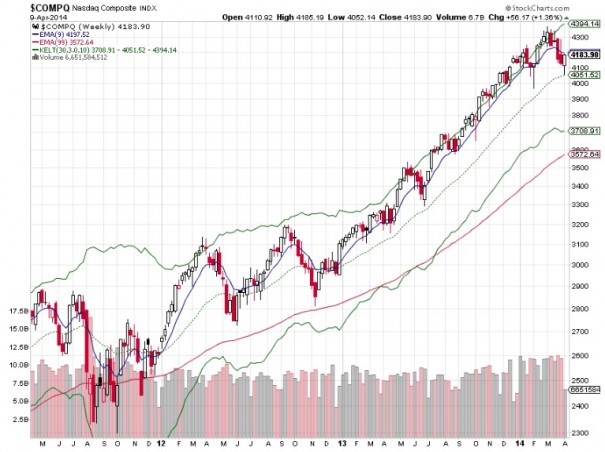
I will always buy the first test of my EMA if I feel the chart is still trending and the EMA resides at a higher low then our previous swing high (or lower high then our previous swing low). However, the buying is typically the easy part of this trade. Knowing whether the trend will resume or whether price will roll tide back is the management key. The very long term auction as seen on the weekly composite chart is still buyer controlled. We were buyers ahead of the 33 EMA which has now edged higher to touch the low print. Did you know moving averages move? See below:
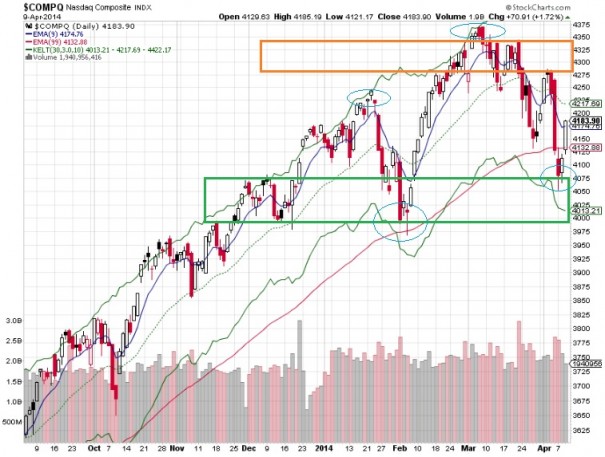
The daily chart which I most commonly refer to as the long term auction is no longer a clear picture of buyer control. Our EMAs are not in full alignment and our longest term EMA, the 99, is flat. We have also seen a pattern of lower highs and lows recently and it appears the long term timeframe is in balance. Now buyers and sellers must slug it out before one or the other becomes the clear controller of the long term auction. However, buyers have a slight control edge remaining (see blue circles on major swing levels). See below:
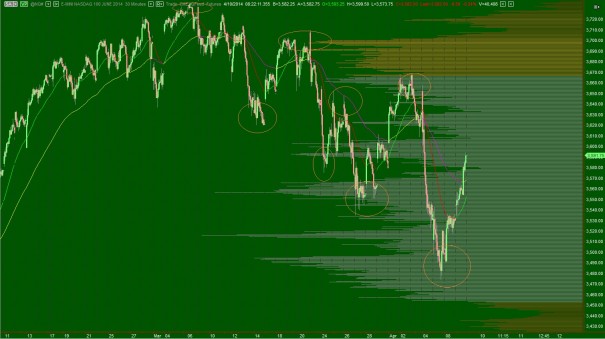
The intermediate timeframe is seller controlled. Their control can be seen as a series of lower highs and lows. Yesterday’s action was dynamic and powerful to the upside, but until we see a higher low printed, the sellers have the ability to assert control on this timeframe. I have removed all the lines I normally keep on this chart so we can more clearly view the seller control. There are some very interesting low volume nodes if you click and enlarge the chart, and these make great entry points because they often see “hot plate” type reactions:
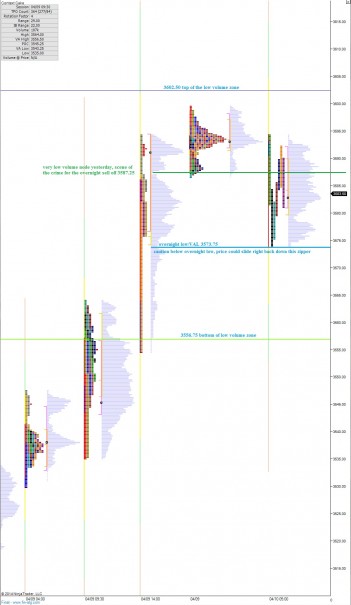
The short term auction is buyer controlled. This can be seen as a migration of value higher as well as strong responsive buying tails on the recent profiles. We are trading inside the price zone I highlighted yesterday as a low volume slip zone. This zone is so important. If buyers can finish trading up through it, and then gain acceptance via value up above 3602.25, this would translate well into gaining control of the intermediate term at best, putting the intermediate term auction into balance at the least. I have highlighted this interesting zone on the following market profile chart as well as a few other observations:
If you enjoy the content at iBankCoin, please follow us on Twitter


Hi Raul, I own TWTR for long term, expecting more down side coming with IPO expiration in May. I will add more then, but which price ??? Do you have any plan ? Appreciate.
I need to make a plan beyond it being one of my favorite services in the world