iBankCoin
I turn dials and fiddle with knobs to hone in on harmonic rotations
Joined Oct 26, 2011
4,121 Blog Posts

Little Glitch in The Matrix

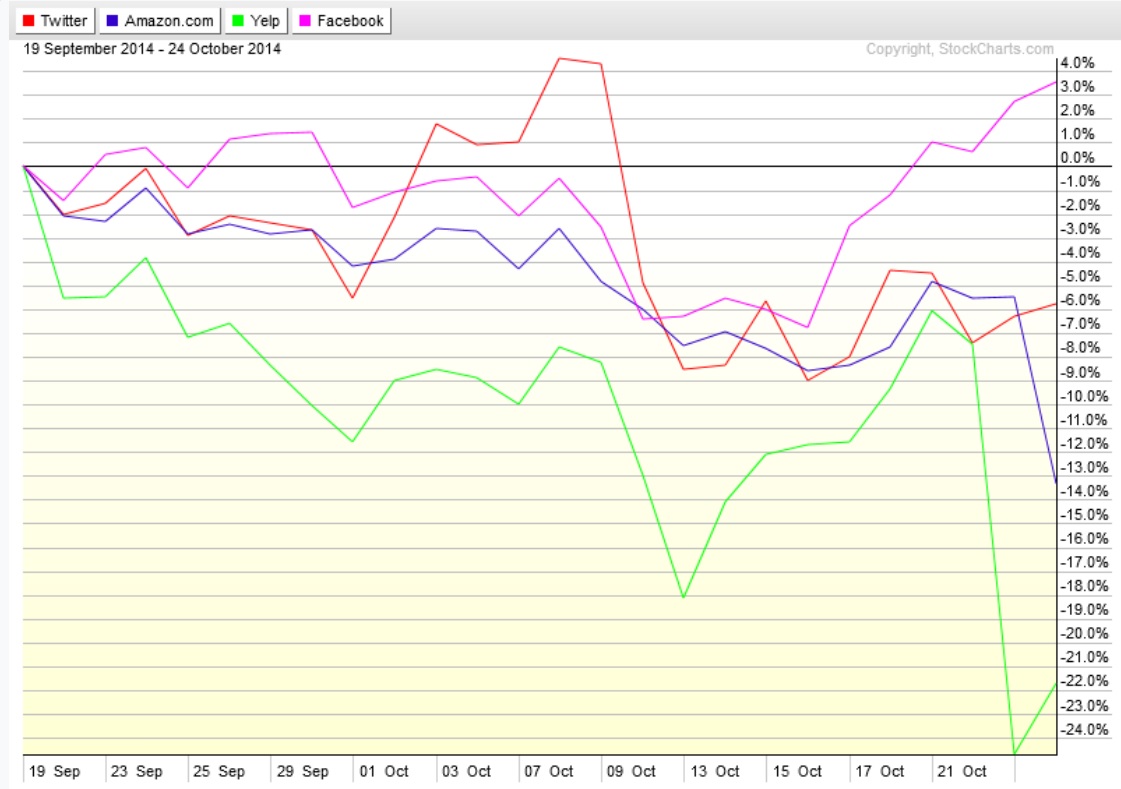
A discrepancy between the closing price and settlement price on the Nasdaq futures resulted in an odd no-volume push lower.  This may or may not have something to do with the big drop in Facebook shares after their earnings report motivated participants to sell the stock down significantly in after hours trade.  However, that action will slowly move to the back burner as we enter US trade.  Set for announcement this afternoon are several Fed data points.  We also have crude oil inventories at 10:30am.

The price spans our market has traversed lately are huge.  This is not an environment we have traded in, velocity and rotation size-wise, since perhaps 2011, more so like the 2009 bottom.  Put simply, the market is acting either like prior major bottoms or like an inflection point.  You can thus see how these recent events might be unsettling to speculators.  The directional ramifications these conditions typically preclude are major.

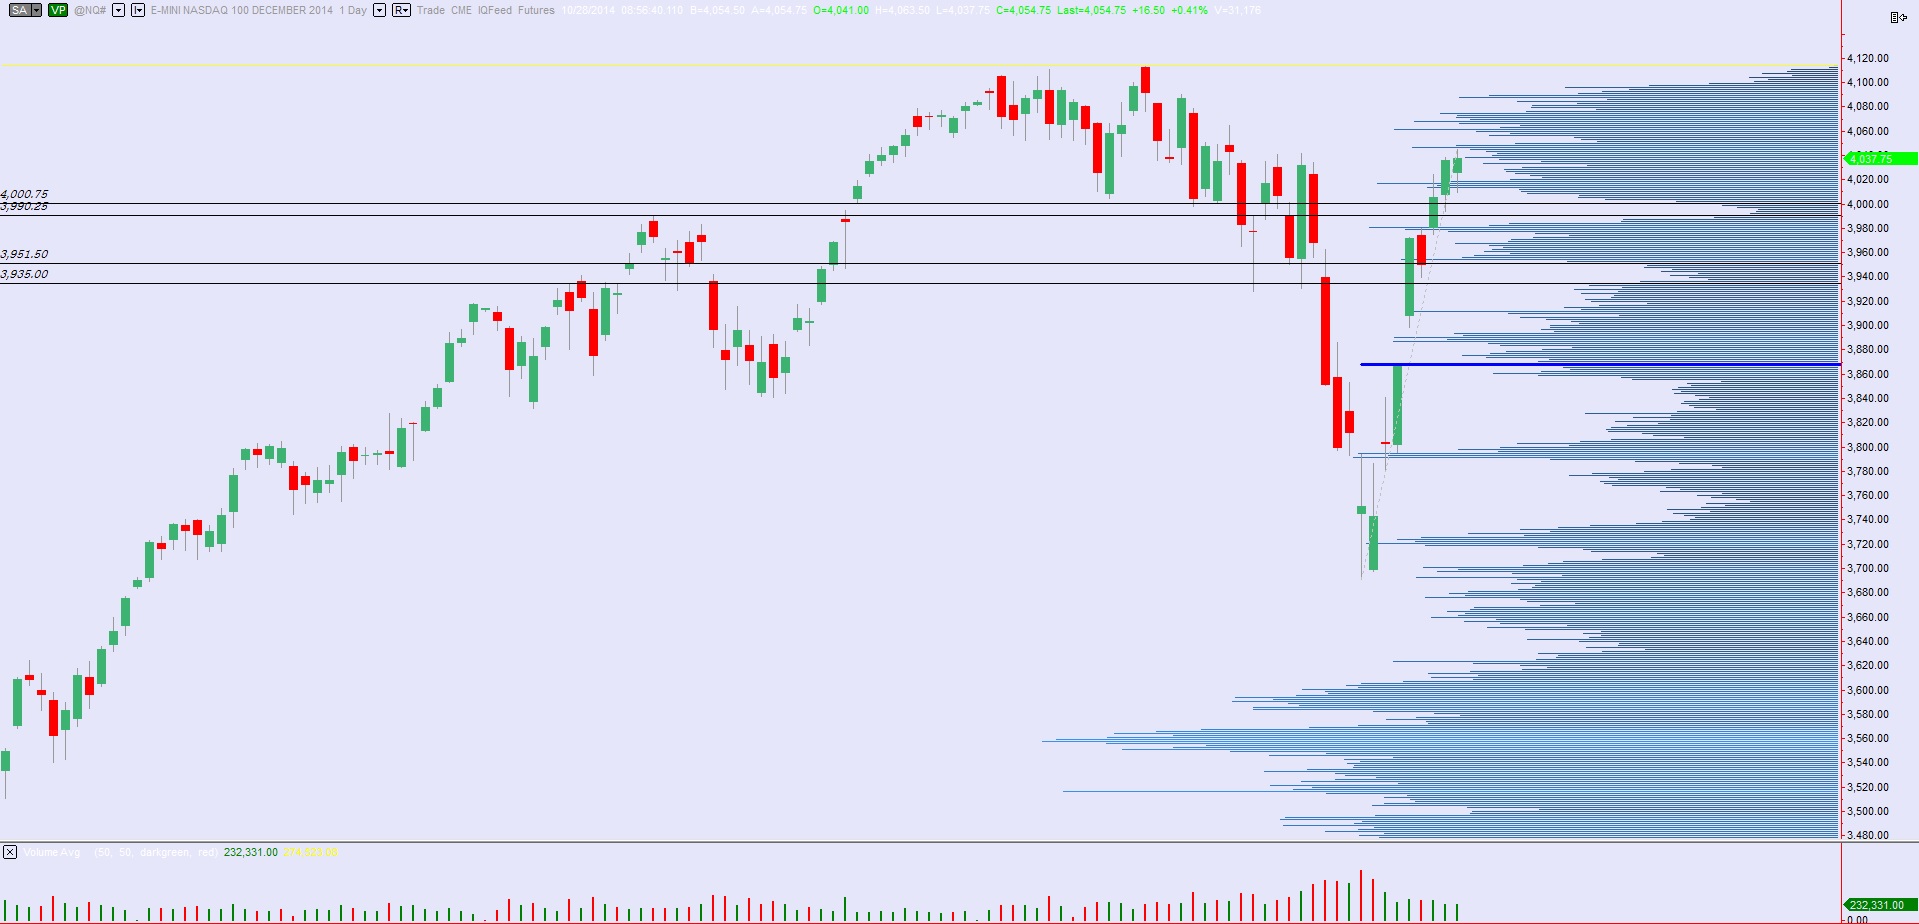
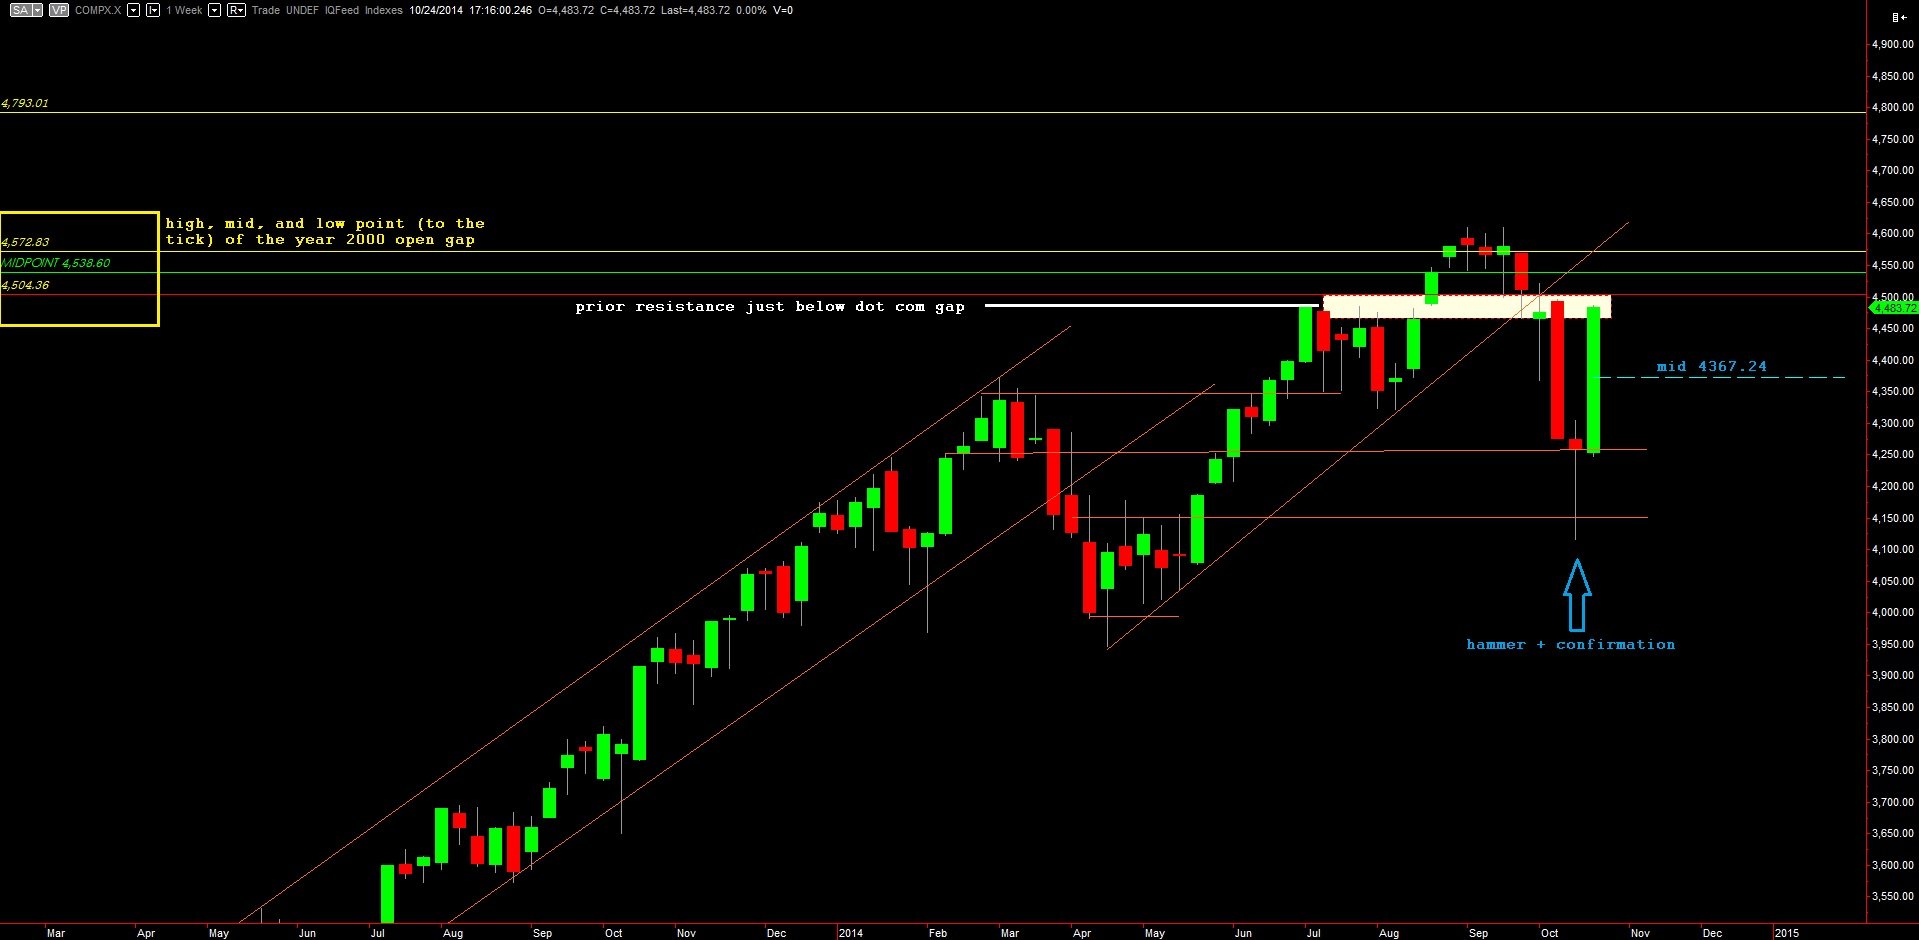
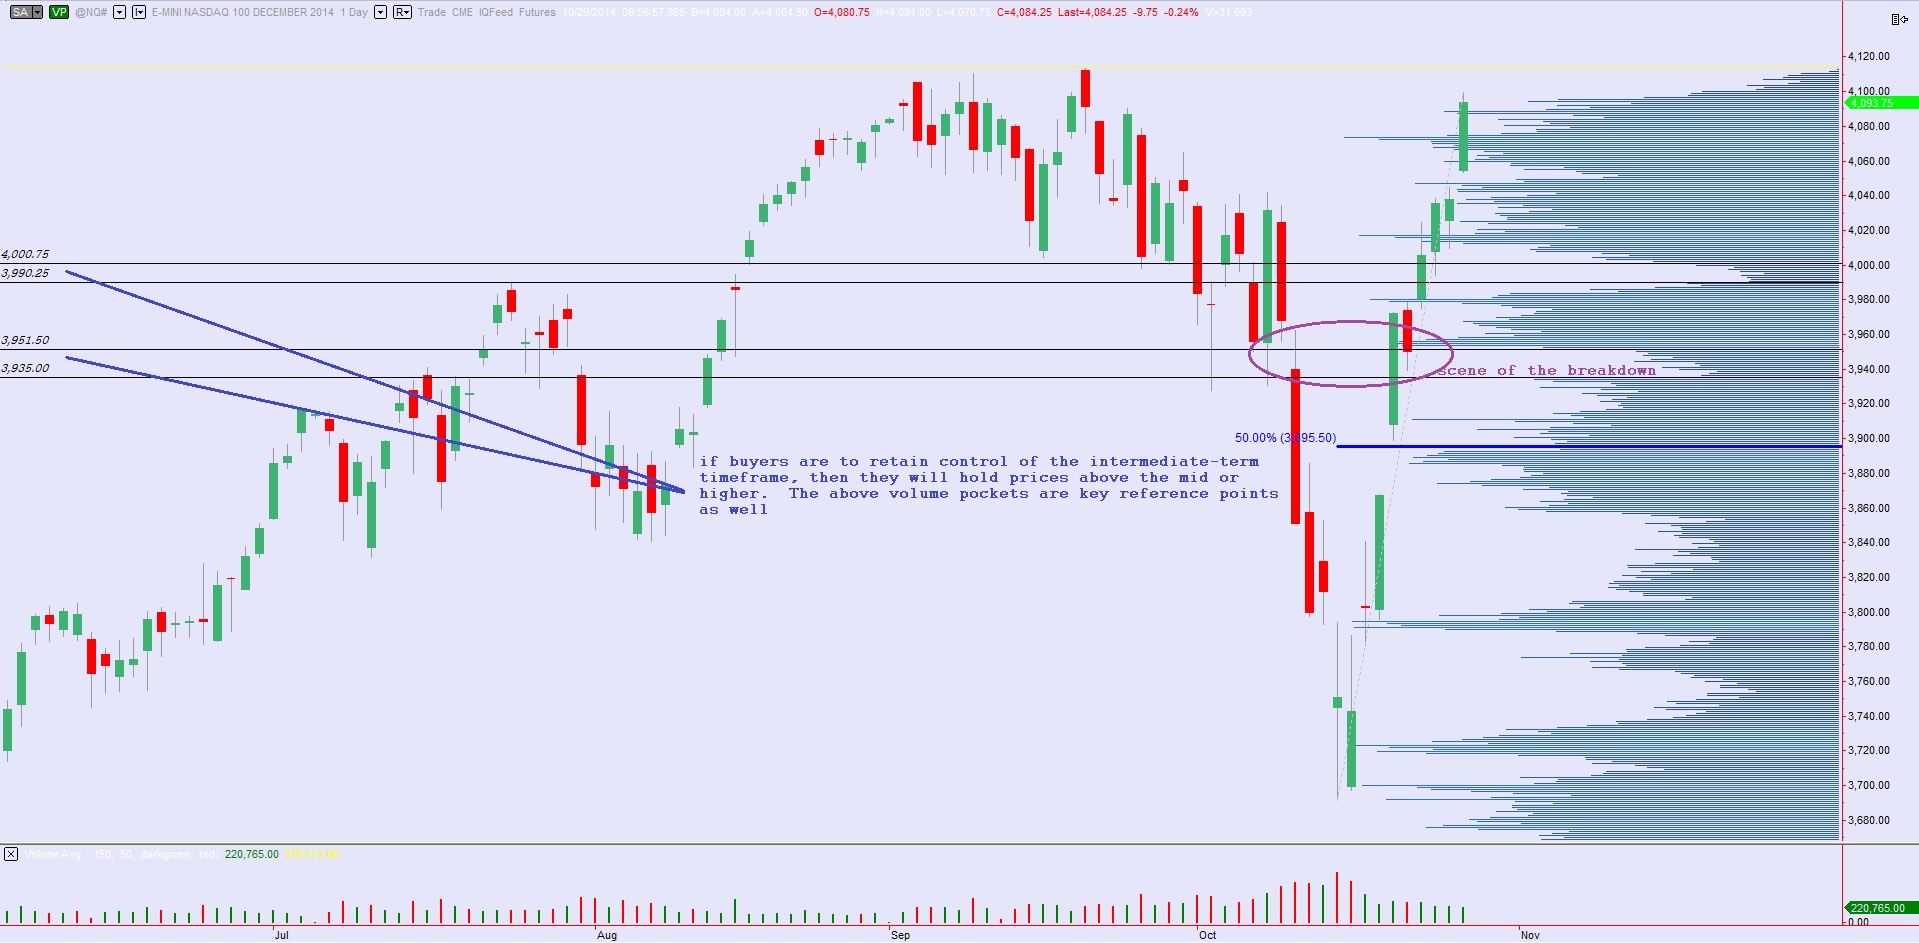
I am keeping my bias with the market’s biggest punch.  This is helps me accept conditions and adjust as the market dictates.  Currently, the uptrend is steep long term and the largest most recent rotation is up.  There are warning signs around, but I will reserve caution for when I have proof in the price action that sellers are regaining an edge.  What are my clues?  Retracements, especially the 50 percent retracement.  I have noted the 50% retracement as well as a few other observations on the following daily bar chart of the Nasdaq futures:

10292014_daily_NQ

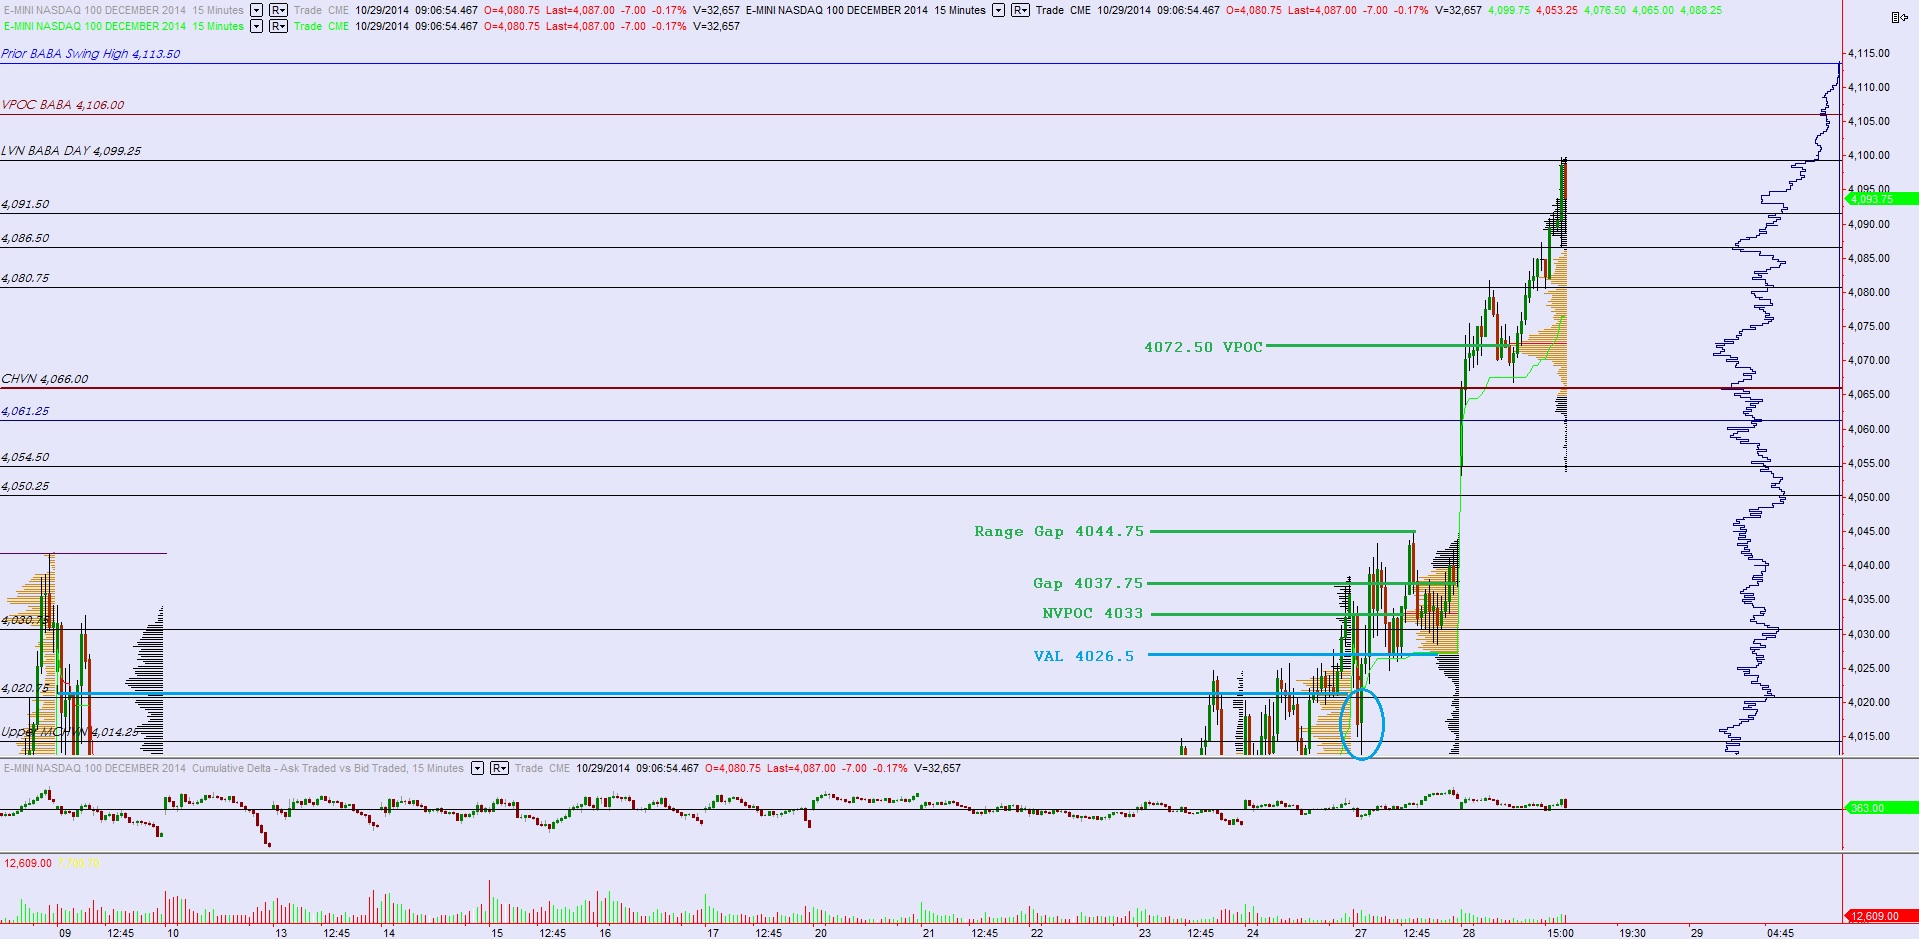
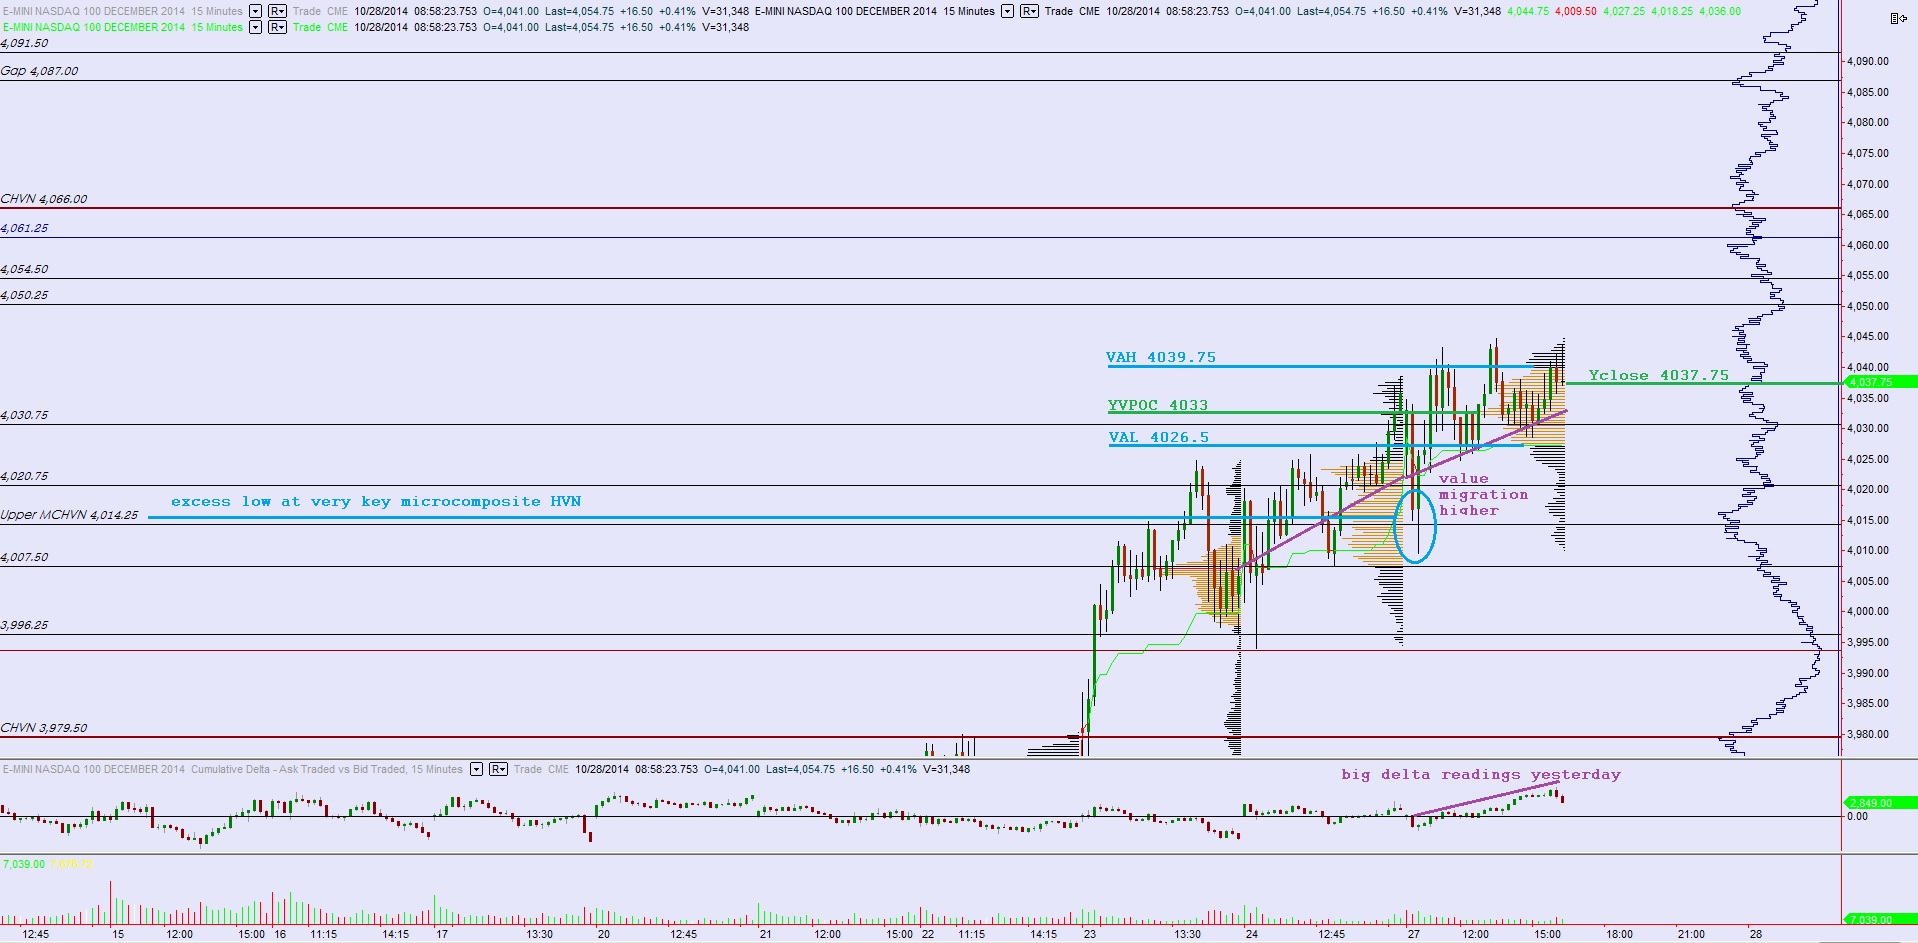
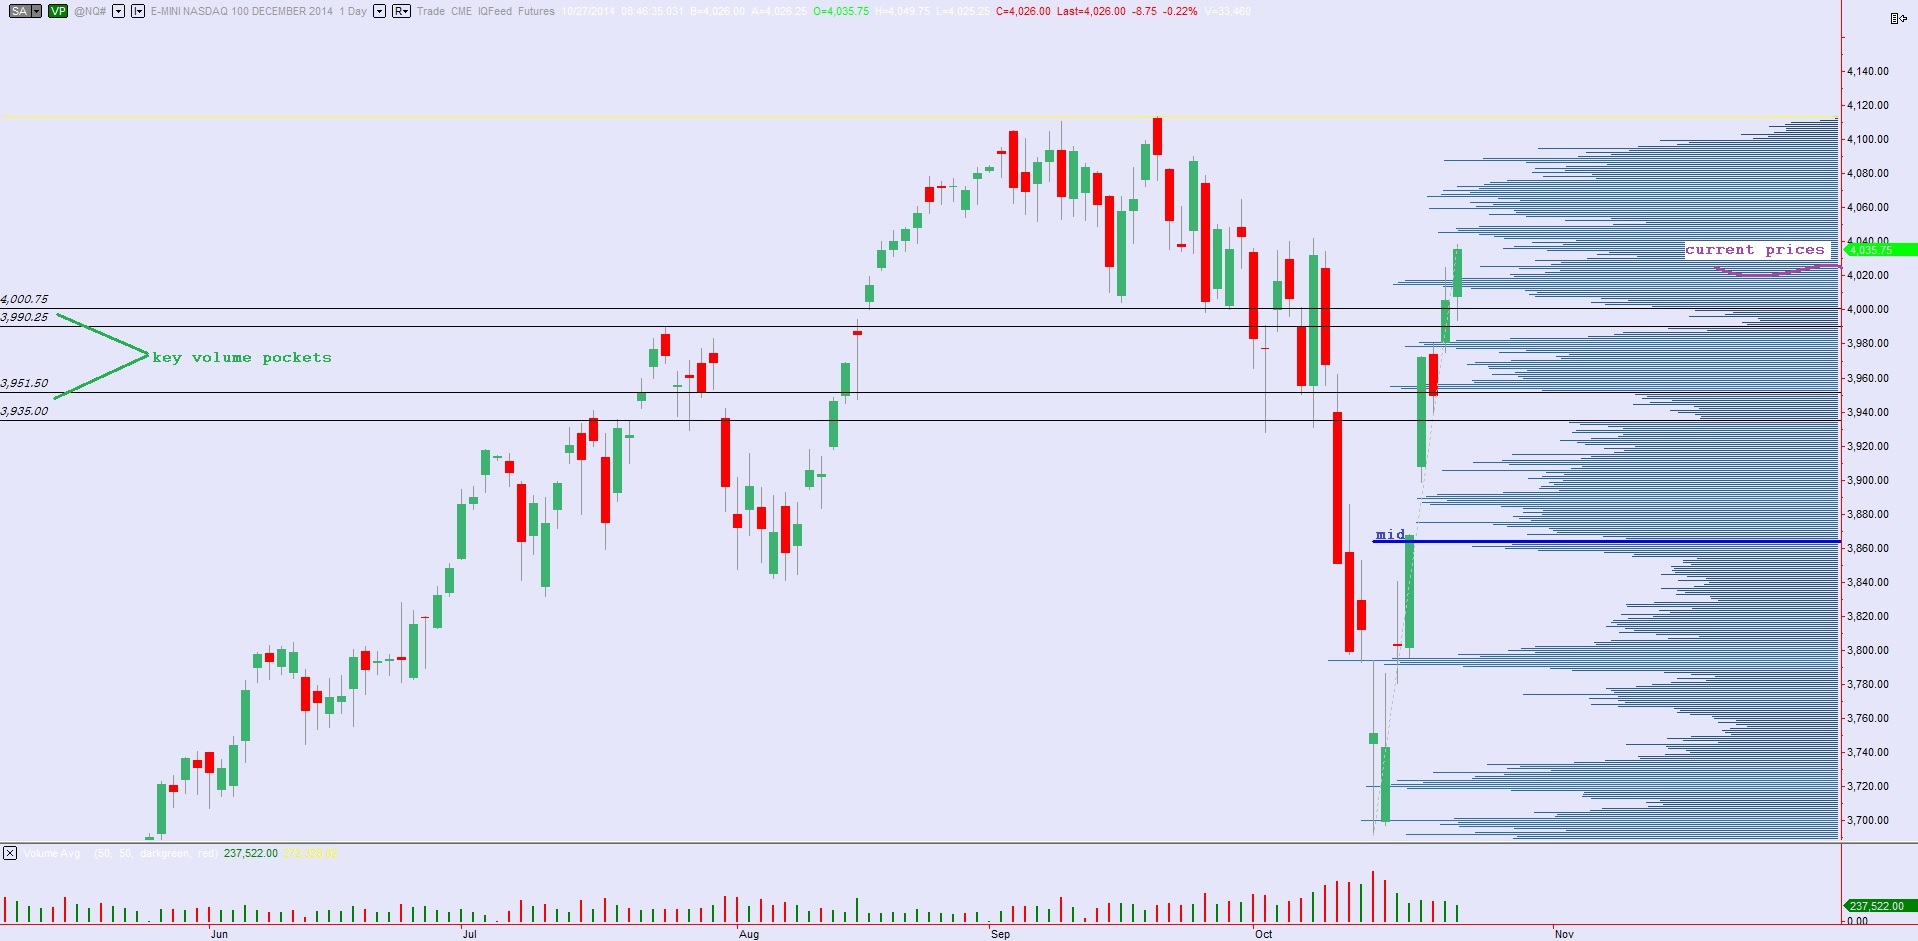
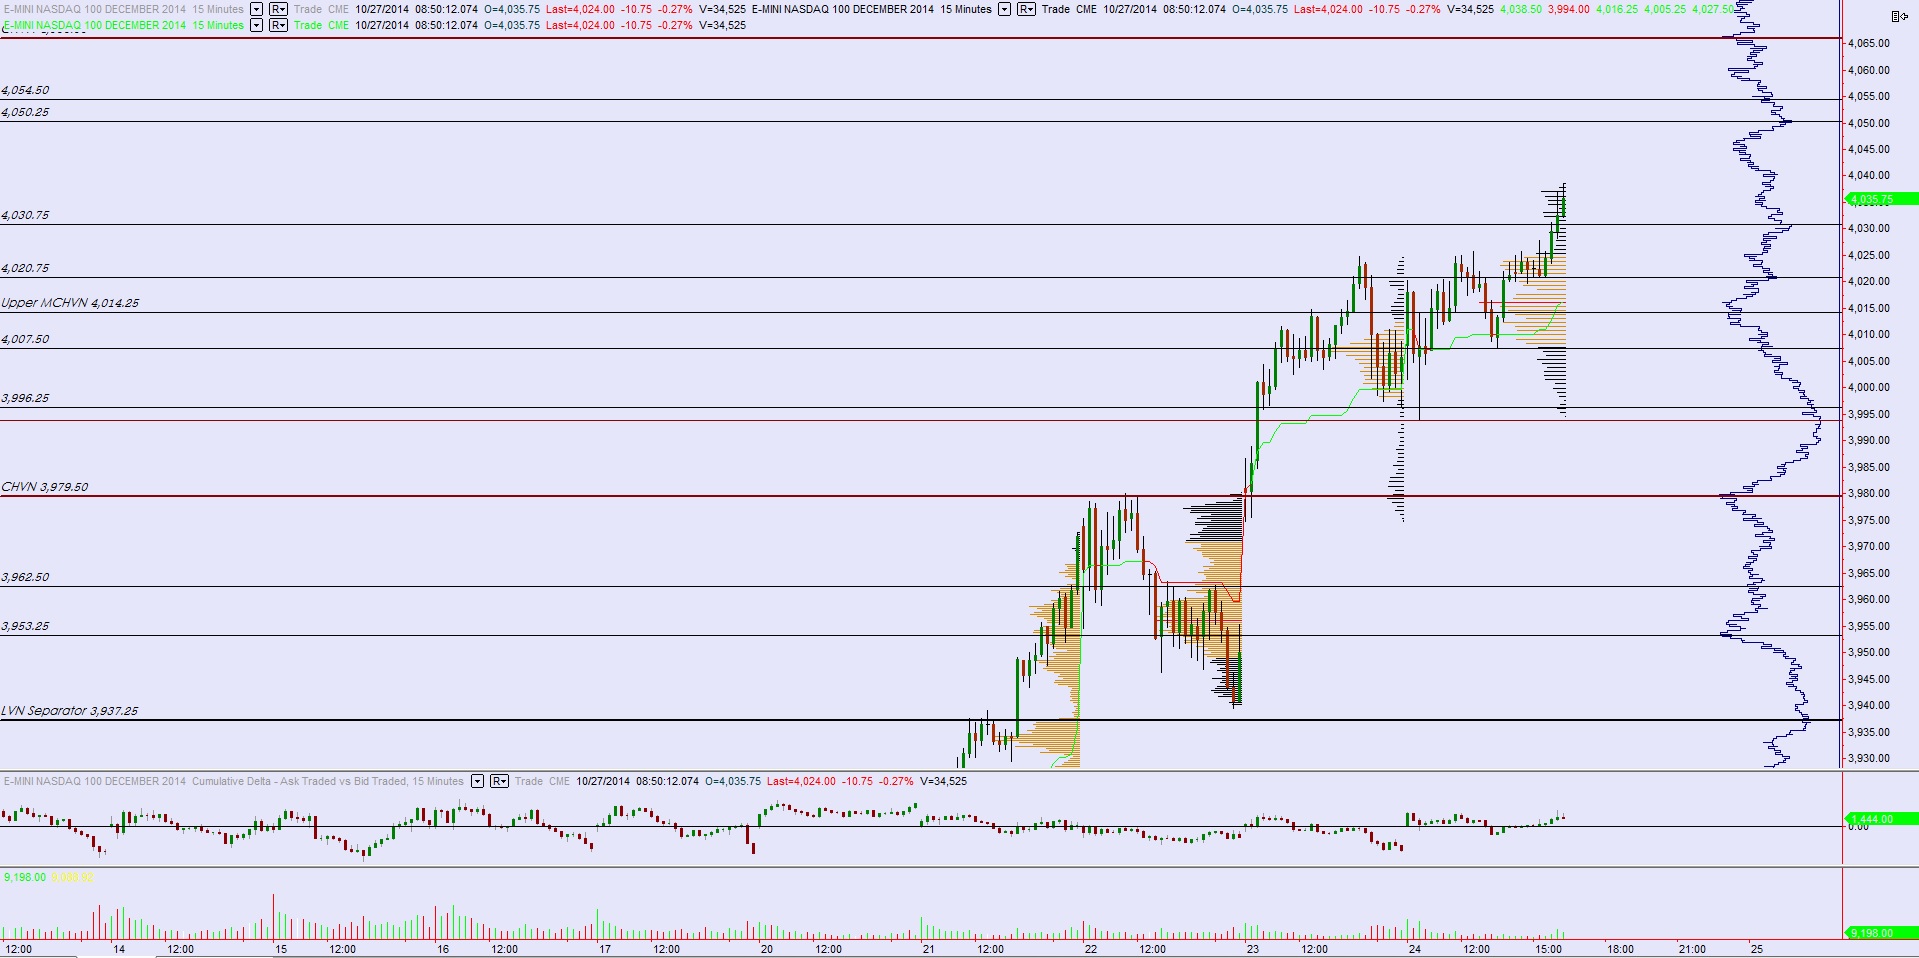
If you were to ask me one week ago today whether we would be templating the volume profile printed on the day BABA went public today I would suggest it was very unlikely.  Yet, here we are observing the key price levels left behind on the swing high volume profile.  I have noted these levels, as well as other carefully selected levels on the following volume profile mash up chart:

10292014_intterm_NQ

Comments »

Know Your Limitations

There are certain market conditions that will force you to the sidelines.  There, I said it.

Thus, to begin this discussion, the trader pedigree is divided into three very distinct grades, the scalper, the swinger, and the investor.  The next question to be approached concerns the pedigree of internet-trader law and the latter’s natural affinities.  There is a real stink about a person who is in every move and magically free of the natural process of losing.  Arguably more painful is seeing someone press a method that is not bearing fruit. This comes back to knowing your risk.

You must embrace change because the market will ultimately ensure you do—or leave with a frustrated look about yourself.

I have not done much to capitalize during the latest movement in stocks.  The only shares I was brazen enough to procure during the #knifeparty were shares in GNRC.  Those have rewarded me handsomely, but I assure you the trade was executed on smaller size due to overall market conditions.

The best traders I know have conditions they sit out. This is a huge part of their edge.  I know a fantastic day trader who is bored and meditating most of the time when the market enters a grind up.  I know another trade who whips that move 10 different ways and extracts milk and honey.  I know traders who crush swing trades when price action becomes fast and furious, keen on price levels and legging into their trades as part of their management.

Monitoring continuation is without question my strong-suit.  I am not a knife catcher, I have many deep scars to prove it.  I enjoy the anticipation trade with a touch of predominantly favorable order flow.  Being that the bulk of my trading career is post 2011, most of my experience is on the long side.  I need to improve my short game, even on the intraday scalping level.

Something about the nature of support after a thrust is much more in my wheelhouse then working a resistance even though the behavior is a symmetrical inverse. Perhaps I will take up standing on my head while I trade.

Needless to say, this grind-piece of an auction is where I thrive.  I measure midpoints, I buy dips, I scale, all very methodical and profitable.  This week has been about making hay while the sun shines and the weather stays oddly elevated over 70 degrees in the murder mitten.

I managed to win today, even while losing in TWTR common.  CLR, purchased the day before the gut check, came back a bit for me.  GOGO, hangs in there, consolidating inside of consolidation, not moving, causing much a tension!  The drama!  I kid, I love this type of compression.  BLOX, and old swing hold, again is knocking on the gates of a big-ass gap.  It might not rip, but it might.  And Elon decided he had shareholders’ backs which was the proverbial cherry on the pumpkin cheesecake

In short, I am grateful for these conditions, armed with a few new tools for faster conditions, and comfortably in some cash ahead of the popped-corn Wednesday Fed event.

Comments »

I Will Never Sell These $TSLA Shares

Sometimes you have to toss your entire school of thought out the window because someone logically teaches you something.  Your foundation stones, scribed with hammer and chisel, explode them on your knee and then open your mind to change.

Your favorite vagrant stock picker uses these charts to assess swing trades.  My most recent entry into Tesla was for the ‘200 role’ which is a power move to $250 a share reserved only for the hottest of momo stud muffins. Lately I sit here, filling up my subcompact with sub $3.00 benzino, watching these Saudi Arabians push the black tea down, and news flow looking grim.  To make matters worse, the market was running a rout, this company has some despicable valuation, and the technical picture is a bit dicey.

Let me show you something before cleansing the earth by burning it to ash and smoke.  This is a daily candle chart of The Tesla Motors aka TSLA.  What it printed yesterday looked like a textbook start to another wave lower.

TSLA_Daily_Oct

Then, on cue, like the guy keeps a technical analyst on staff, the most brazen CEO of our time takes out the South African whip and lashes the media.  Oh, the drama of it all:

Said technical picture is now moot, the auction has pulled a 180, and the torque behind this move is spine bending.

Let this be a lesson to all of yous.  Tech analysis has its limitations.  It is simply a method of measuring supply and demand and their effects.  But when you have a brilliant company on the edge of scientific discovery led by a Swiss knife of brilliance, just sit back and never sell those shares.

These old TSLA charts will also be burned for good measure:

TSLA_DEC12

TSLA_July192014

TSLA_08112014

Comments »

The Tail End of The Auction

There comes a point in any auction where higher prices cut off activity and more ‘noise’ must be introduced to give the perception of a continuing auction.  In a traditional one-way auction, say for a vintage automobile, the auctioneer will begin repeating words or adding details or pointing around manically to create an illusion of activity when price has actually stalled.  In a two-way auction like the futures we start to see overlapping value, indecisive doji candles, range compression, and eventually value compression or rejection.

The last three sessions in the Nasdaq did not quite demonstrate these traits yet.  Instead we are seeing a smooth migration higher in value.  As we approach US cash trade prices are set to gap higher.  Some of the gains has been paired back after a weaker than expected Durable Goods Orders (Sep) number came out.  However prices are still trading outside of yesterday’s range which creates an opportunity to clearly observe demand.

As we trade early on there will be clues as to whether the auction needs to continue exploring higher to find sellers or whether we have arrived at a location where sellers are motivated and present and willing to introduce enough supply to the market to overwhelm demand. First, the open type—is it an aggressive selling response from the minute the bell rings?  Or do we see an open auction with two-timeframe participation?  Next, do we trade into yesterday’s range?  Or is demand so strong prices cannot even return to the prior range?  Then, if we trade the range do we close the overnight gap, the VPOC, VAL?  And so on, we go, down the line, always observing the nature by which these events take place if in fact they do.

A unique opportunity to observe demand today, you see?

Keep in mind we have Consumer Confidence at 10am, MBA Mortgage Applications premarket tomorrow at 7am, Facebook earnings AMC, and tomorrow is a big Fed day-type afternoon which at some point is likely to produce a pause in the market.  At least, that is the expectation.

The second leg lower to follow the big, motivated knife lower in the Nasdaq came into question on 10/21 when we started the day with prices gap higher well above the midpoint of the move.  There are many useful Fibonacci numbers, I suppose, but the midpoint is my favorite checkpoint.  If sellers were truly motivated, then we should not have been trading back up through the mid.  Now the inverse is true, we have a midpoint to this up-V, it can be seen as the thick blue line on the below chart.  It is far away, as you might imagine, after such a large move.  This risk now, to longs, is this distance, as revision now begins to favor the seller.  However, auction theory, as noted in the lesson above, suggests we can be cautiously bullish.  See the below daily chart which has two air pockets and a midpoint noted:

10282014_daily_NQ

Bringing our eyes a bit closer, I have noted the price levels I will be observing today on the following volume profile mashup chart:

10282014_intterm_NQ

Comments »

Momo Taking Heat

They are selling Twitter in the afterhours market, a place inhabited by traders who deem the company insufficient in the manner of earning.  Price is moving just enough to give short sellers some hope at making a profit.  However, I would imagine the opportunity may be a short lived one, especially given Tuesday’s Facebook earnings and Wednesday’s FOMC business.  If you look at a chart of trade since the IPO of TWTR, you will see no real movement has occurred over the last year—just a sine wave through time.

I put some broad strokes on the chart, and essentially any trade confined within these levels is to be considered noise.  A conviction break and hold below ~$45 allows the bears an early advantage in initiating discovery.  After hours it has traded as low as ~$42.  It will be interesting to see how this trades come cash hours in the manana.  Until then, and even if I had been on the winning edge, it is best to save dancing the tapioca until after you have booked the trade.

In other news, the beaten back buyers inside of today’s /NQ_F could not be overwhelmed and as a result we saw a late day push higher.  The order flow became very clear just before noon New York when opening swing high, overnight low, and the daily midpoint all converged at 4027-4026.50.  We traded down into the level, found an initiating buyer and the rest was history—clean rotations higher suggesting the intermediate term buyer from last week is still active.  The only caveat is we printed a P-shape profile suggesting a short squeeze but no real initiation.  And with a busy week ahead, month-end, and the massive V-shape in our wake, price might want to test a bit lower come tomorrow.  However, the sellers are tasked with making an aggressive push at this point after merely reacting and absorbing today.  Buyers are innocent until proven guilty.

The scene under the sheets was a bit different.  Each rotation lower in the Nasdaq, even the minor ones, managed to put heat on momo stocks.  However, from the heat CYBR came blazing higher.  It was a bit of a mixed bag with correlations lower then we saw a few weeks back, but overall participants were not rewarded for assuming risk in aggressive growth names.

My Tesla looks weak too, very much a proper looking continuation lower chart.

Tomorrow morning looks to feature a few gut shots.  It comes with the territory of swing trading.  Earning season is fun, yes yes?

Comments »

$TWTR Will Save Us

The market is off to a real grinder of a start as we barrel headlong into a series of high impact economic announcements.  And though many traders are focused on asset purchasing pace, interest rates, and oil prices, momentum traders will be watching Twitter.

Just one scant year into public trade and this stock has seen its fair share of drama.  Yet, the company has seen very little change to its overall value—it has traded flat over the time.  Flat, mind you, is relative because along the way have been rotations fit for a king.  As we head into the first birthday of trade, and earnings after the bell, here are some basic price levels to have in mind:

TWTR_daily_10272014

Being a long, long since day one to some varying degree or another, I am certain this will be Twitters ‘coming out’ day where it proves doubters of the concept to be introverted clown babies.  This company has become one of the primary cogs of human existence.  It is trading like crap today, another solid sign for the chuckle hut.   Twitter has the added bonus or reporting after the Yelp and  the Amazon face plants where a notable shift in investor perception occurred in the growth complex.  Put simply, both companies were punished for being weak.  Here is the relative performance of TWTR, YELP, AMZN, and FB since the BABA top:


TWTR_COMP
Twitter is hovering in the middle of the pack, just slightly under-performing FB who reports tomorrow.  Will these two social media juggernauts join the ranks of our other two internet pillars?  Absolutely  not, both will crush and guide sending shorts to run to the hopium pipe.  My bed is made, long of TWTR in common terms, willing to risk to zero if need be to see this company ride to glory.

Comments »

Big Picture Context Update for a Busy Week

The economic docket features several heavy hitting events for the week ahead.  Starting with today at 10:30am when the ECB announces Covered Bond Purchase plan.  We also have Dallas Fed at the same time.  Premarket Tuesday we have Durable Goods Orders being announced followed by Consumer Confidence at 10am.  Come Wednesday afternoon we will be hearing several data points from the Fed including Pace of several asset purchasing programs, QE3 Pace, and the FOMC rate decision.  Thursday we hear Q3 GDP out of USA.  With all of that in mind, it behooves the speculator to turn their attention to the real information by observing our recent price action and volume behavior.

First let’s return to a weekly chart of the actual Nasdaq Composite.  Most of our charting of the Nasdaq features the front-month future contract, however the index itself often offers interesting and relevant action points.  Before volatility came into the market we saw price grind up and through the open gap left behind 14 year ago during the dot com bubble.  Once filling the void, prices printed a series of doji-type candles which signal indecision.  The final doji was long-legged then we began heading lower.  There was a responsive bid during most of the process which can be seen as tails on the candles or ‘shadows’.  However, three weeks ago we printed a large red candle down that closed on the lows.  Then two weeks ago we print a massive hammer candle, then last week a huge green candle.  The question now is whether the hammer-plus-confirmation allows the long term uptrend to continue.  As you can see price has come back into a prior area of resistance.  I suspect we see the market struggle to go higher at the least.  What bulls do not want is a fast rejection down—especially one that gives back 50% or more of last week’s gains.  I have noted these observations below:

10272014_weekly_NQ

The most recent and key takeaway from the above chart is that it is long-term bullish and the recent action printed a hammer reversal.  Thus, now coming to the daily chart, we know we want to know where the midpoint of that move is and how the volume structure looks between current prices and the mid.  I have noted the mid below as a solid blue line.  Above there are two distinct valleys where volume drops off significantly.  These can be fast regions for price action.  If instead price struggles to traverse these zones that would be an indication that buyers are sustaining control on the day-to-day timeframe.  I have noted the brackets around these low volume regions and other observations on the below daily chart of the December /NQ future contract:

10272014_daily_NQ

Finally, I have noted the key price levels I will be observing short term on the following volume profile mash up chart:

10272014_intterm_NQ

Comments »

Solid Linger into Week End

Perhaps a false sense of security, this market Is hanging on as we approach the closing bell.  It has been one of those Octobers where the scary clown came out of his van, poked and grinned, and now sits behind the bushes in your backyard staring in the windows.  Yet here we are, ‘normalizing’ and getting back to business.

The open was inside yesterday’s value, we tested higher and found responsive sellers, tested lower and found responsive buyers.  This is the type of chop we expected about 3 minutes after the opening bell.  We discuss open types and how they behave and what we can glean from them.  Today was all about waiting for the market to tip its hand via a major rotation.

Buyers showed up, made the rotation, and it made more sense, intraday at least, to be hunting the long side.  But don’t get me wrong, the big picture is spooky clownish ghoul and uncertain.  Should we fear uncertainty?  Should it elicit emotion?  No, death is just as natural a change as birth.

I am playing my book so slowly right now it takes about 2 meals per decision.  I reentered the GOGO today, hehe.  This latest ebola spook didn’t last very long.  It’s losing its potency or we are building up a tolerance.  Like any drug, fear needs to be ratcheted up as the use increases.  I joined Le Fly in CLR today, willing to build into another leg lower as long as I see buyers plying a bit of defense along the way.

Perhaps I will eat these words come Monday, but the overall scent of relief rally has emboldened my spirits.  As have the ritualistic activities part and parcel to a cleansing.

The key to fast markets is not trying to catch every move and not fighting the big waves.  Just take it all in, stay limber, and hit your notes when the Great Conductor waves his baton your way (take your trades).

Comments »

Ye Olde Check Back

Nasdaq futures have been chopping about on normal volume overnight as we head into Friday’s trade.  The NYC Ebola case was confirmed and the equity index is demonstrating sensitivity to the news.  We have New Home Sales data coming out at 10am and an otherwise quiet economic calendar.  Some news about ECB bank stress tests is hitting the wires are we approach cash trade and it is causing a bit of a stir in the futures.

Shifting attention away from the daily bar chart, let’s look at the monthly volume profile print.  A quick note on the daily bar chart (not pictured) is we have seen signs of responsive selling both Wednesday and yesterday.  Whether they can convert to imitative selling is the question on my mind today.  Back to the monthly volume profile, we can see price testing the uppermost value threshold we printed during September.  My initial expectation is for participants to reject this value area, however if they cannot then a test of the VPOC then the other side become likely.  See below:

10242014_monthly_NQ

Yesterday’s profile print was quite the odd shape.  It had the marquee P-shaped short squeeze look for most of the session, then we popped out of it to the upside.  At this point a well-timed Ebola case hit the wires and we saw a sharp responsive sale.  The result is a thin tailed balance of sorts which we are set to open inside of.  We have left behind 4 NVPOCs and 2 open gaps on this move up, we are seeing signs of responsive sellers, and the week is coming to a close.  My primary expectation is for a choppy session with a downward bias as profit taking into the weekend causes sell flow.  I have highlighted the key levels I will be observing on the following volume profile mash up chart:

10242014_intterm_NQ

Comments »

Eyeballing These Setups

That’s about all I can muster the strength to do, with these long setups, is give them a good eyeballing.  Stare as I might that is not how babies are made.  I took one shot long today, in the afternoon, via the GOGO, but then Ebola hit the wires and I bounced.  Planes, internet, Hazmat suits, extended pounce by the Nazzy—it is all too much to bear being bullish on airplane wifi.

Stupid Ebola, messing up my longz, lol.

I here crazy stuff like this all the time, cursing external events.  Let me bestow a gem from Marcus Aurelius.  This one applies so tight to trading you would think this guy scalped spooz for a living:

Objective judgment, now at this very moment
Unselfish actions, now at this very moment
Willing Acceptance, now at this very moment, for all external events.  That is all you need.

Cultivating this mentality, this little piece of stoic acumen, might be the change you need to clear a trading plateau.  Make a plan, use your logical mind.  That is what makes us human and superior to other mammals.  But remember that your emotions have the strength of a bucking elephant, and can take you on a wild ride plan or not, unless you strengthen your inner peace consistently.

Still struggling?  Lose a vice for a bit.  Just don’t press to hard or you might end up in the old padded room.  But be honest, are you working hard enough today?  You might not like the real answer.

Some call it Midwest work ethic, others immigrant gumption.  I call it look at the alternatives because they suck.  An oppressive corporate structure is not a real life to live.  There was some disturbing stat on twitter this morning (has the be true because its own [sic] the internet) that Americans forgo (and here’s my guess) a few ten thousand hours worth of vacation days each year.  Ah, such commitment, but for what?  Your own worth or the Lord of the Manor?

I will leave this comically long tangent and return to my point—I am stuck in risk aversion.  Here I sit, shotgun in tote, not buying the nuts off this dip.  All this sitting made for an admirable comeback, I did not puke, but not fear profiteering.

I liked SPLK, watched it rip a 10 bag.  I loved SUNE at $14.25—up up and away.  I even fancied ‘the man’ himself, LNKD for a minute, a bastard stepchild of the HR department.

TZA stopped out fairly early.  GNRC is looking good, TWTR is trading like someone knows the earnings are weak, BLOX is still at work, and XON is a hungry looking beast.  But there could be more winship.

My goal into the weekend, pony up and find a chart to buy.  Hopefully it sticks or I will be out said chart in 20-30 minutes.  Perhaps strenuous exercise will quell this aversion spell.  Or smudging some thickets of sage across the mother ship.  Or a vigorous mopping.  I shall do all three.

Comments »