iBankCoin
I turn dials and fiddle with knobs to hone in on harmonic rotations
Joined Oct 26, 2011
4,121 Blog Posts

Huge Volume Persists

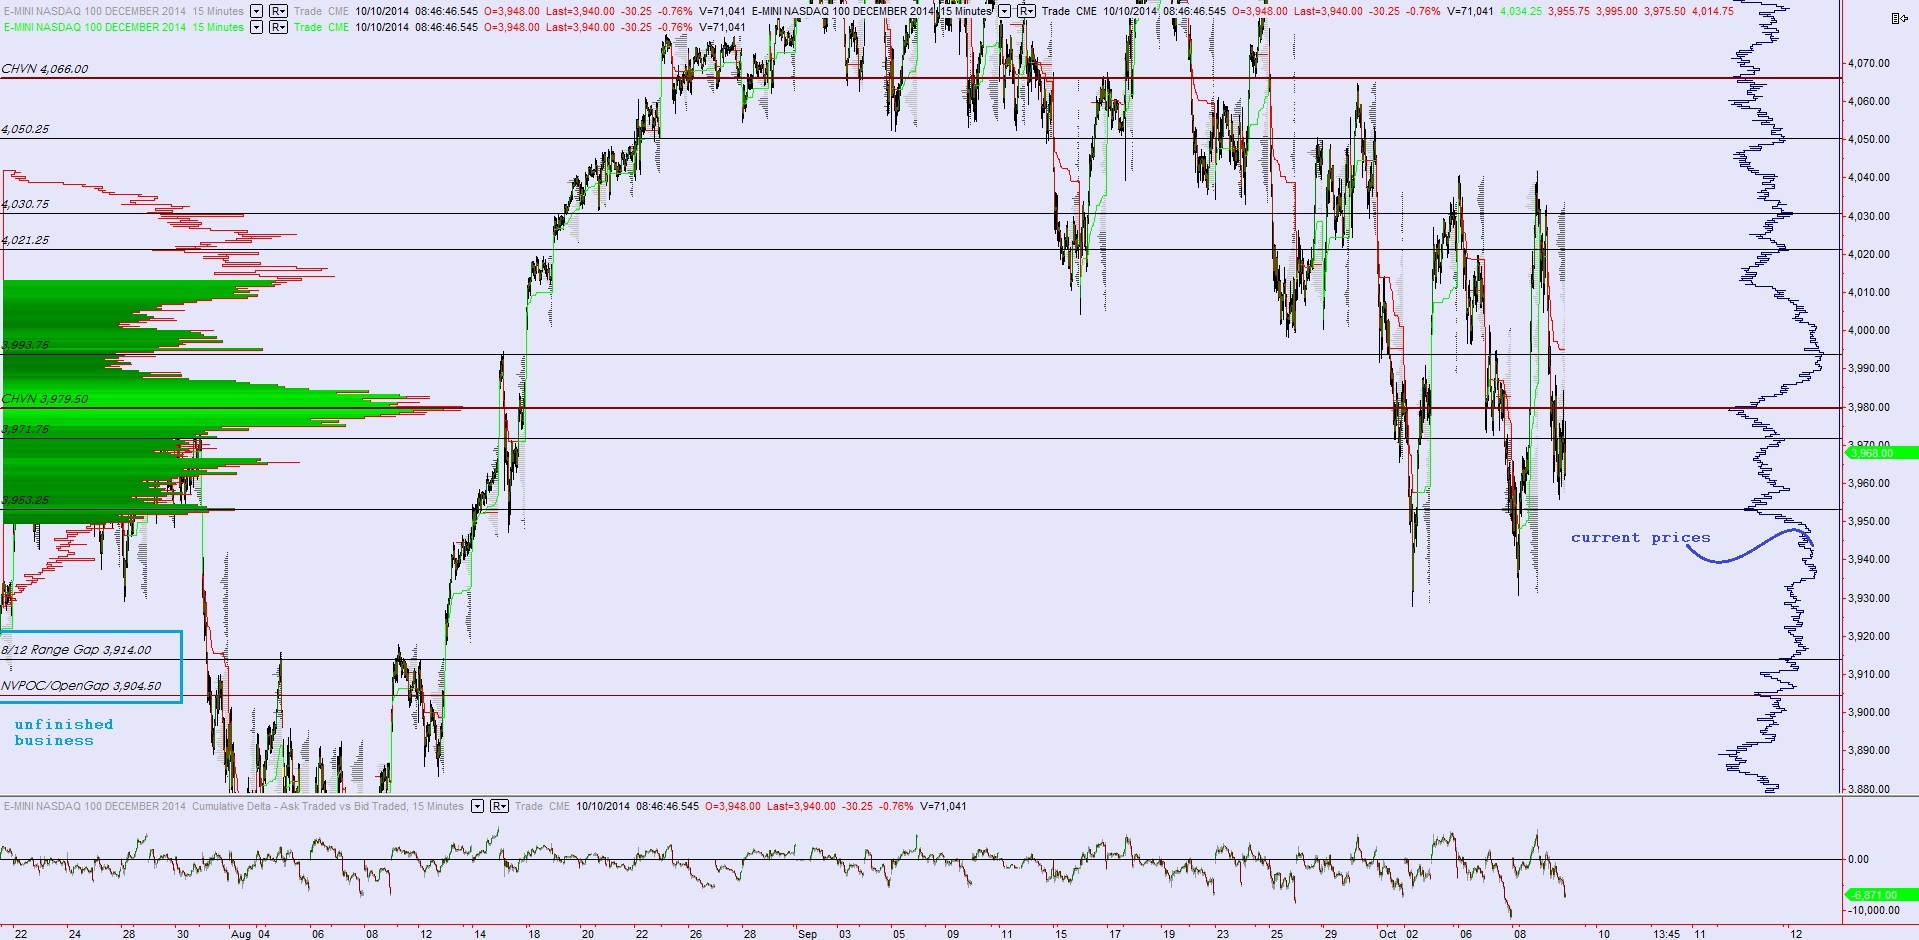
Nasdaq futures are hovering right around yesterday’s low as we head into Thursday’s trade.  Volume overnight is above yesterday’s and that is saying something.  We are running at extremely high volumes in the globex session (and RTH).  This market is doing a very good job of facilitating trade as it heads lower.

Tomorrow is option expiration day after what has been the fastest down week of the year.  As we wrap up the week there are a slew of economic releases including manufacturing numbers at 9:15 am, Philly Fed and Housing Market index at 10am, and Friday we have more housing stats premarket then U of M Confidence at 9:55am.  We also have the Ebola, taper, major earnings including Google, and a big down market.

Yesterday I put out a note about how this type of action is surly to attract the interest of a higher timeframe.  Depending on how we close, this news will reach many normal folks for the first time over the weekend.  It will then be their discretion to act.  We have no way of truly knowing how their perception will color the market, however we can continue to be vigilant as the increasingly risky hole shorts continue to win out in this marketplace.

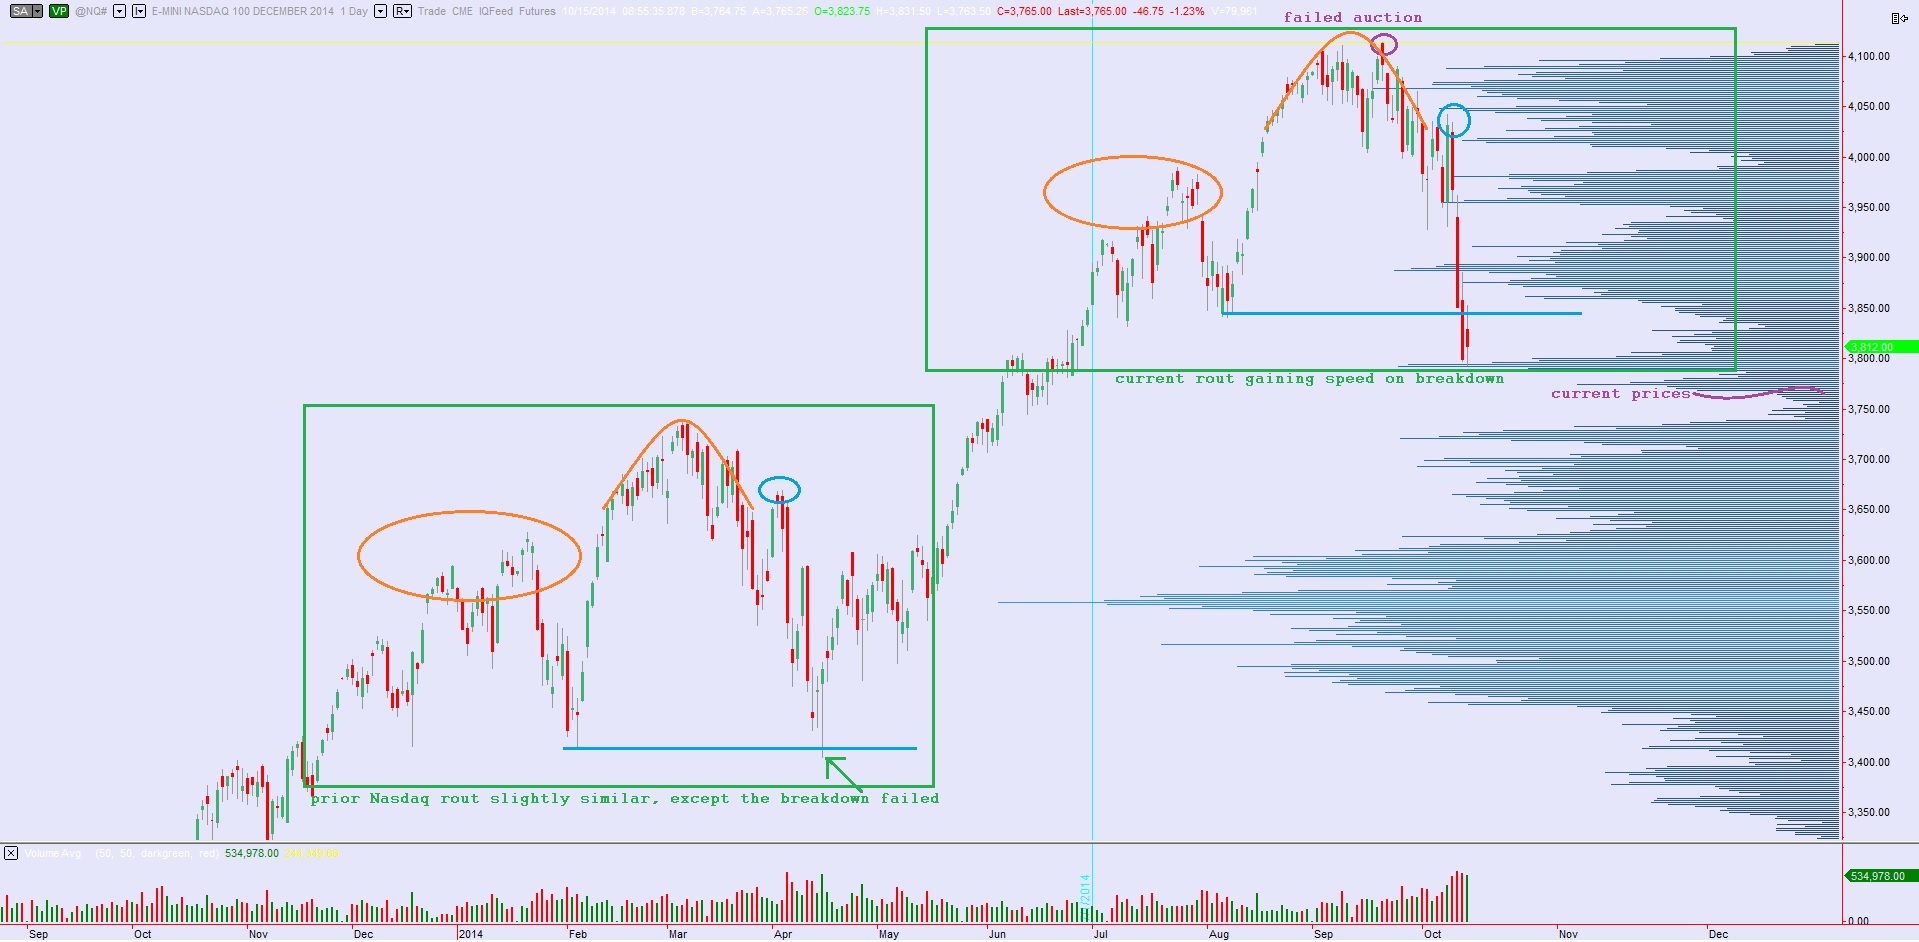
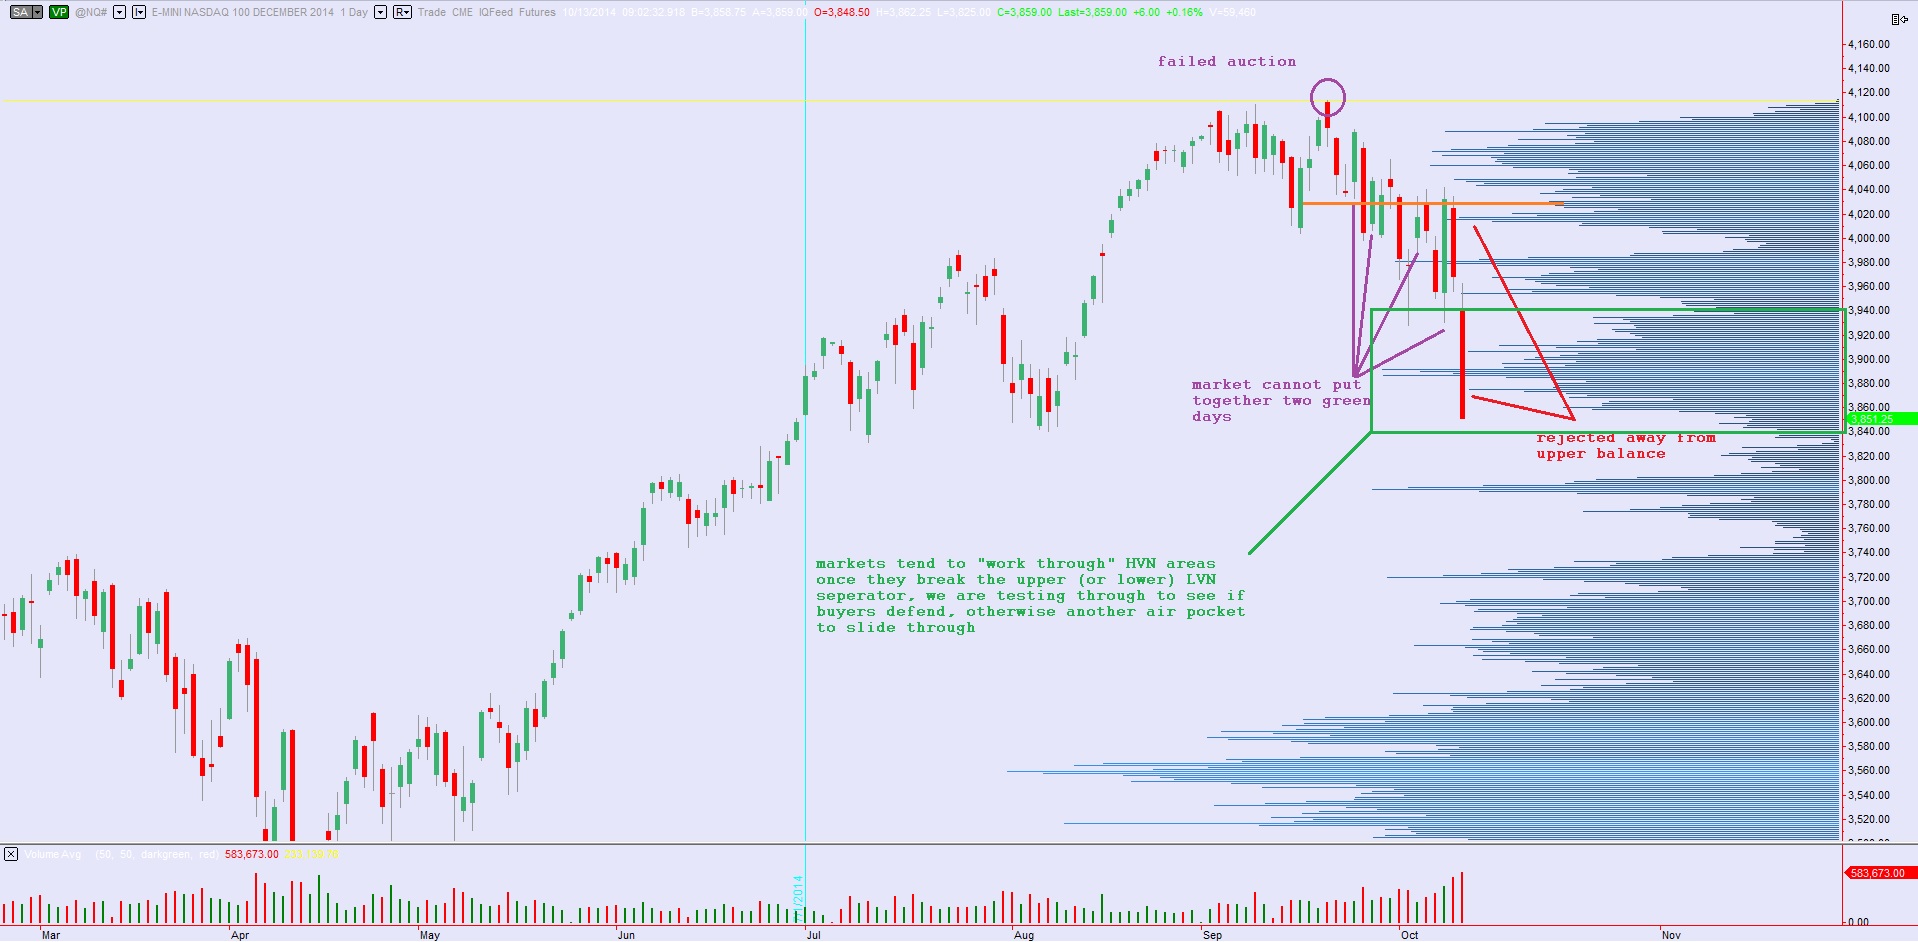
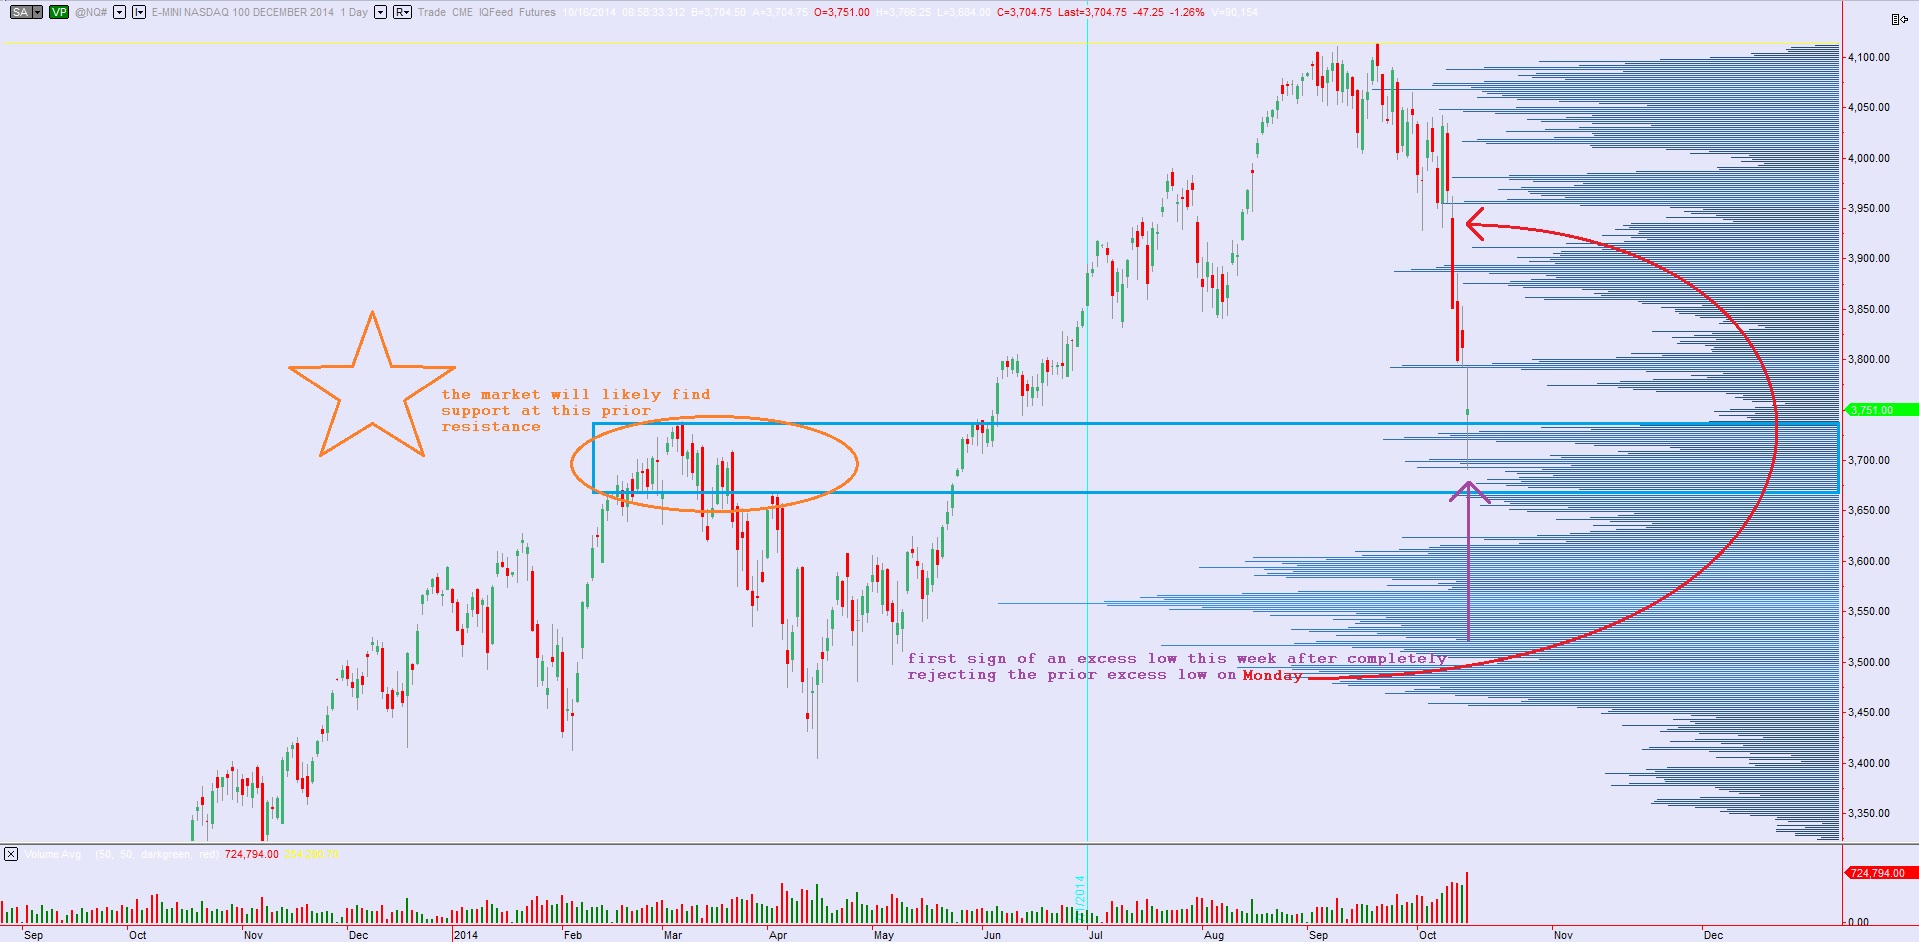
We have been zoomed out and looking at the daily chart of the Nasdaq futures since the span of price action has accelerated.  As you can see, yesterday occurred on the heaviest volume we have seen this year.  The low printed on the session was of decent quality, meaning, we saw a sharp response from buyers which left an excess low.  This type of buying action can motivate others to begin legging back in and using this larger buyer to lean on for support.  Therefore, if we do not see similar buyer strength near these lows today, it might result in another leg of selling as the fresh buy flow loses traction.  Nevertheless, we can look for signs of follow through today as an opportunity at a tradable trough.  Note how we are coming into an area that was vehemently defended by sellers earlier in the year, this is very likely to behave as support:

10162014_daily_NQ

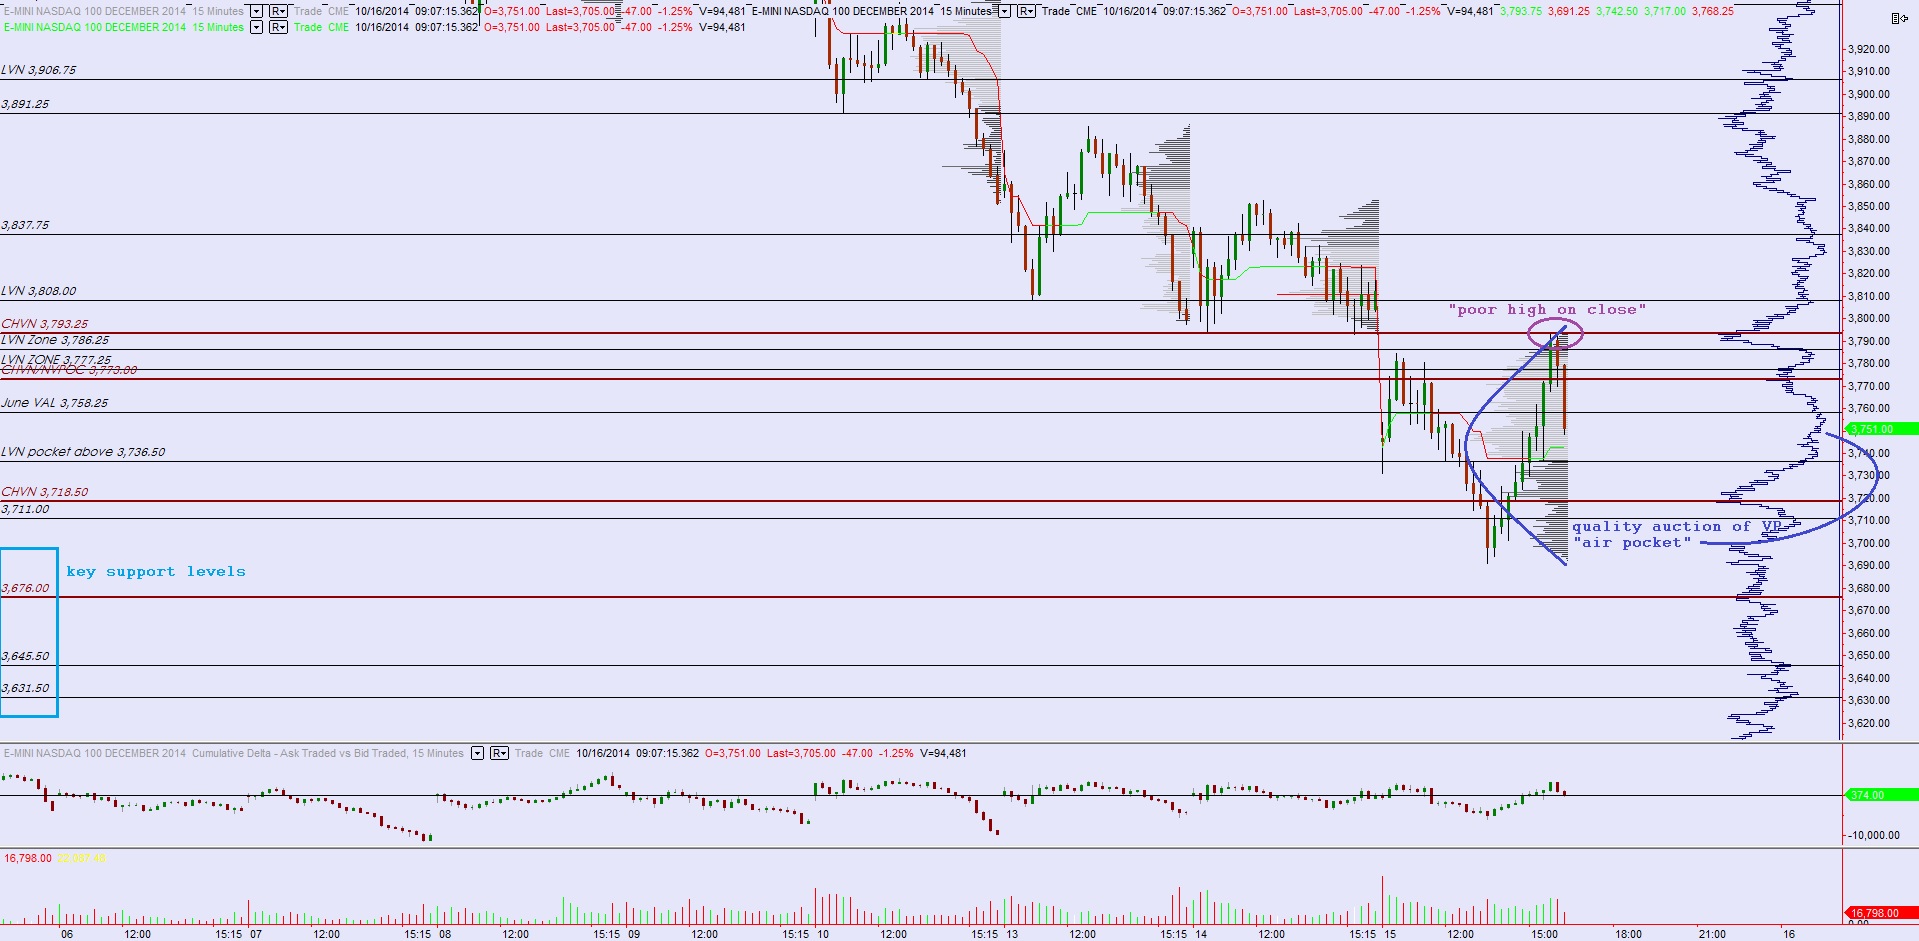
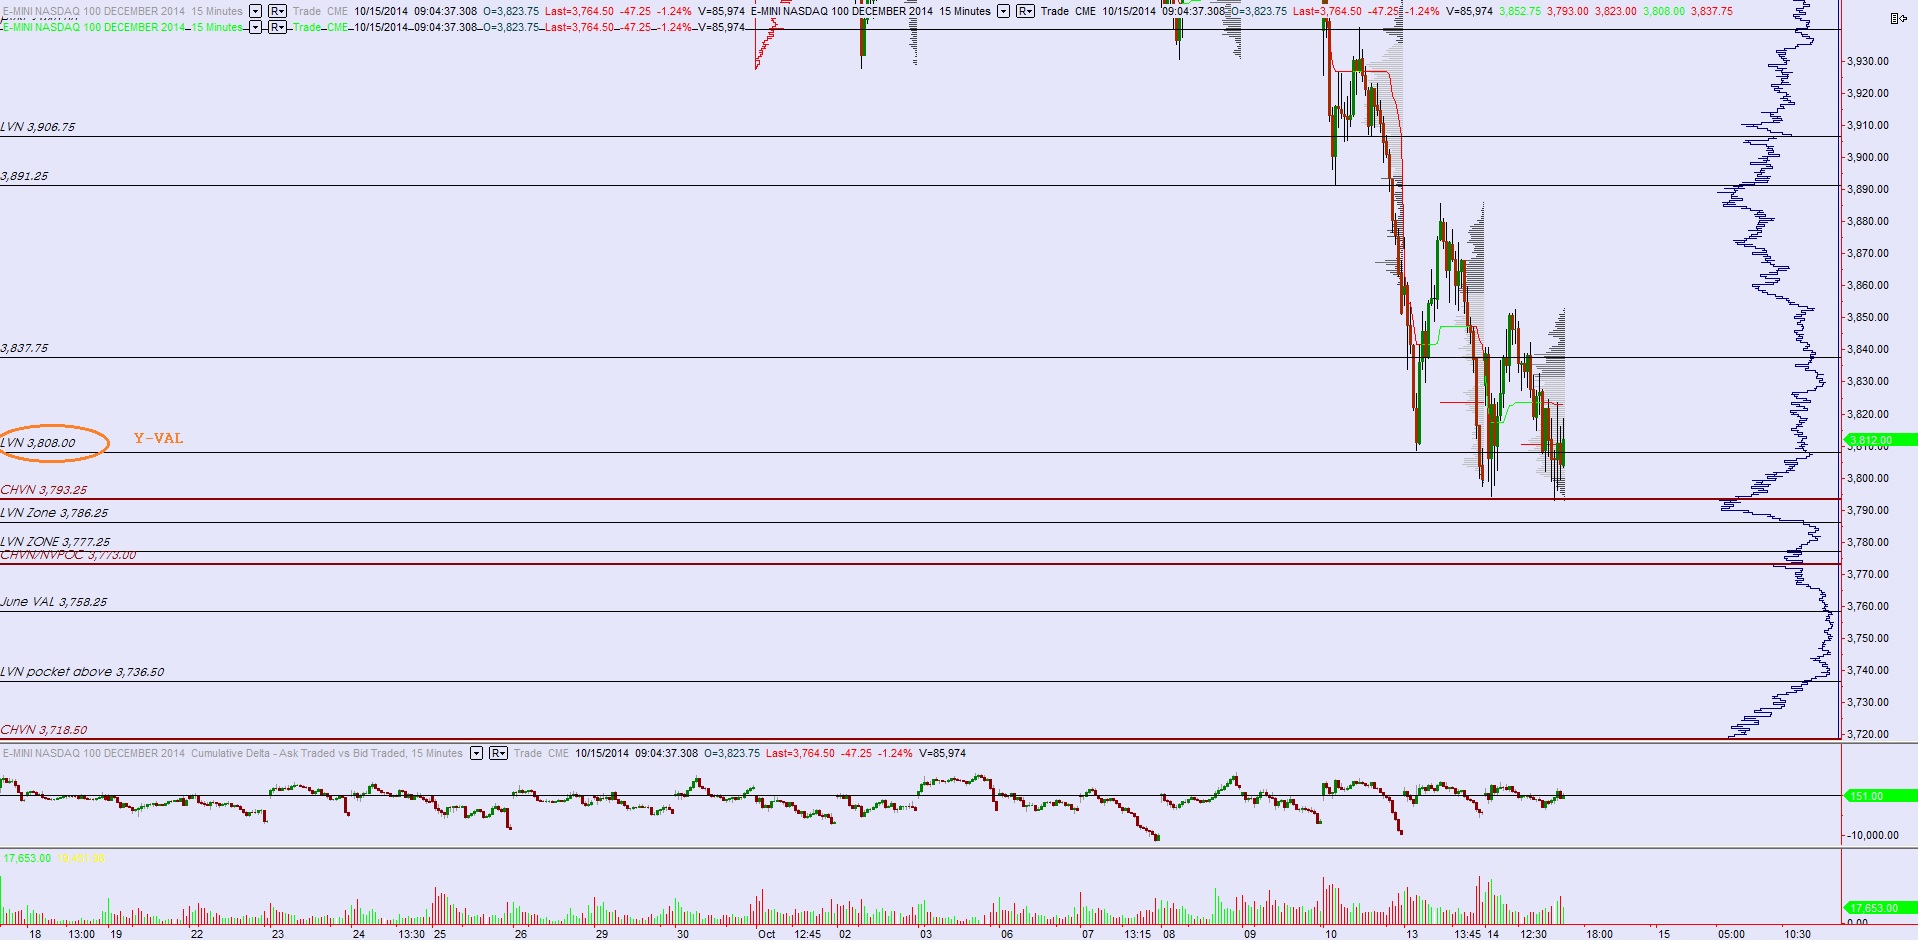
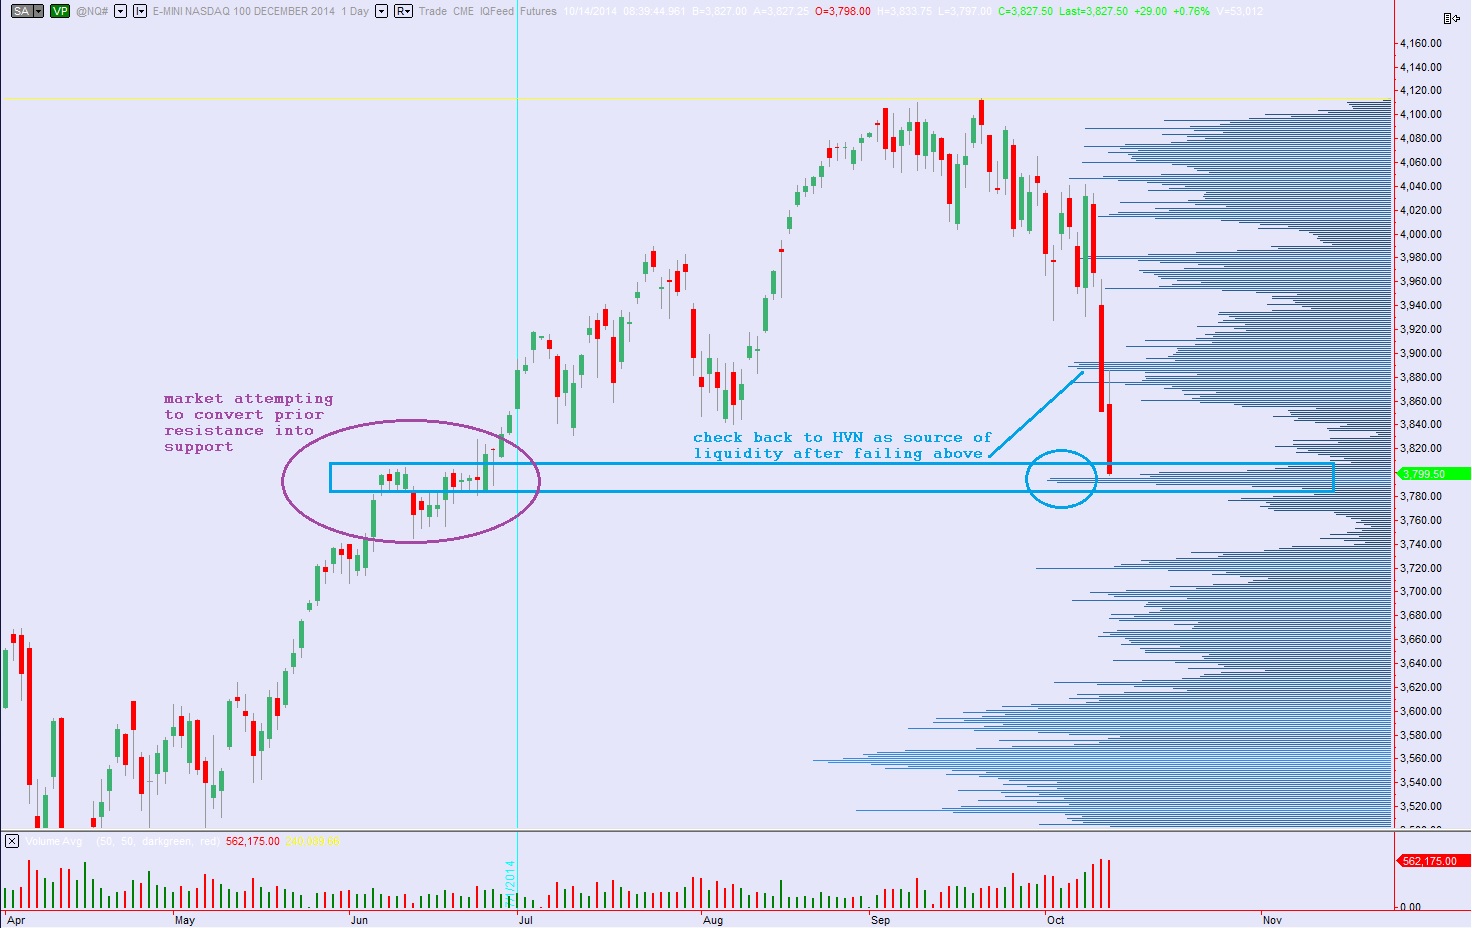
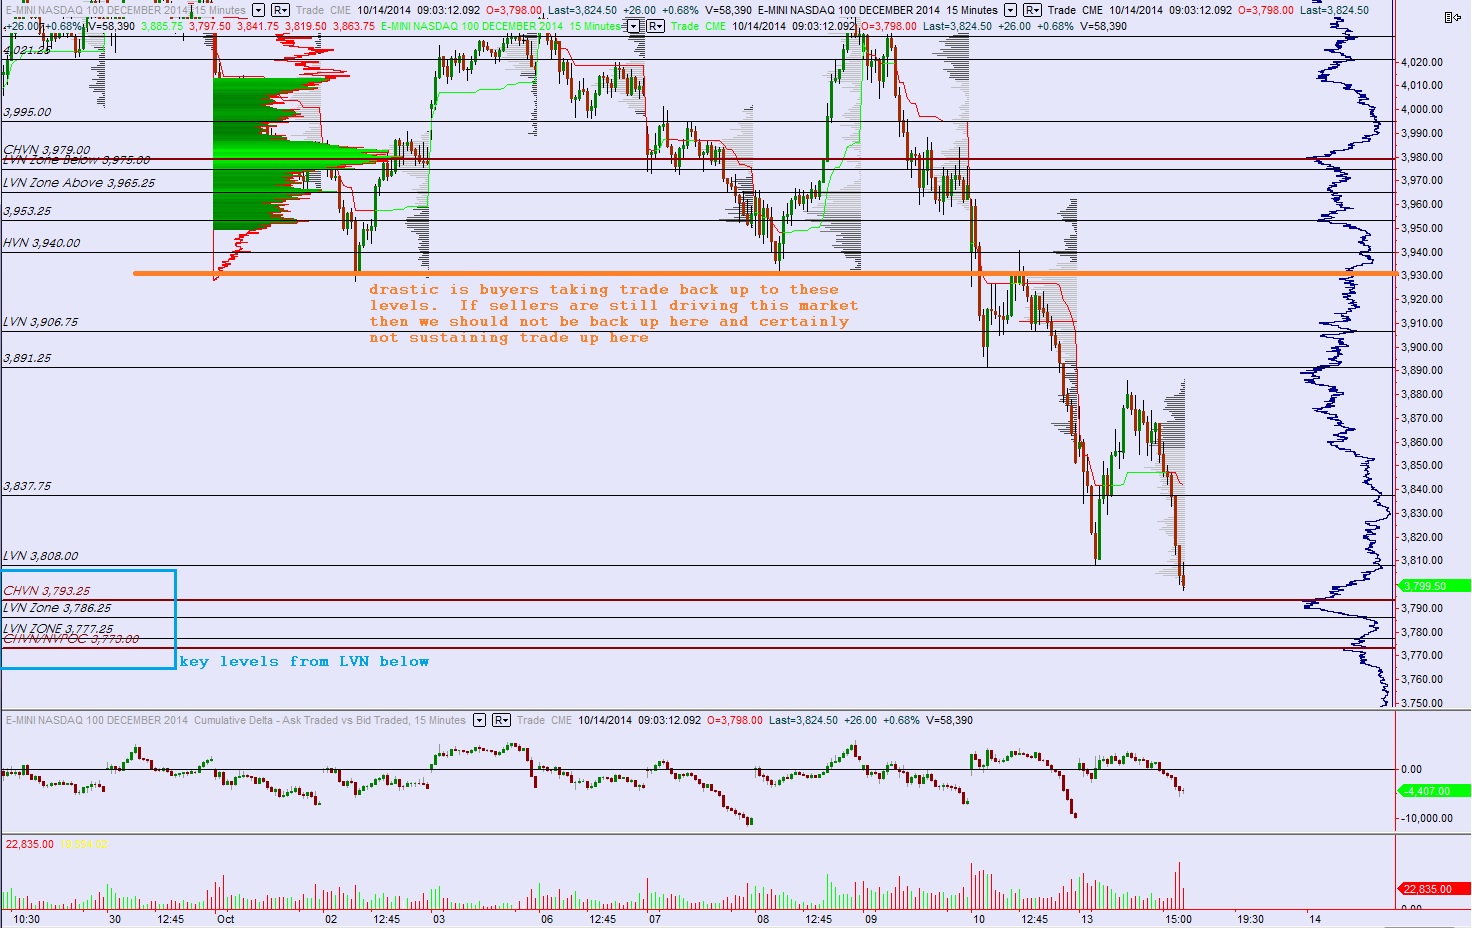
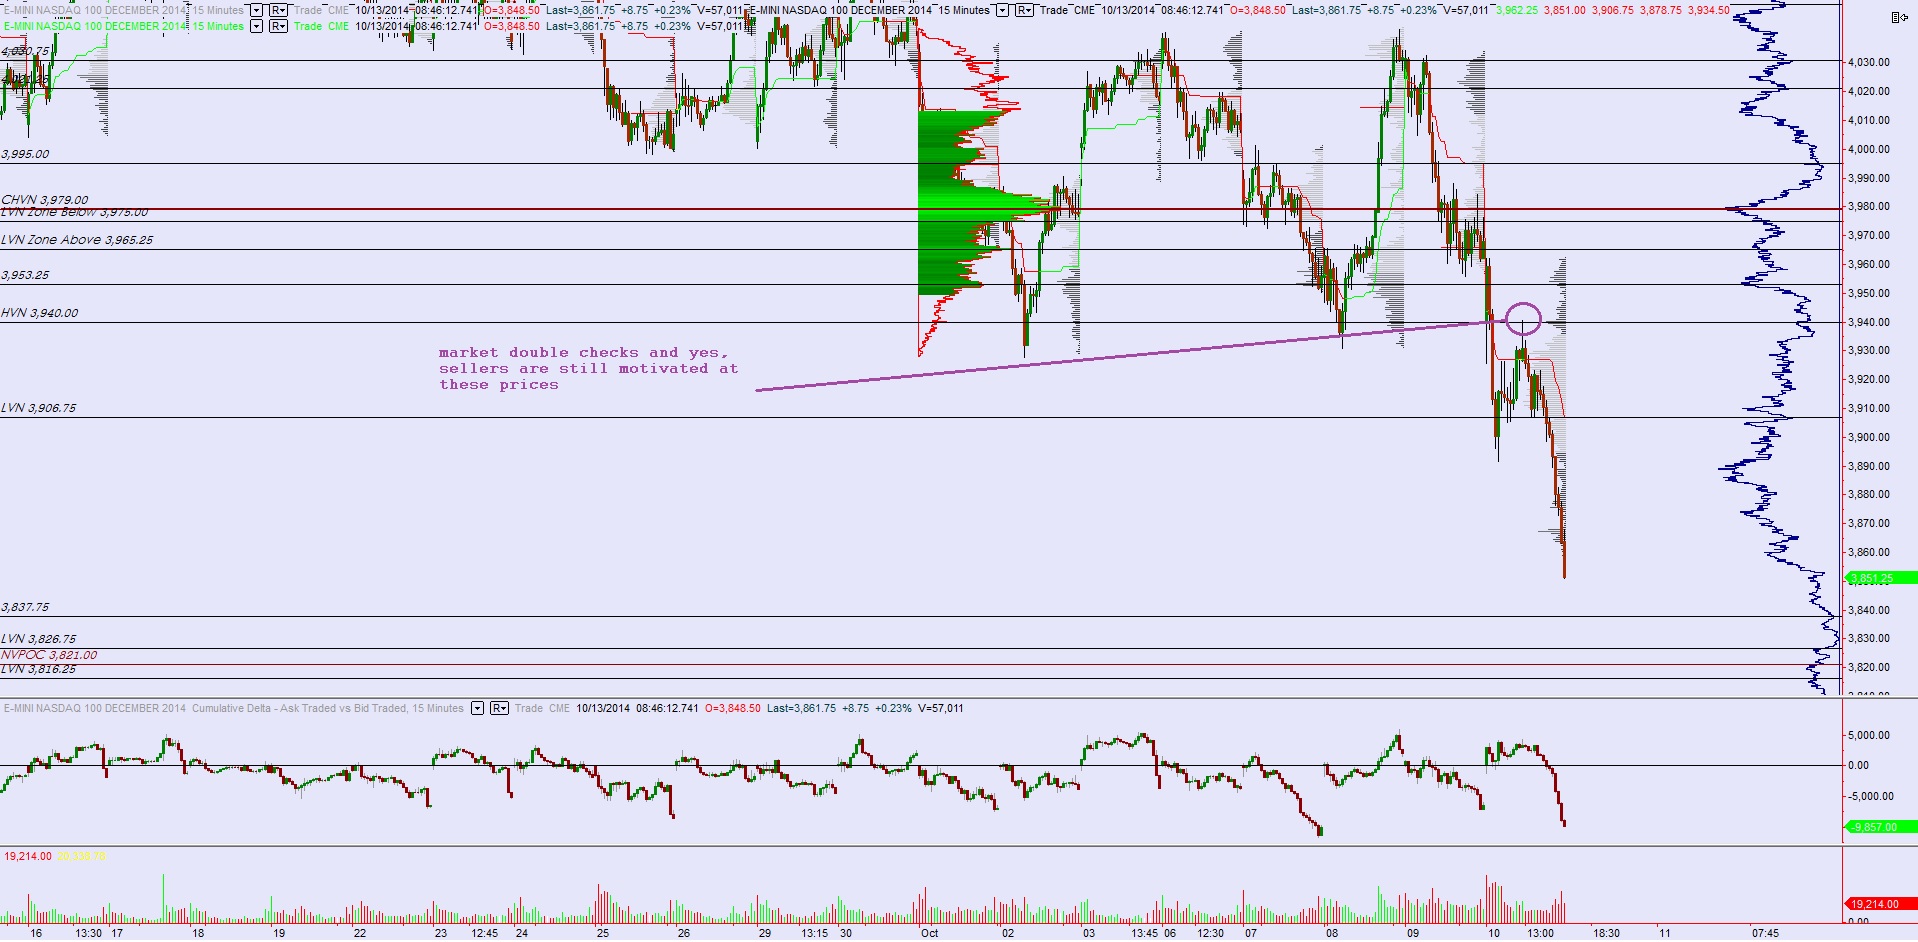
A commenter once asked if I keep a running count of the naked VPOCs the market leaves behind during a swing.  I never have, but as we systematically ‘check back’ to these levels during this correction I could see the merit in such a counter.  Every day when I ‘look left’ and take the time to find the highest quality reference points I have another naked VPOC to note.  The market loves to retest these HVN price zones before continuing higher and our most recent leg up abandoned that idea and marched higher relentlessly.  Now that we are on the other side of the mountain these levels are being worked.  I have noted the next NVPOC at 3676 as well as a few other observations on the following intermediate term chart.  Do not let this chart confuse you, it is simply key price levels to observe in the seller controlled intermediate timeframe:

10162014_intterm_NQ

Comments »

High Timeframe

One of the market characteristics we often discuss as part of auction theory is what ‘timeframe’ is interacting with the marketplace.  This can help guide us in our trading decisions, especially when deciding what price levels (market profile, volume profile, daily, weekly, etc.) to pay attention to.

You may have noticed I have been omitting a market profile chart from my recent analysis.  This is because we are operating with the high timeframe who are likely being forced into action this week.  Their effect when interacting with price throws the quest for value onto the back burner.  Instead what matters is price action on the higher timeframe.

They are not interested in intraday levels or discovering value as we typically observe it.  This action, especially in the Dow, is likely (if not already aware) to gain the attention of a very high timeframe.

In short, be aware that the likelihood of your price level being run over is elevated in this tape.  Let the price action (heavy reaction, rotation size, impulse, etc.) establish your bias.

On the day, in the /NQ_F, prices need to sustain above 3738 to consider the long side.

Comments »

Gap Lower Out of Range

Nasdaq futures are down on heavy volume overnight.  As we approach US cash trade prices are trading below yesterday’s range.  Prices were soft overnight and accelerated at 8:30am when Advanced Retail Sales and Empire Manufacturing came in lower than expected.  We also have Business Inventories at 10am and Fed’s Beige Book at 2pm.

Whenever the market gaps outside of the prior day range we know with certainty we are out of balance on the short timeframe.   Overnight participants have rejected yesterday’s range and once the stocks which comprise the index begin trading the new development needs to be priced into the market.

The daily chart illustrates just how fast this market is travelling down and how little difficult it has been, this week especially, to find a motivated buyer.  Once Monday rejected the V-shaped bounces of last week it sent a strong indication that sellers were in control.  Until we see buyers able to take out a prior day’s high the momentum is lower.  What is lending to the velocity of the move is the toothy volume profile we built on the way up.  Each time we slide down through an high volume zone there is another volume pocket which provides little support. The question now is whether we will traverse the next region to return to the very thick profile developed the first two quarters of this year.  I have noted this and a few more observations on the following daily bar chart:

10152014_daily_NQ

One might make the argument that the daily chart is neutral or even bullish, however there is no confusion on the intermediate term timeframe which is trend down seller controlled.  Yesterday I suggested we needed to see something drastic to change that control.  To clarify, an event would need to be drastic to alter the intermediate term control in one day.  Something less drastic, perhaps lasting 5-6 trading days, could also serve to put this timeframe back into balance.  In the market profile webinar I discussed how high volume nodes don’t make good entries.  That is because often times we traverse the entire high volume region and test the other side of it before determining if it was an effective zone for turning price.  That is what we are looking for today, as we test the low volume nodes on the other side, if it is in fact support.  I have note the key price levels I will be observing on the seller controlled chart below:

10152014_intterm_NQ


Comments »

Playing The Clarinet

squid

My biggest goal in these fast times markets is to trade as little as possible.  I was reading through my archived works today, for example, to look at past follies.  The biggest gorilla has always been excess action.  I am a busy body, a hyperbola, one heavily influenced by watching teevee whilst gaming and talking smack in AOL chat rooms.  I have always surrounded myself with multiple screens which pump information at my person.

It all screams DO SOMETHING, if you are not careful you will do anything because you’re bored.  I find these conditions to be anything but boring.  They are more like watching a theatrical performance from the orchestra pit.  I have front row seats at the market where I can closely observe the action on the stage and the audience reaction.  Occasionally I toot out a few notes on my little clarinet, little pieces of sound that compliment the grande display.

This morning was all about the turnaround.  Actually first it was about smashing out some sell orders into the early market demand.  Remember, someone is liquidating when they can, not when it is ideal.  Some big ass Exodus where you need demand to sell into.  Can you imagine how challenging it must be to find reasonable demand to sell into?  This morning’s gap was perfect.  Sold.  Next, it was turnaround Tuesday time.  It was that simple, our protagonist stepped forth and unsheathed her sword for all to see.  It was long and swung with confidence, a buyer.  ‘Toot toot’ buy something.  Here comes lunch ‘toot too’ sell it.  Late day neutral print then CRICKETS, oh the suspense, FADE IT ‘toot toot’.

And so the day went.  It was a good day.  This is the duration I am working at right now.  I can’t trust these things for more than a few hours, sometimes minutes or even dastard seconds.  Speed is the name of the game and if you are too slow you are drinking mist.  Are you able to rush and go slow at the same time?  If not, then it is even more simple, stand aside for now because these are fast times.  It will slow about soon enough and you will need good capital to operate at during the next phase.

All I did today was buy some short term AMZN and sell it, keeping a small runner piece for tomorrow.

Comments »

Looking For Something Drastic

Nasdaq futures worked higher during the globex session, with the bulk of the move occurring after 7:30am when we started hearing about earnings from a few banks as well as JNJ.  The economic news from the UK and Europe was all soft overnight but the market appears more reactive to the earnings environment today.

The market worked back to an area of prior liquidity yesterday after failing to sustain trade at the prior high volume zone around 3890.  The thin pocket we fell into offered prices little opportunity to sustain themselves.  However, just below yesterday’s low was a spike of volume left behind when sellers previously defended this zone with rigor before ultimately giving way to higher prices.  These are the places where we look for signs of demand—places where sellers previously played defense.   Converting resistance into support is a characteristic the market often demonstrates. I have noted this level as well as the air pocket below it on the following daily bar chart:

10142014_daily_NQ

The issue bulls have to contend with is the motivated manner by which the market is trading.  Volume on the Nasdaq futures during the last three down days has been at the highest seen since around 2011.  The market is a mechanism designed to facilitate as much trade as possible between as many parties as exist.  Since the 9/19 failed auction high we have seen a clear pattern of lower highs and lows emerge on the intermediate term timeframe.  At some point this selling exhausts itself, and perhaps this morning’s strong gap up is an early sign of exhaustion.  However it would take something drastic to turn the course of our current intermediate term direction.  I have noted key price levels I will be observing including a price level I consider “drastic” and also noted the granular detail of the HVN zone we are trading down into (see prior chart) on the following intermediate term profile:

10142014_intterm_NQ

Comments »

FAKE RALLY

If you are long any high beta growth stock which is green today, rest assured, that number is a fake and you soon will return to your regularly scheduled bloodletting.  The gods are agitated, mere mortals.  You were given sufficient reparations for your dutiful market participation these last two years.  But you demand more.  The moon was painted red multiple times as a clear message to humble your ego.  Yet there you were, nibbling incessantly from the forbidden giblets of our most holy tree without keeping an eye on your arse, your risk.

Now you have been fixed to a proper boiling chair in the furnaces of hell and Beelzebub is your only friend.  He has advice like, “cut that flap of skin between your pointer and middle finger” and “channel your rage into moar trades”.

Your soul now resides inside the third ring of middle earth and it’s your job to retrieve it.  Fortunately these stories of ghouls are as fake as the ‘value’ transfixed to four letter acronyms across the financial complex.  Real work, adding value in a palatable and tangible way, continues to thrive.  Know this, the market could head into another crisis (GMAFB, fake) and there will be virtuous men and women who emerge from the ashes as brilliant innovators.  Are you going to do what it takes, risking everything you have to produce the next note in our grande symphony?  Or will you try paying someone else to do it for you?

The dead days of the summer were a swell time to check yourself, an offseason of sorts in the warm southern breeze.  Now it is cold, the days are short, and the rain is heavy.  Have you built your hut?  Your mind?  Use it now, at this very moment, to be objective in your judgment.

That sack of skin you inhabit, or those old fermented grapes you cherish, see them right now.  The market is no more complex, nor any commenter less bullshit then a sommelier.  See it for how simply it truly is.

Then observe how a farmer sells two train cars full of cantaloupe.  Now we can begin to talk about the movement of price.

When a market moves lower it is seeking information.  It wants to know where it needs to advertise price to entice a motivated reaction from buyers.  Once it does so we see an abnormal rotation.  Something like today’s in the Nasdaq.  However, the evidence suggests we have not done enough to thwart off the tide of supply.  Rallies are suspect and to be observed for signs of liquidation.  Until buying demand creates an event that sickens the lot of yous, the bigger punches are being landed by the sellers.

I side with the heaviest and most consistent puncher.  I sit on their back and hold the reigns as they buck and thrash.  Such is the life of following order flow.


Comments »

Let Us Have Another Go at This Market

Traders are coming into the week with the Nasdaq futures up a bit on this Columbus Day session.  The globex market opened Sunday evening and showed some continuation on Friday’s weakness which made sense considering how we closed on the low tick of the session Friday afternoon.  Prices began to recover their losses a bit around the time European markets opened up.  The economic calendar is a bit slower this week and back loaded, with the highest impact announcements coming Wednesday (Advanced Retail Sales, Fed Beige Book) and Friday (U of Michigan Confidence).

Turning first to the daily chart, we can see just how weak the market has been since the Alibaba IPO.  Correlation does not indicate causation, however, we also printed a failed Nasdaq auction on the day BABA came public.  Since then we cannot find a sustained bidder in the market.  Instead we continue exploring lower, like Columbus, in search of buyers.  I have noted the activity below:

10132014_daily_NQ

Becoming a bit more granular and observing the 15-minute chart, we can see how balance began to form at the start of October despite the failed auction and inability to string together two up days.  It was a violent form of balance dating from Oct 1 – last Thursday.  Friday we opened on the lower range of the micro-balance and rejected it, starting anew the discovery process.  I noted in purple how the market made a strong bounce and ‘rechecked’ the scene of the rejection where if verified seller control.  I have noted this as well as the key price levels below (dating back to June) and above:

10132014_intterm_NQ

I am in development of a new market profile chart this week, thus I will primarily focus on the intermediate term chart these first few days of the week.  I am also allowing Xfinity a second chance as I start the week after their linesmen and women demonstrated some of the highest customer service I have seen over the weekend.  Thus, I will be a bit hands off until the systems prove stable.

Comments »

Pain

The Nasdaq is busting through the floorboards as we head into the weekend and as I type the final round of margin calls are hitting the tape.  There are a few stocks left in the hot boys encampment but the majority are dead.

The only joy I have today is not buying anything. The only other joy I have is taking 3 scalps in the morning on the Nasdaq to earn a few bucks before the severity of the market decline became too much of a distraction to continue.  Trading is a brute force endeavor.  If you are not mentally ripped then prepare to be torn to shreds.  When statistics became way out of whack and this week’s drawdown on my portfolio set in there was a bit too much distraction to continue ‘chipping away’ at the futures.  So I began checking in every half hour on my positions and stopping out when my levels were hit.

YELP died on me again.  And ZU died.  A piece of my never expected ZU to work.  I was tasked with managing this position longer than I originally anticipated.  When my illiquid weekly option could not be sold for fair value, I took delivery of the shares.  It was like being on spring break and getting fresh with a nice lady at the club only to later find out she’s staying at your hotel.  Now you have a vacation girlfriend.

In other news they’re beating Twitter down today.  It managed to sidestep the bulk of this downdraft before deciding today was as good a day as any to ‘catch up’ to the demented herd.  Alas, who am I to call the herd demented?  After all, they are trampling over my limp corpse into the weekend.

Assets are dead, you need all your money allocated to the value of volatility for this extra VXX Halloween.  I am short on advice today folks.  It is my only short position.  I will be scrutinizing the market and my trades and my very methodology this weekend.  Fortunately, through risk control, I live to fight another day.  I hope you can too.

PS – bless you AT&T, you have been my shoulder to lean on as Xfinity fails into the sleepless weekend.

Comments »

Keeping Matters in Perspective

Nasdaq futures are lower this morning on heavy volume and an above average range.  The selling started not long after cash markets closed in the USA and it made an aggressive rotation between 3-5am.  The economic calendar is quiet as we head into the weekend with the most significant events being various Fed members speaking at 9am, 1pm, 2pm, and 3pm.

The Nasdaq is the weakest index this morning, but before we get too far ahead of ourselves, let’s have a look at the monthly volume profile chart to have an idea of where we are trading.  Imagine you were driving from New York to Las Vegas.  Being a resident of New York you are familiar with the roads you need to take to reach the major interstate.  Once on the highway you can use a national map to guide your course.  Once you enter the state of Nevada you would switch to a state map and once inside the city a city map and once inside your casino perhaps a casino map.  The monthly volume profile is your national map.  As you can see below, we are still trading above the largest volume distribution of August.  When we went for a rally in August we left behind a poor structure which the market is now retesting.  The current pocket we are trading in had decent price memory in July, but just above us (the two yellow lines) there was little-to-no history until this month.  This is settling unfinished business.  Price could still head lower but at the least we know we are coming into some solid structure:

10102014_monthlyVP_NQ

Turning to our state map, the intermediate term timeframe, we can see that the last time we traded down at these levels was back in early August and when we did, the region just below our current swing low was traversed rapidly.  The initial surge out of August swing low left a gap behind.  The gap-and-go was strong support when it happened.  We had conviction in the long at the time because of it.  Now we are back here, and the area becomes a candidate for retest.  This does not mean it must happen, however we have an expectation it will and if instead the market cannot then we can see the other side, or buyers, emerging.  I have highlighted this gap and other key price levels on the following volume profile chart:

10102014_intterm_NQ

We are currently priced to gap below yesterday’s range.  Any time the market opens outside of the prior day’s range we know prices are out of balance.  For a moment yesterday we thought balance may be forming however this open suggests we are still discovering value.  Pulling up the city map, I have highlighted the short term levels I will be observing on the following market profile chart:

10102014_marketprofile_NQ

Comments »

2014 Breath Holding Contest

David-Blaine

Fight, flight, and freeze.  These are the three primal responses which can be triggered when you feel threatened.  They are formulated by the limbic system of our brain.  It is much more powerful that your logical mind and is the force that can drive an otherwise normal person to smash a villain’s skull into pieces if they were to perhaps threaten your child or favorite territory.  Ordinary people are capable of extraordinary and sometimes disturbing feats when put under threat.

Somehow, the market, a mechanism of pricing commodities and other assets has the profound ability to activate our limbic system.  We are all here to make money.  There is no question about it.  Nobody is managing their accounts for the thrill of it.  If you are, then goodness, may I suggest auto racing or biking?  The problem is, money provides security and other luxuries.  If you take a trade knowing you are right, then when it does not work in your favor it causes a threat to your ego.  This is very much a force in trading.  Now your ego is theatened because you knew you were right and maybe your were even a bit of a brag about it. Perhaps you start having a conversation or two with the voices in your head, your limbic system is engaged and you are in the back seat. Said another way, you are like a small man pulling on the reigns of a giant elephant.  This is how sometimes you can look back on a trade and say, “how did I do that?  Was that even me?”  Trust me, I can recall this feeling very personally, I have lost 10s of thousands of dollars in profits this way.

Here’s what I know—I will always have an emotional response to the outcome of my trade.  I must put risk in place before entering any position and stick to it.  Once the trade is on I know it will take most of my energy to keep myself in check and let the market prove my hypothesis.  You need to work on this more than you need to work on your technical trading skills.  90% of this game is mental.

I set up all of my trades well in advance of this fast market.  I took no action today.  Yesterday’s only action was buying YELP.  Should I have sold YELP today?  Absolutely not, it has done nothing wrong even while the markets take another beating.  AMZN, I am still with it.  It looks fairly close to being wrong, but is it wrong yet bro-sis?  No.

The PPT Breadth, one of my cold, dead data points on the market, had its lowest reading of the year today.  Nasdaq cumulative delta (net of trades executed at offer– trades executed at bid) was red, but it was worse on Monday.  I have little data snippets which suggest we might see some sort of reflexive-type bounce soon.  Therefore, I wait these suckers out, one false breakout after another, waiting for my proper goddamned moment to clean up my book, for fuckedsake.

A good bull market never pulls back to let dippers in or shorts out.  Flip that idea on its head and you have our market since the day Alibaba started trading.  Take out a 30 minute chart of the Nasdaq and compare it to BABA and you will see what is killing this market.  We are being liquidated upon, broad scale, bulls.  This is not the time to be heroic and averaging down down down.  Steady you mind and breath.  If you must capitulate then make the market work to take you out.  Do not simply folly out because of fear.  And don’t be a hero either.  Just let the wave take you and spit you out.  Then start swimming.

Final thought-if you decide to switch your internet service provider midweek, keep your old service running.  If I did not have the mother ship wired up with ATT and Xfinity I would currently be Xfinifucked.

Comments »