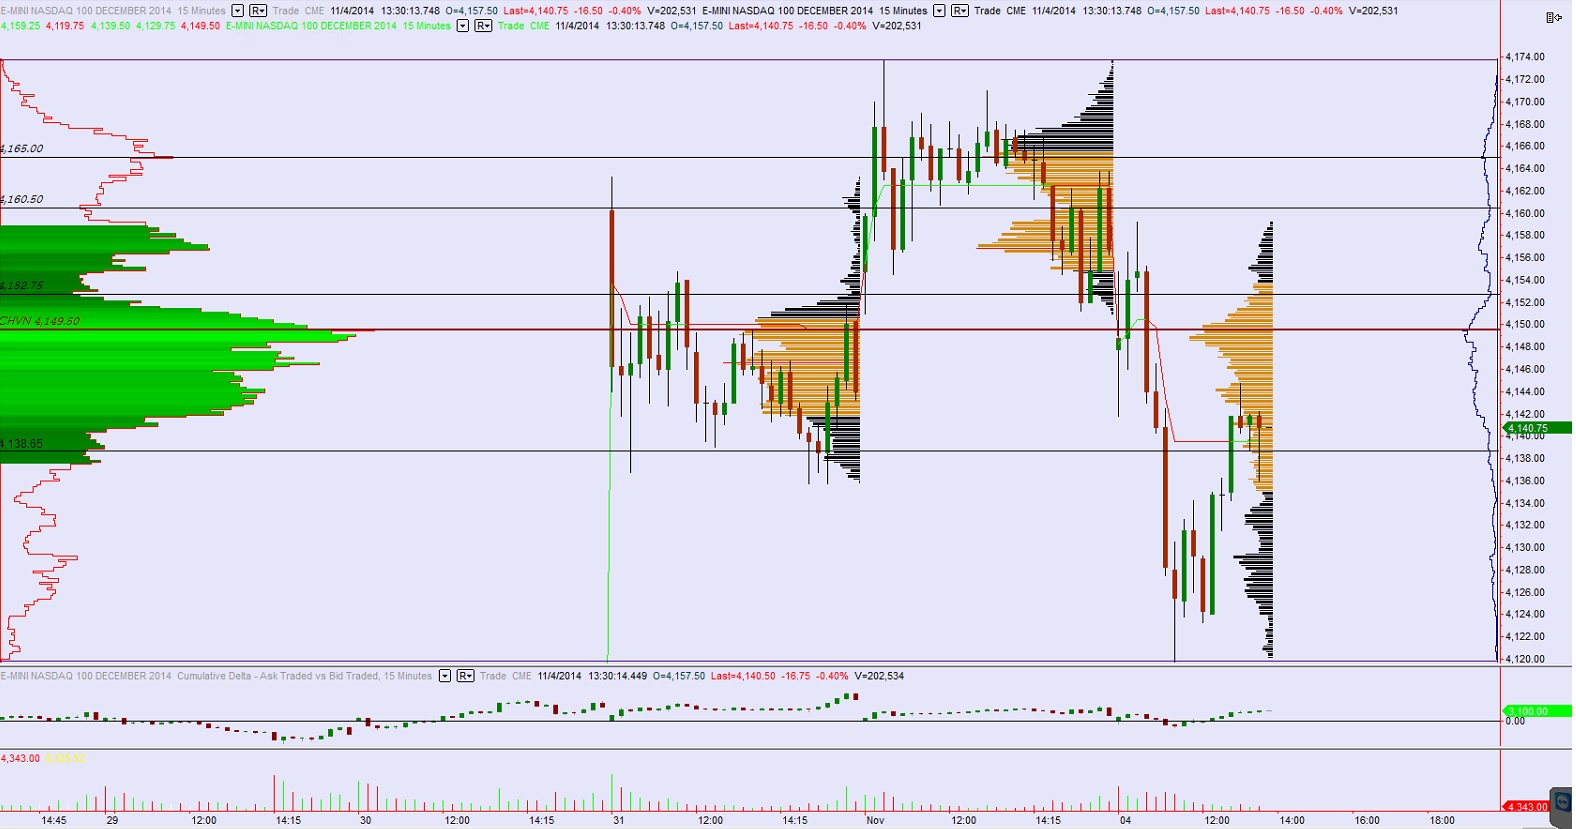
Below are the levels I will be observing as we gap higher into Monday’s range:
It is quite difficult to call out futures day trades in real time in a product like the Nasdaq. Even on slow days the product is fast. It trades thin and slips around like it is running on marbles. These characteristics lend themselves well to order flow scalping, especially if you are not attempting to work too much size.
The trades are 80% preparation and 20% execution/management. All of the statistical studies allow probabilities to emerge intraday. The risk management rules allows trading to occur without the distraction of focusing on your money. The morning context reports define areas of opportunity and expectation. The opening swing gives us a sense of the dominant timeframe and how they are likely to behave.
You cannot simply step in front of the market and place a limit entry at a price level from your homework. At least, I have found it unsuccessful. Instead I wait for a bit of information. Information is expensive in this business, but let me show you my favorite way to trigger on a level. This was the morning’s primary expectation/hypothesis:
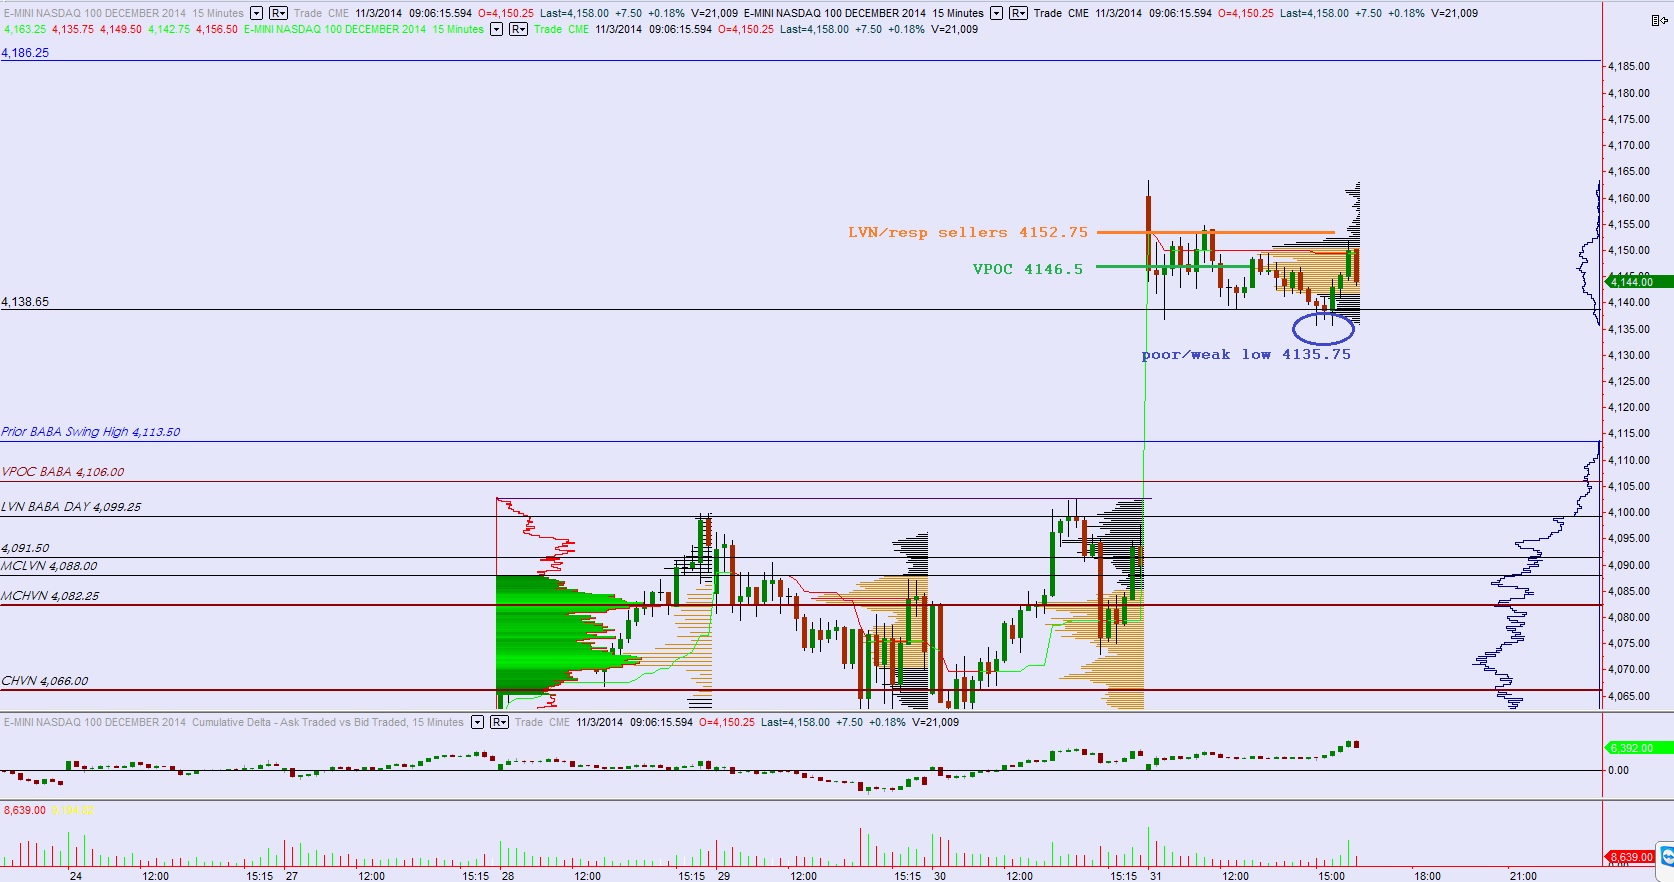
“With the market set to open inside of Friday’s range my primary expectation is for buyer to attempt to test higher and close the overnight gap up to 4156.75 before finding responsive sellers who defend the LVN zone from 4161.25 – 4160.75.”
We never traded up to 4160.75 but there was still a simple way to manage an entry into the trade. In fact, it was the only futures trade I took today as I have been a bit hands off this week. I call it the mid trade. I do not need to call tops or bottoms to the tick to make a career in trading. The money is in the middle.
The market has a certain harmony to its movements. For instance, the most common rotation in Nasdaq futures is 4.25 points. Anything larger than 4.25 points draws my attention because it suggests actual activity, not just noise. It can be difficult to see rotation size on a time-based chart which is why my trigger chart prints renko bars.
Below is a picture one of my most common trade-types. It is a no frills way of assessing and trading the secondary wave after a rotation greater than 4.25 points. See below:
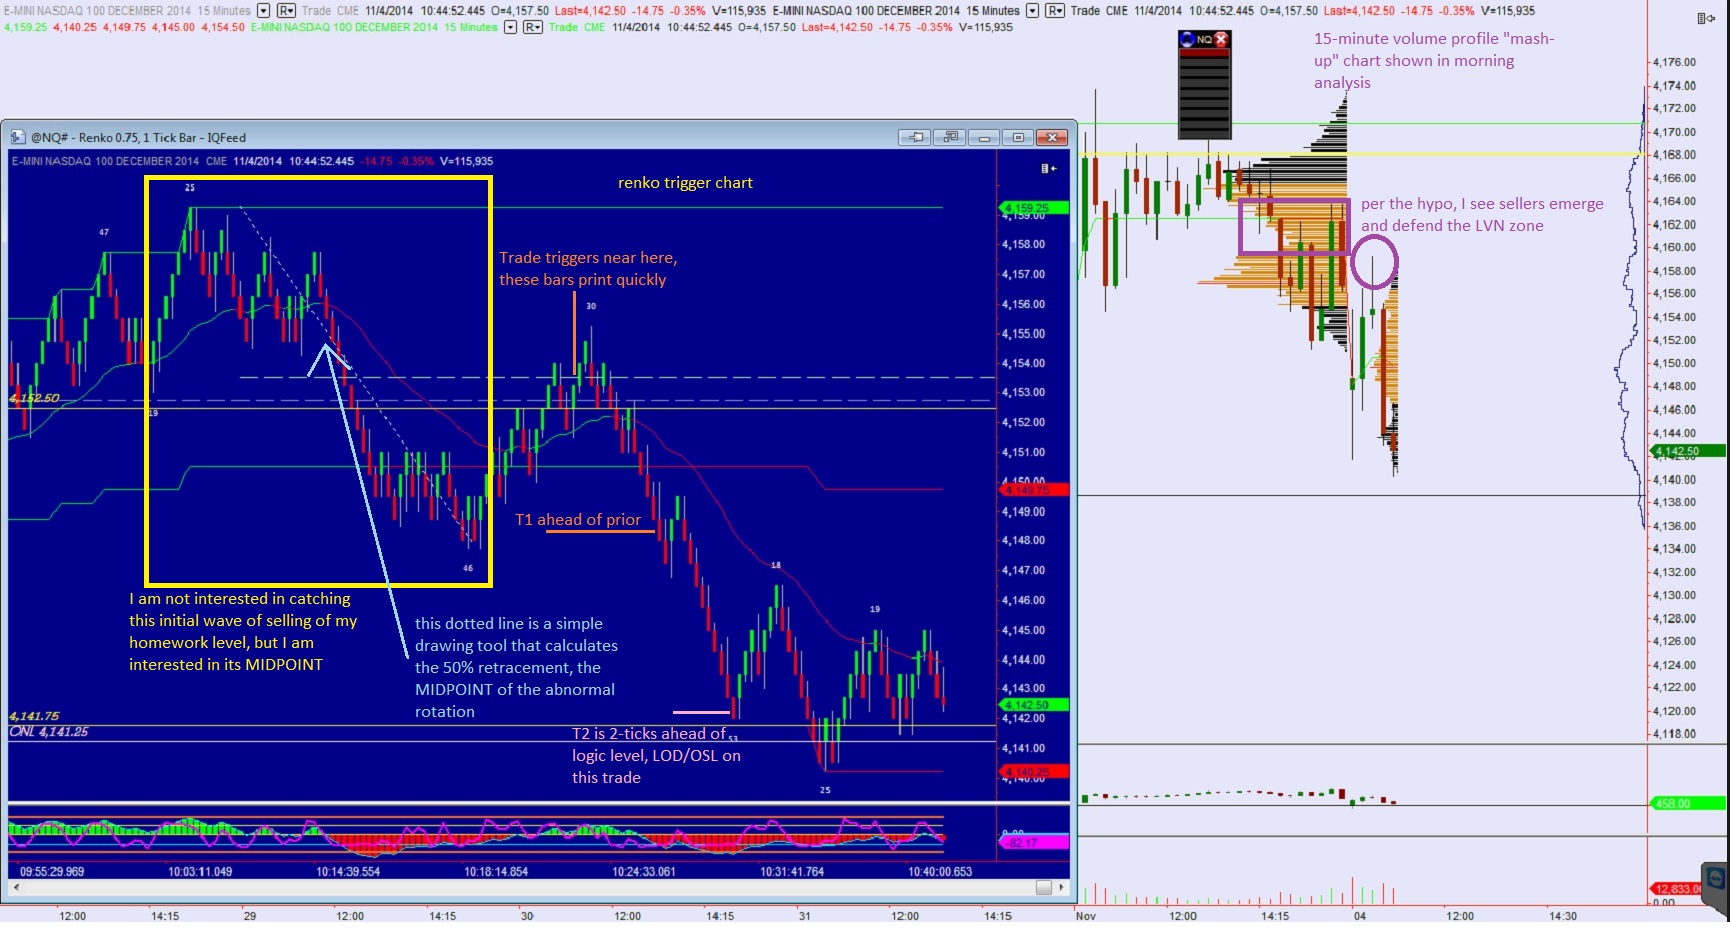
This post is not intended to make trading appear easy. I insist it is not, however it needs to be simple. The midpoint is simple to calculate, simple to run studies upon, and simple to identify and execute upon real time. I use it across many timeframes and asset classes. You should too.
Homework level, context, abnormal rotation supporting homework level, trade management. Eventually a third unit will be added to this trade and could have been a rider to take out the “weak low” I have been highlighting these last two mornings aka a hot little context piece.
Comments »Nasdaq futures traded lower overnight in a normal manner. The largest blocks of order flow were to the sell side and as we approach US trade prices are trading below Monday’s range. US Trade Balance numbers were lower than expected at 8:30am and received a somewhat muted response—there was a bit of responsive overnight buying shortly after the announcement. We have Factory Orders set to release at 10am.
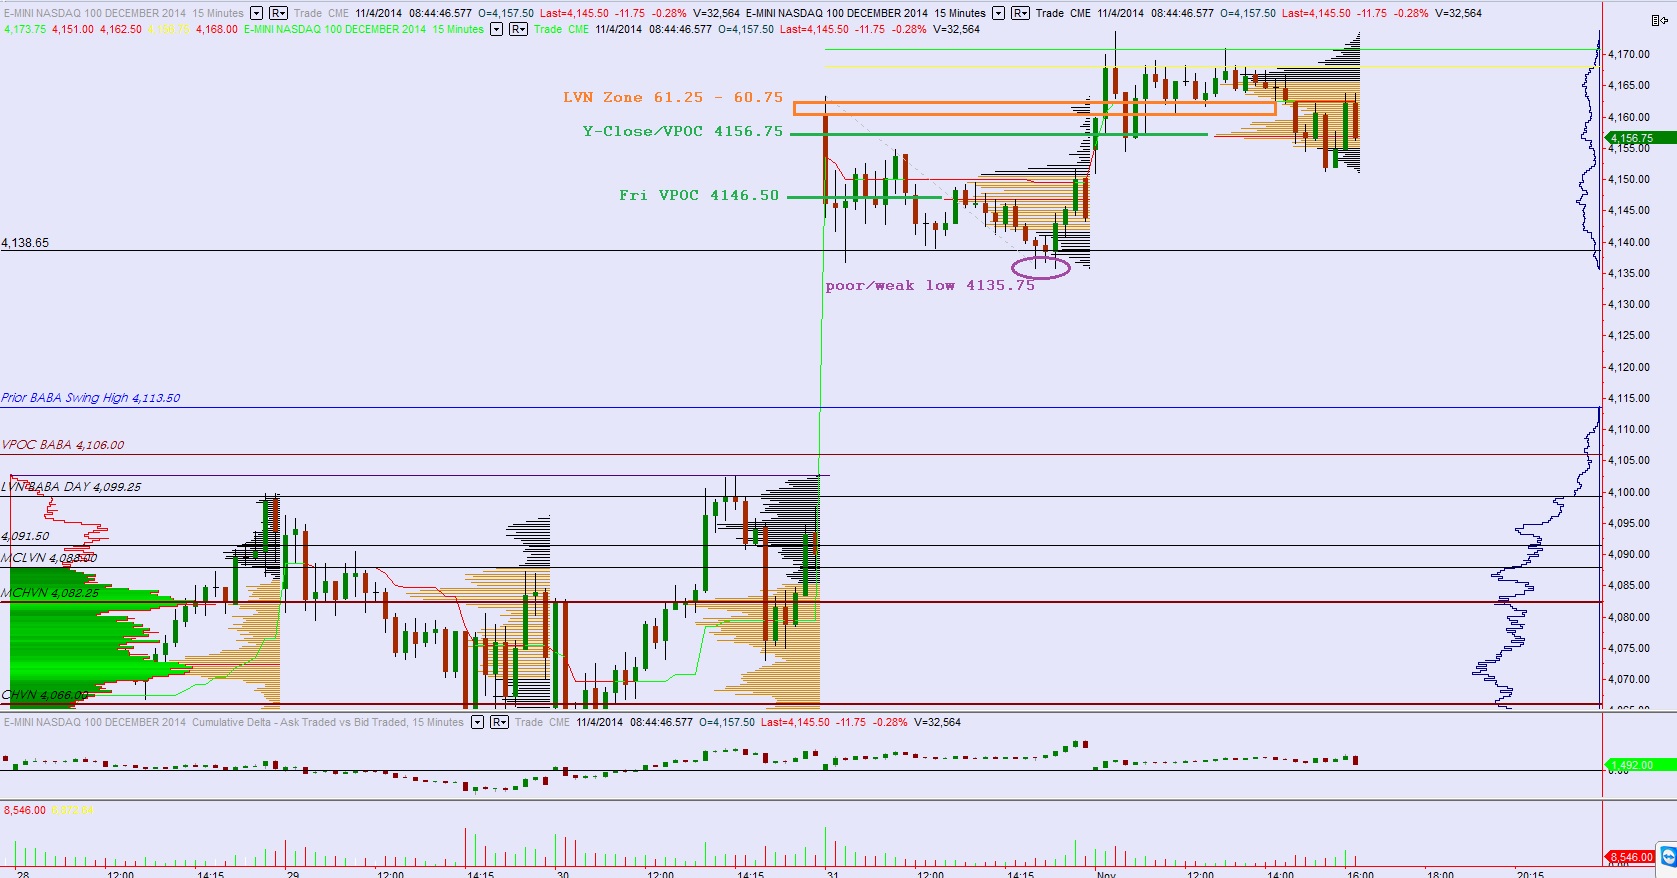
Coming into the new month traders had to come to terms with a large gap higher left behind on Friday’s trade. The Monday trade also went gap up and we spent the entire session unable to close the overnight gap which led to some hesitance to take intraday longs by day traders. With the market set to open inside of Friday’s range my primary expectation is for buyer to attempt to test higher and close the overnight gap up to 4156.75 before finding responsive sellers who defend the LVN zone from 4161.25 – 4160.75.
I am looking to see how aggressive sellers become and whether they are able to push prices below Friday’s low and if yes whether buyers are found leading to the formation of intermediate term balance or instead accelerate suggesting a sharp reaction of both Friday’s and Monday’s prices. The upward progress made these last few weeks is stretched and whether the market begins accepting these prices via a slow and sideways balance or instead returns to the fast pace of October will be an important clue to the overall market sentiment.
I have highlighted the key price levels I will be observing on the following volume profile chart:
We all have our reasons for voicing market opinion and sentiment to our peer group, the key is knowing your purpose. This is your boulder to lean on, especially when you turn out to be wrong, which we all inevitably will at some point.
I am here to figure out trading on a few levels, anticipatory swing trading and order flow obliging scalping. These styles suit my person after trying many. I also consider these styles to offer the most bang for the resources I have available.
This is a one man show for the most part. That means I have to journal all these trades, plan all these trade, execute all these trades, and measure the effectiveness. Methods have to be worked, reworked, and occasionally abandoned. This amorphous nature of earning money from the markets is what attracts certain types to the arena.
When I discover an idea that helps me perform better you are the first to hear about it because there is no risk of evaporating my edge. It is natural, like the laws of physics.
Check back this week for some of my latest styles.
I am still playing this environment slowly. The highlands require careful foot placement, else one may slip and return their person back a few weeks. I rotated money out of RWLK and into the crazy chicken. My only other considerations this afternoon are sales.
Comments »Nasdaq futures are flat ahead of US trade after a benign session of trade. Volume and range are both below the 1st standard deviation of normal which is even more abnormal for the Sunday/Monday globex session. As we enter a new month of trade the markets are working through earnings and we have a few economic events on the calendar.
Coming up today at 10am is ISM Manufacturing. Tuesday premarket we will hear US Trade balance and at 10 US Factory orders. Also after hours Tuesday, BOJ Governor Kuroda speaks in Tokyo and the verbiage will likely be scrutinized after last week’s stimulus news. Wednesday premarket we have ADP Employment change which has been less consistent than in the past followed by 10am ISM Non-manufacturing Composite. After hours Wednesday are BOJ October meeting minutes. Thursday premarket we have ECB news including rate decision and a Draghi press conference. And Friday premarket we have monthly Non-farm payrolls and US unemployment rate.
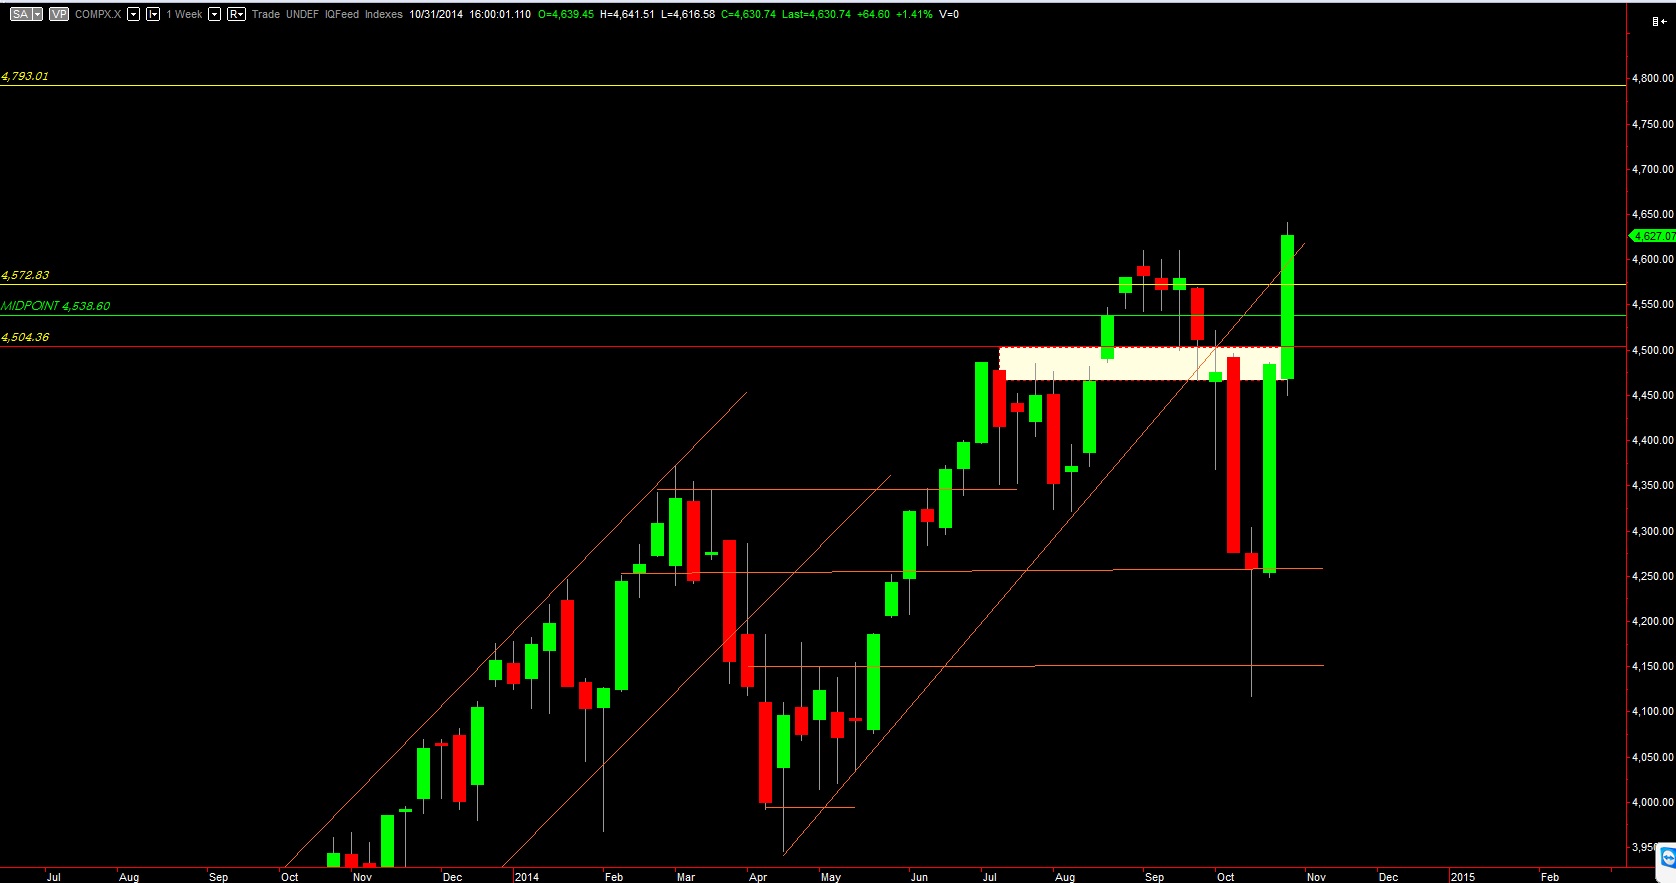
On a weekly chart of the Nasdaq Composite we can see the sheer size of the green candles printed the last two weeks. These two candles suggest the hammer candle printed three weeks back is confirmed as a short term low. Even if it was not, the distance traveled means sellers have their work cut out to revert long term control into their favor at the best or into balance at the least. For now, the long term time frame is bullish. Note also how we are back trading above the ‘gap-zone’ from 2000:
On the shorter term, we can see how the market spent three days building balance before the gap higher on Friday. This balance is best seen as the green volume profile positioned to the left. I have noted some measured move targets which, oddly enough, one of the targets from Friday morning ended up being an area where the market found support. I have less conviction in these levels than auction/volume profile levels, but they do serve as a frame of reference when we trade in an area lacking price history. I have noted these levels and a few other observations on the following volume profile mashup:
Comments »
I was never a big fan of pole fishing. It’s slow and I like action. Over time I suppose I may gain an appreciation for it but in the short term I prefer cast netting. It requires an athletic throw and snatch and puts stubborn biters in a more vulnerable situation to end up in my cooler.
They don’t have to take the bait. They become discombobulated and panic instead.
My book has a similar look and feel too it. I could describe each position to you but that would be very time consuming and I have pressing matters to attend to on this hallowed ween.
But I will disclose my risk profile. It is long, friends, again, here atop the highlands. It was long in the lowlands too. It has always been long (extra Grady).
75% of my port is positioned amongst common stocks of various industry. Just a tad over 5% is in November call premium. I want more, gentlemen, and will exercise my right to speculate in the path of power and rotation.
Now I must make haste to new elevations.
http://youtu.be/7Scc3w4jkp8
Comments »Nasdaq futures were thrown out of balance overnight after the Bank of Japan announced they were expanding their massive stimulus package. The reaction was large enough to put the index to new swing highs meaning participants are coming to market this morning at prices dramatically different from the closing bell. The volume and range on the globex session are beyond normal as you might expect putting us in pro gap territory.
On the economic calendar for today we have Chicago Purchasing Manager at 9:45am and U. of Michigan Confidence stats at 9:55. We are also in the thick of earnings season as the month-end trade takes us into the weekend.
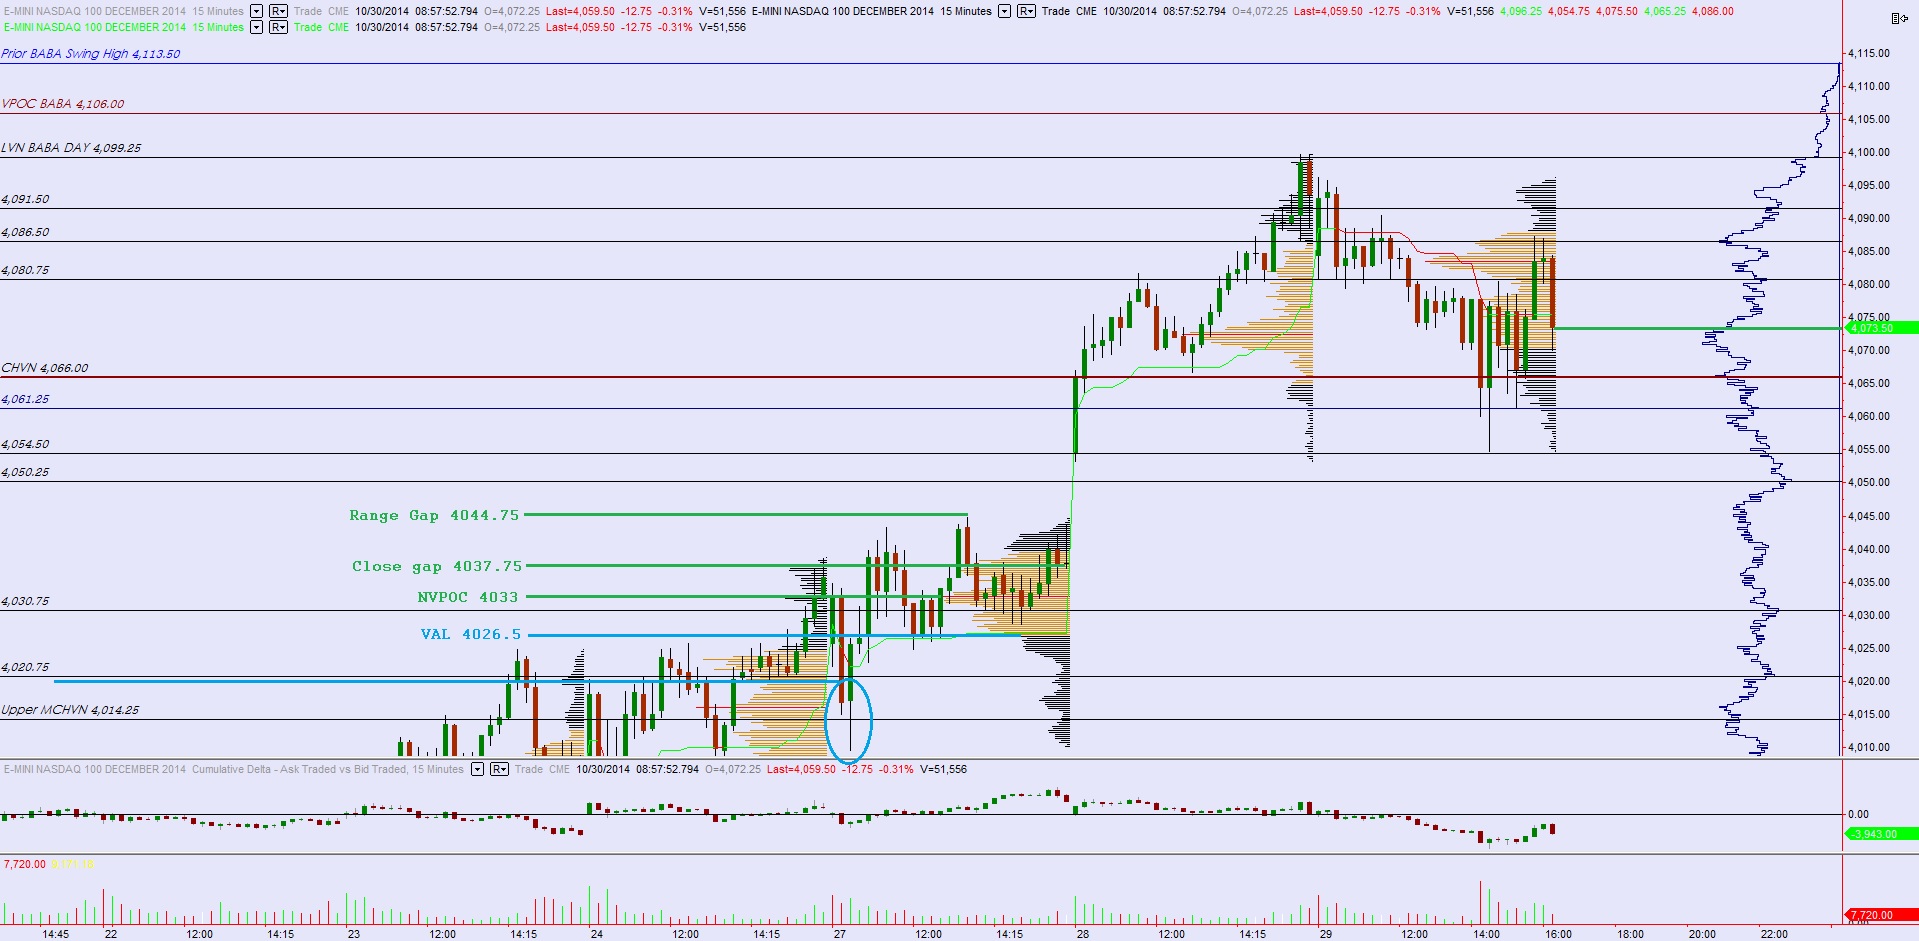
Prices at the open will be trading levels unseen since March of 2000. Given the lack of price history available, I need to work using available support levels and measured move targets. I have noted the measured moves and support levels I will be observing on the following volume profile mash up chart:
Believe me, I am on these charts looking for responsive sellers too. We started showing signs of finding one yesterday, but we also had a firm grasp of the third reaction, remember? There was a strong rotation down today, and it fizzled away, poof. There was a moment today where you could have a short bias, it came and went by 11am. There are few signals better than a failed hypothesis, IMO. It reveals the other side.
It is hard to initiate fresh index risk up here, which is why you hunt out a chart that is still basing along or not too far from the launch zone. When the long and intermediate term trend are up, you have to be nimble on the short side. You can be a short seller in this tape, I have seen it with my own eyes. But you need to wait for the big sellers to show up.
Momentum pockets are narrow and not every stock is a winner by any means. The market structure is overheating. There are still losers everywhere, especially if you dabble in the dark arts of short term duration. Twitter found a responsive bid today, about a buck before I wanted to add a slice. Eager buyers front ran my logical level and I could not chase. I bought FB yesterday afternoon based on 3rd reaction analysis and that was a dud, I cut the loss early.
I am not crushing right now, mind you, I am nearing where I left off before the great OPEX rout of 2014. Playing it old school, with these common stock positions son. I am trading well though. I traded well through the selling too but my teeth still were kicked in, it’s the nature of speculating.
Accept it, tie risk to every single trade you make. If I put you on the spot, right here right now, and ask you where trade XYZ is wrong, I expect an answer mother fucker. That is step one, put down the opium pipe and face the risk profile you have established. When you lay all the numbers out you might not like what could happen in the event of a goose hunt.
Know you risk, know you risk, knowyourisk.com
If it didn’t matter I wouldn’t annoy you all with it.
It is a pillar, you will lean on it, and it will give you confidence to engage these markets.
As for hoping the lack of Fed intervention will lead to another rug pull, they’re still intervening just in bigger and quieter ways. You don’t take the training wheels off the bike and then push the child into the road, you run alongside them whilest smoking cannabis.
I see the markets broke as I was penning this piece, very well, I must return my attention to work.
On a lighter note, Michigan is dreary about this time. If your land is also becoming dark and cold, why not join me for a few cocks and laughs at the First Annual iBankCoin Investor Conference? We can discuss auction theory live in person via aggressive hand gesturing. A true break from the click clack of the keyboard, yes?
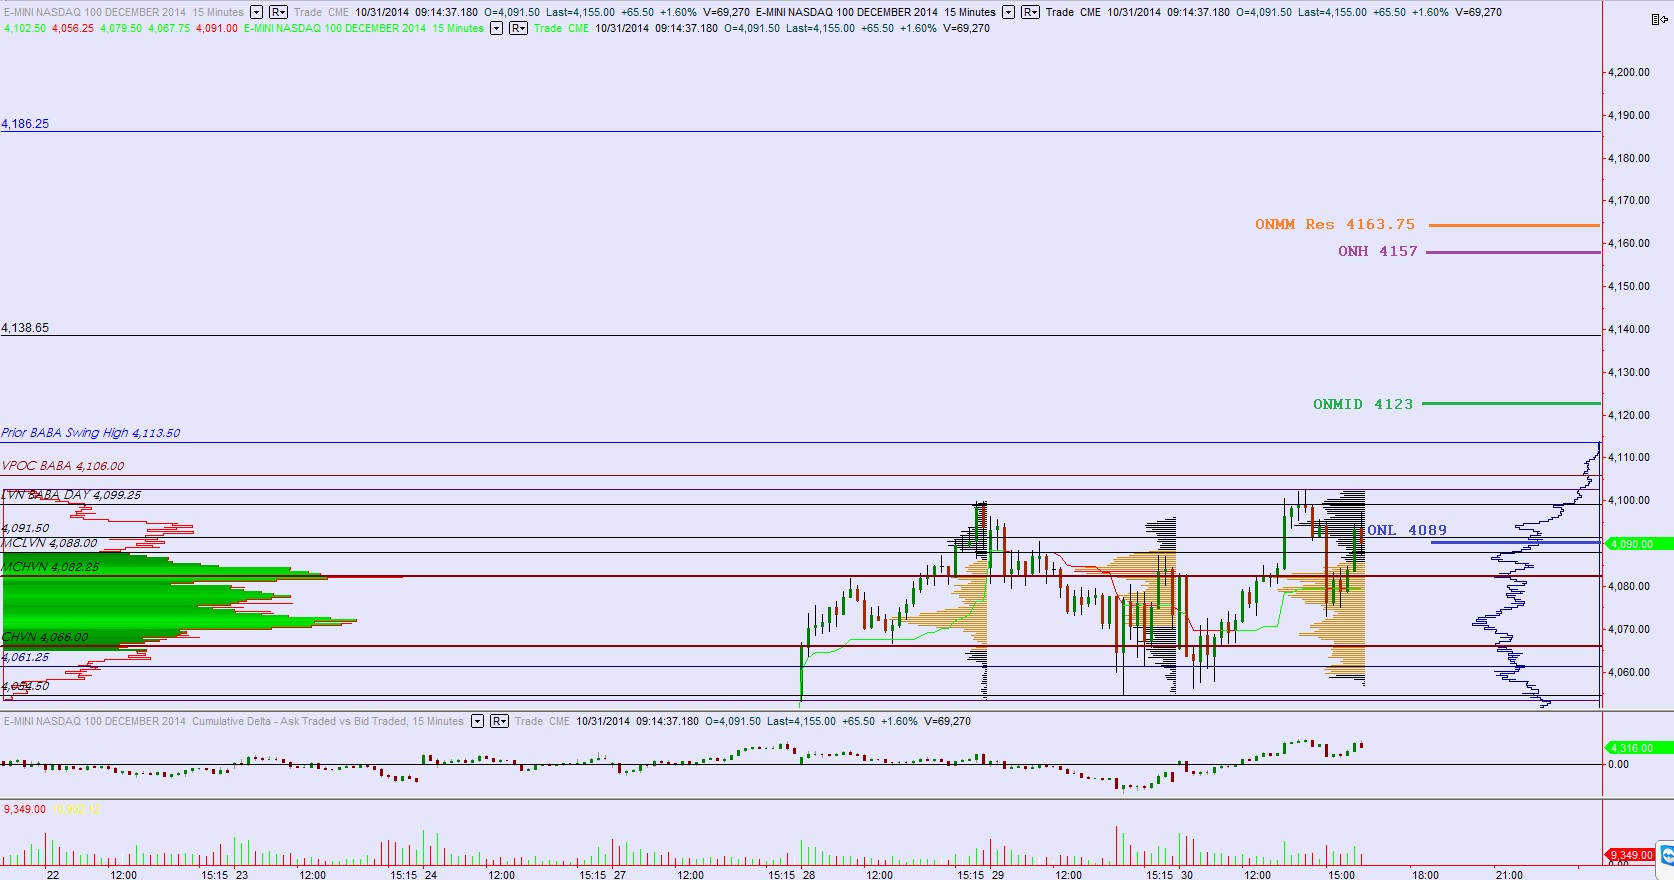
Comments »Nasdaq futures started to drift lower overnight shortly after we heard data on German unemployment early this morning. The resulting range on the entire session is still within the 1st standard deviation of normal although volume picked up to levels we have not seen since the fast down markets of a few weeks ago. At 8:30am the US quarterly GDP stats were released along with jobless claims and personal consumption. GDP was better than expected in the third quarter and the other data were worse than expected and the net reaction was an aggressive responsive buy taking us nearly to the midpoint of the overnight session (4064).
The overnight session managed to press into Monday’s range before finding responsive buyers. It will be interesting to see in the cash trade hours whether a retest of this overnight low occurs and how it is treated. Since the gap higher Tuesday morning I have noted that we are provided with a unique opportunity to gauge demand. How the market trades relative to this gap, mainly if buyers sharply reject us from Monday’s clean balance, will be a clear clue of short term sentiment.
I present only the volume profile mashup chart today. Notice how well recent action has adhered to the price levels noted on the chart. This is a clue that the intermediate term and short term time frame participants are the primary drivers of market rotation. If instead we begin seeing large moves which ignore or steamroll these levels, then we know an even higher time frame is participating and it makes sense to step out of their way. I made no adjustments to these levels from yesterday, they are still key reference points as we go about trade:
I always have. Even as a child I recall my third year being my finest, it was such an enlightening age where the fog of sounds all started to become words and the words flowed off my tongue like a Shakespearian thespian. I could ride a bike without the trainers for the first time. Everything clicked.
That year has stuck with me and shapes many of my trading methods. As much as it may seem ‘top down’ to rely on something divisible by three, I have gone the opposite direction, working raw stats to extract probabilities, and quite often I return to the number three.
The 33 ema, for example, mimics VWAP surprisingly well. And a daily 99 ema, oh the jump you have on all the traders working the 100 sma is staggering. I leave them in the dust 9 out of ten times.
When a major news piece hits the market, like today’s 2pm Fed, I sit with laser focus and carefully indentify each reaction I see. The first reaction is usually simply, the second can be a bit slippery, and the third is where the babies are made.
The third reaction today took a strong bit of deliberation but ultimately was higher. It was by no means gregarious and certainly nothing to hang ones hat upon. However, here I was, sitting here, and I might as well make myself useful and share this information with any reader who had more pressing matters to attend to from 2-4pm. Corporate Raul would saw his leg off to have a source like me. I write for corporate Raul and street Raul eating MacDonald soda pops from the trash can.
On the Net, the Nasdaq printed an inside day verse yesterday. It shows a slowing of the auction higher. We found some responsive selling, but the prior day lows held. Tomorrow, as many of you know, is Thursday and the day after is Halloween and then a spooky weekend and then BOOM, a new month, new money to put to work.
So ask yourself, are we set for another month of outflows, or will the mutual funds put on their pony costumes and serve up a proper mutual fund Monday, new ATH and all?
As always, TBD.
Comments »