The economic docket features several heavy hitting events for the week ahead. Starting with today at 10:30am when the ECB announces Covered Bond Purchase plan. We also have Dallas Fed at the same time. Premarket Tuesday we have Durable Goods Orders being announced followed by Consumer Confidence at 10am. Come Wednesday afternoon we will be hearing several data points from the Fed including Pace of several asset purchasing programs, QE3 Pace, and the FOMC rate decision. Thursday we hear Q3 GDP out of USA. With all of that in mind, it behooves the speculator to turn their attention to the real information by observing our recent price action and volume behavior.
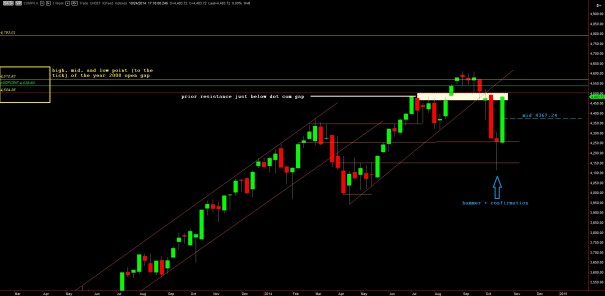
First let’s return to a weekly chart of the actual Nasdaq Composite. Most of our charting of the Nasdaq features the front-month future contract, however the index itself often offers interesting and relevant action points. Before volatility came into the market we saw price grind up and through the open gap left behind 14 year ago during the dot com bubble. Once filling the void, prices printed a series of doji-type candles which signal indecision. The final doji was long-legged then we began heading lower. There was a responsive bid during most of the process which can be seen as tails on the candles or ‘shadows’. However, three weeks ago we printed a large red candle down that closed on the lows. Then two weeks ago we print a massive hammer candle, then last week a huge green candle. The question now is whether the hammer-plus-confirmation allows the long term uptrend to continue. As you can see price has come back into a prior area of resistance. I suspect we see the market struggle to go higher at the least. What bulls do not want is a fast rejection down—especially one that gives back 50% or more of last week’s gains. I have noted these observations below:
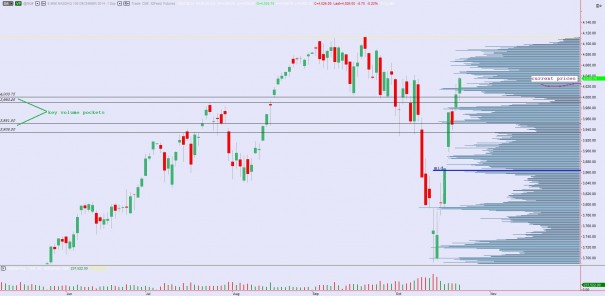
The most recent and key takeaway from the above chart is that it is long-term bullish and the recent action printed a hammer reversal. Thus, now coming to the daily chart, we know we want to know where the midpoint of that move is and how the volume structure looks between current prices and the mid. I have noted the mid below as a solid blue line. Above there are two distinct valleys where volume drops off significantly. These can be fast regions for price action. If instead price struggles to traverse these zones that would be an indication that buyers are sustaining control on the day-to-day timeframe. I have noted the brackets around these low volume regions and other observations on the below daily chart of the December /NQ future contract:
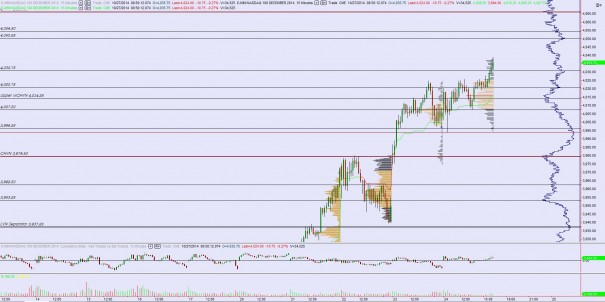
Finally, I have noted the key price levels I will be observing short term on the following volume profile mash up chart:
If you enjoy the content at iBankCoin, please follow us on Twitter


