iBankCoin
I turn dials and fiddle with knobs to hone in on harmonic rotations
Joined Oct 26, 2011
4,121 Blog Posts

Gold Per The Futures

A request has been made to assess the conditions of a certain metal, gold.  The following analysis is of gold and is conducted using the December 2014 Gold futures contract which trades on the COMEX.  I am using the complete trade data, not the regular trading hours, because this instrument tends to make moves outside of regular market hours.

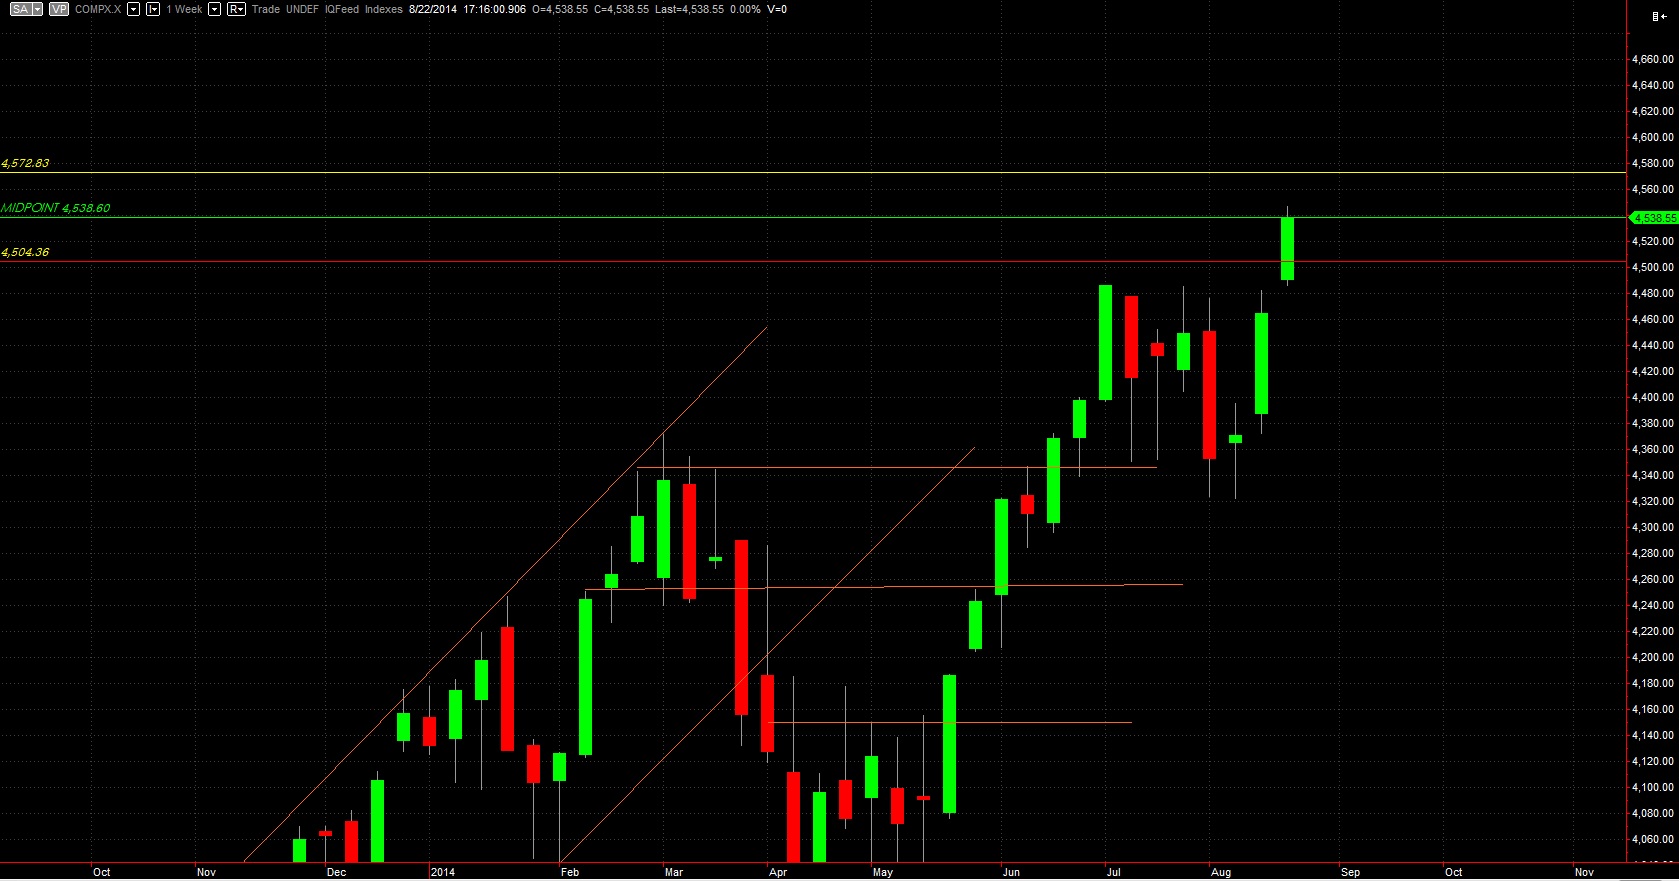
Long term prices are bearish to neutral.  Prices took a sharp move lower starting mid 2012 and accelerating during 2013.  Since then prices have been basing.

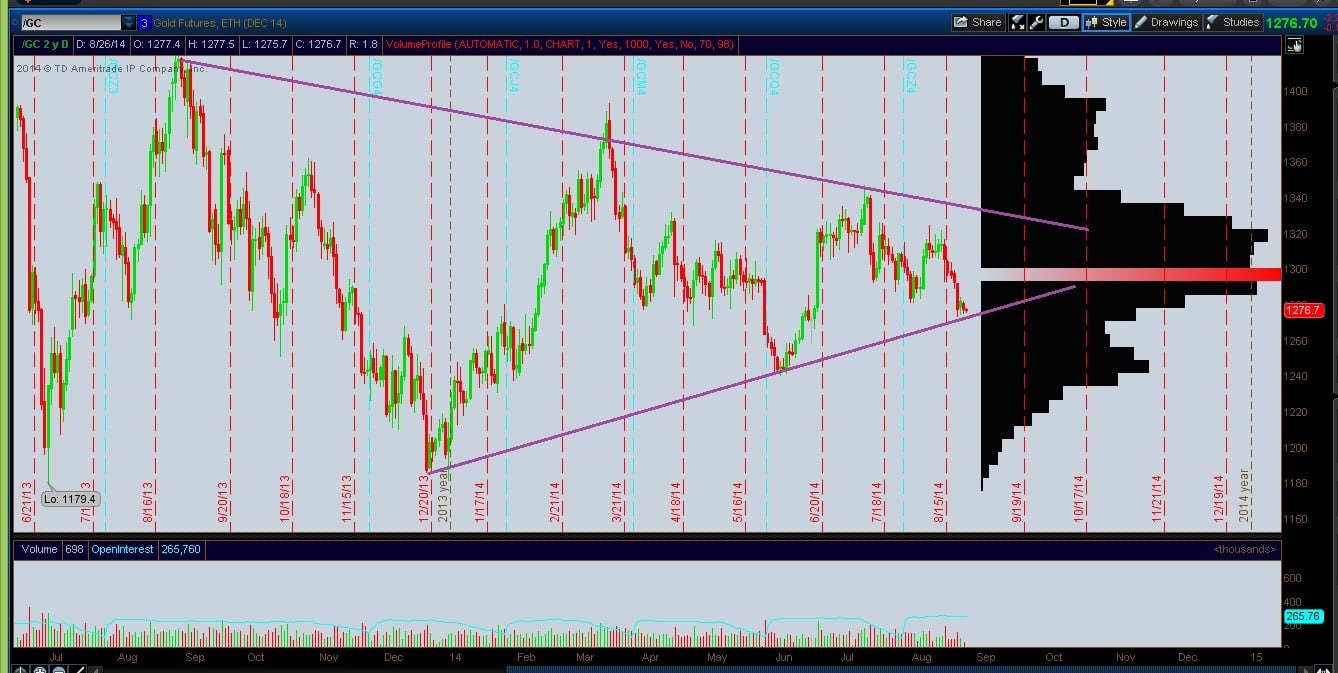
Intermediate term is neutral.  After an excess low printed in July of 2013 we began the process of balancing.  The balance is best seen on the following volume profile which dates back to about June 2013.  We can see buyers and sellers reaching a consensus of value on the intermediate term, and we are currently trading near the lower end of where one might expect to see buying:

GC INT TERM

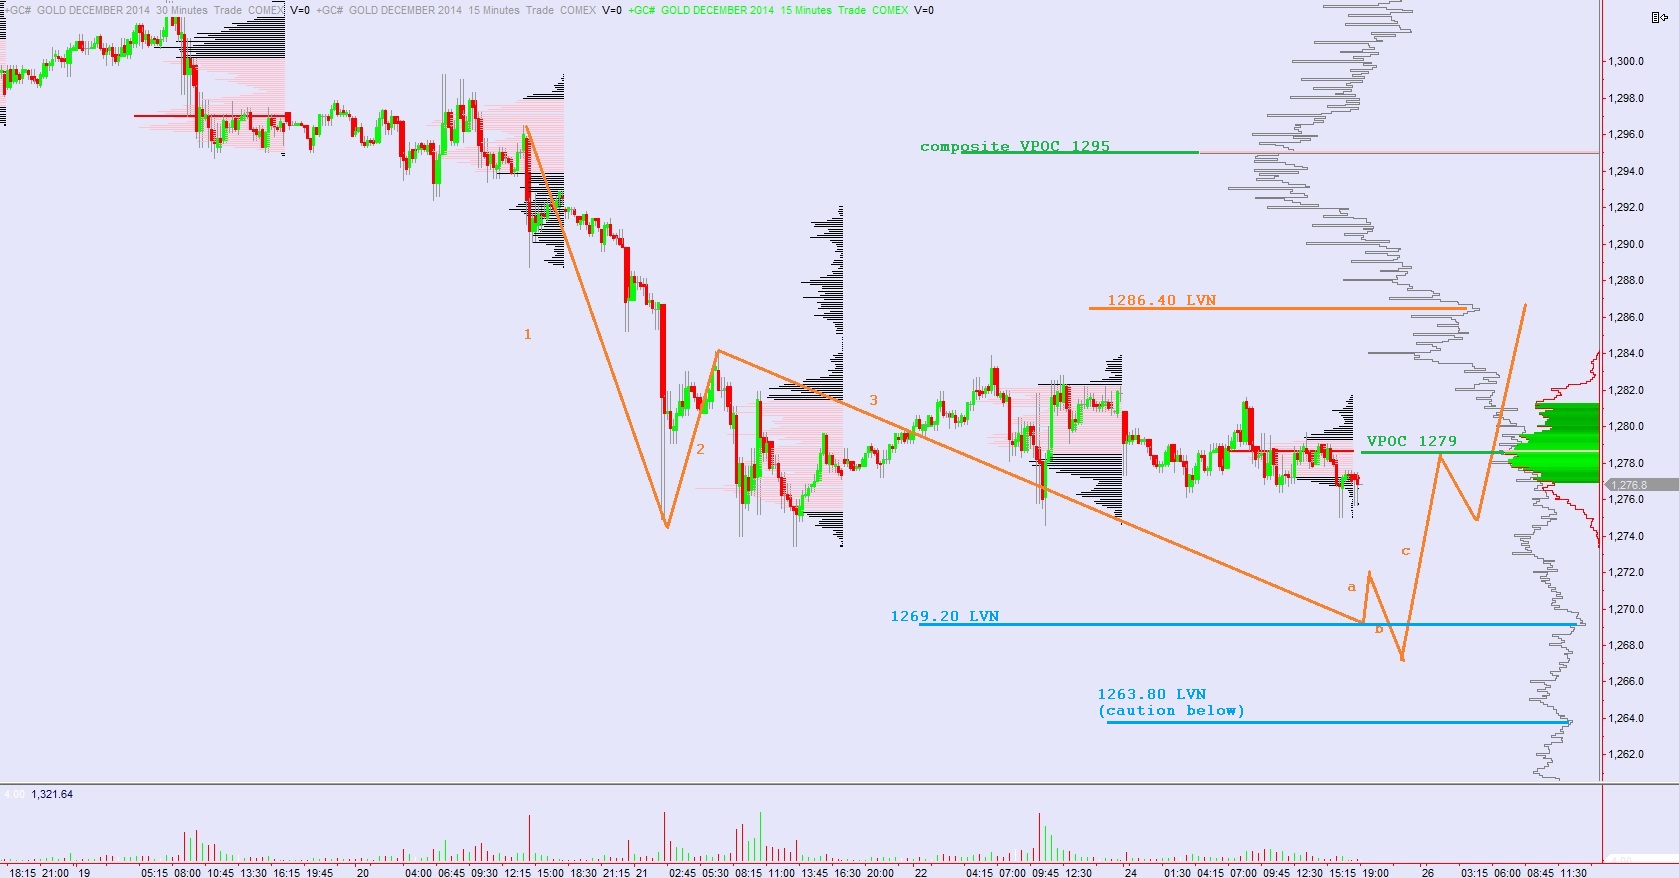
My current bias score is just a shade over neutral but not quite medium bull.  The volume is coming in a bit heavier to the downside over the last week.  However we do have signs of excess lows.  And even though the trend of the last few weeks has been lower, we have been essentially flat over the last 2-(almost)3 days.  If we are indeed coming into balance on the short term, then the micro composite VPOC at 1279 becomes a magnet with an even larger composite magnet existing at right about 1295.

If considering a long, one might be able to obtain a better entry by waiting for another lower low to complete a possible correction cycle.  This is very much a speculative roadmap, but I have highlighted my vision below:
GC_08252014

Comments »

Today Was a Good Day To Fly a Kite

Or ride a bike, or whatever it is that felt right besides being at your trading desk.  I took the cue late in the morning when two business calls received voicemails.  I opted for a 35 miler.  During this ‘free time’ you could avoid any angst which you might experience from a downdraft.

The key was knowing the daily context, and today’s context was ripe for a neutral print.  I will say my expectation was for a more vigorous revision higher into the bell.  Instead our VPOC shifted lower right near the close.  The move subsequently introduced a bit of selling into the marketplace during settlement.  However, with this introduction of doubt, I still consider it wise to give the benefit to the intermediate term timeframe until they have lost that privilege.  In short, today might have been the weekly high, the start of a correction while no one is looking.  But let’s give it a day or two to play out first.

On the day I did very little.  I bought some risk in ONVO and stalked EXK.

There were some clues we would go neutral, and if I was more actively stalking futures then I would have stuck around to participate.  The first clue was this poor low we printed on top of a gap higher.  Are we becoming so spoiled on the long side that we expect such low quality structure to sustain?  See below:

marketprofile_08252014_midmorn

Then there was the anything but normal range of the initial balance.  It was only 5.75 points wide, much more susceptible to a neutral print.  Hindsight, I could have hedged and earned a nice time of day entry.  For some reason, I instead took the signs as a signal to go outside and ride it out while enjoying the weather.  We shall see if that was frivolous come tomorrow, yes yes yes?  The market is the ultimate humbler.

Comments »

Gapping into The Week

Nasdaq futures are set to gap higher to start the week after a delayed start to the globex session.  Chicago Mercantile Exchange futures, of which the E-Mini Nasdaq is, usually open for trade at 6pm eastern on Sunday.  Yesterday the globex market did not open for trade until 10pm.

Just a bit after the open we have Markit reporting Composite and Services PMI.  We also have New Home sales at 10am and Dallas Fed Manufacturing Activtiy at 10:30.  Looking at the week ahead, we have Durable Goods Orders Tomorrow morning premarket as well has the House Price Index.  Consumer Confidence Tuesday at 10am as well.  Perhaps the biggest economic event of the week occurs Thursday when we have GDP numbers out for the USA.

On a big picture chart like the weekly composite chart below, we can see that we are currently participating in a price zone with very limited price history.  Back in the year 2000, we started the second quarter with a big gap down.  Before it could receive any resolution the dot com bubble burst.  Thus a price gap remained open for the last 14 years.  Now that we have finally reentered the gap, it only took one week to capture the “half gap” or midpoint of the open void.  This week I will be monitoring the progress of the auction and whether we are likely to fill the entire gap or stall out.  Either way, be aware of this big picture environment and how it could result in some accelerated moves:

08252014_Weekly_NQ

The intermediate time frame is buyer controlled.  After gapping higher outside of prior day range for five sessions in a row, the auction began to slow a bit Wednesday-Friday.  The slowing tape allow a semblance of balance to begin to form.  On Friday we attempted an early move from balance which at first found some responsive selling.  Later in the session however we negated that selling and ended the session near the highs.  Thus, although we saw the early signs of balance beginning on the intermediate time frame, it still has a bullish skew.  See below:

08252014_IntTerm_NQ

On a short term time frame we can also see the buyers in control.  Value continues to migrate higher, not just price.  This can be seen most clearly via the value area range relative to prior sessions.  I have highlighted the key levels I will be observing early in the session using the following market profile chart:

marketprofile_08252014

Comments »

Sunday Morning Stat Crunch

During the week long Market Profile webinar I hosted for the After Hours with Option Addict crew, I defined and discussed initial balance (IB) quite extensively.  This simple concept of noting the price range printed during the first hour of trade can be a huge help in determining market conditions early in the day.  The same can be said for the opening swing, only the opening swing interprets market activity even sooner, sometimes being established in less than 5 minutes.

One of the primary reasons for tracking the initial balance is its use in determining what sort of “day type” is occurring.  Another primary reason, the reason which is more actionable intraday, is that we rarely see a full day of trade without breaking either IB price extreme.  Therefore, if we manage to enter a trade inside of initial balance which is working in our favor, we can press that day trade and ride that winner a bit further.  Traders always emphasize the importance of letting your winners run because those few extra ticks you gain from a well managed trade can make a huge difference to your overall expectancy.

Nothing builds confidence in an idea like statistics and probabilities.  Therefore as an addendum to the weekly course, I have built out the relevant IB statistics for my product, the Nasdaq E-mini future contract.  I used five years of pure IQ Feed data to compile the following stats.  Some highlights:

  • We break initial balance 94.75% of the time
    • By 11:30 – 73.03% of the time
    • By 12:00 – 81.13% of the time
  • Normal IB range (69.87% frequency) is 11 – 24 points
  • Normal IB volume (66% frequency) is 40k – 75k contracts

And without further adieu, I present the data (looks familiar, yes?) in its entirety below.  Enjoy:

08242014_IB_breakSTATS

08242014_IB_range_histogram


08242014_IB_volume_histogram

Comments »

Half Gap Complete

Today’s move in the Nasdaq Composite was sufficient enough to push us to the halfway mark of a price gap we have been monitoring which dates back to early 2000.  When the dot com bubble began to bust we left a big gap open on between the months of March and April.  Can you imagine starting the second quarter of a year like that?  With a huge gap lower?  Quite the contextual development, to say the least.

Here we are, 14 years later filling the gap.  The question on my mind is whether the half gap will be enough for now and will be an aggressive entry point for sellers.  Otherwise we have quite a bit of upside left for a complete gap fill, see below:

08222014_Weekly_NQ

We did see a sharp responsive seller emerge this morning, and thus far their presence is begin confirmed.  To negate the selling wick which showed up today we need to press higher and sustain trade above our initial balance at 4055.25 on the September contract.  Keep this level in mind as we enter the afternoon.


Comments »

Bull Push on Pause Ahead of Fed’s Yellen

Nasdaq futures are basically flat after an odd overnight session.  There were no economic releases overnight but right about 2am we saw a big push by the sellers.  UPDATE: The overnight push is being attributed to 17 Russian trucks crossing the Ukrainian border without authorization.  The move has since been faded back up and in its wake we have an interesting overnight profile to aid our early context.  Have a look:

Overnight_marketprofile_08212014

Today’s price action could produce a large range as we have the risk associated with hearing from Janet Yellen, head of the Federal Reserve.  The market has demonstrated a consistent proclivity to move abruptly during such talks which is why it is reasonable to carry such expectations into today’s trade.  She will be speaking at 10am and just to keep you sharp into the afternoon, we also have Mario Draghi speaking at 2:30pm from the same venue.  These two central planners carry words which are paramount to market participants.  Keep this context in mind as you make decisions today.

You can see the market starting to pause this week ever since Tuesday afternoon’s rally.  Since then we have churned sideways essentially, with a slight upward drift.  The resulting footprint is balance with a blunt upper taper on balance which may suggest a bit of upside is needed to settle this imbalance.   Not much, however, just a bit.  We are likely to see new development not too long after 10am.  However, I will be keeping an eye on how we treat this micro composite of balance early on.  I have also noted about 50 points worth of support levels to the downside.  Should we “bunker bust” through these, some caution is merited:

08222014_IntTerm_NQ

On the Market Profile chart we most clearly see the structure of the auction, which reveals a hint of buyer control yesterday.  There was a buying tail and a poor high which suggests a bit more upside could occur.  Pair this with the overnight high exceeding yesterday’s high and you have the likelihood, even if it does not stick, to see higher prices today.  The key will be how we develop IF we trade new highs—are they rejected sharply or do we accept the prices via sustained trade?  If we do, then we could see much higher price given the gap zone we are trading inside of dating back to the year 2000.  I have highlighted the market profile levels I will be observing below:

marketprofile_08222014

Comments »

New High Hint

Nasdaq futures are up just a bit as we approach the open of US trade.  We are current priced to open inside of yesterday’s value

The economic calendar is picking up steam as we head into the final days of the week.  Premarket we saw jobless claims come in a bit better than expected and the news encouraged sellers a bit.  We have manufacturing PMI coming out at 9:45am followed by Existing Home Sales and Philadelphia Fed at 10am.  However, participants are particularly concerned with the tone of Fed’s Yellen talk set for 10am Friday.

The intermediate term continued being under the control of buyers yesterday where we saw sluggish upside action but continued upside action nonetheless.  We saw our first signs of some real seller interest yesterday after hearing minutes from the FOMC.  The Fed minutes were greeted with a 10 point rotation down, the largest selling rotation of the week.  The question however, especially if you intentions are to initiate a short sale, is are we done finding sellers?  I have noted the key price zones I would expect sellers to begin recapturing if we indeed have finished this intermediate term leg higher:

08212014_IntTerm_NQ

The daily market profile suggested a bit of indecision on the day after wrapping up as a neutral print.  Neutral prints tend to occur at or near inflection points.  This was a very sluggish neutral print and it left one slight hint that we may not be done going higher.  Before the session was wrapped up we printed a poor high.  Overnight prices came up and poked the level again.  I have highlighted this observation, as well as other key price levels I will be observing on the following market profile chart:

marketprofile_08212014

Comments »

All Night Long

Some momentum stocks stalled out today and others like WUBA downright took a hit, yet the broad tape continues marching on.  The Fed minutes were expected to yield a muted response and sure enough they did.  More and more Fed members were shown to increase their hawkish tone meaning they want to slow the asset purchases (the ‘free money’) and raise borrowing rates.  They are citing improvements in the labor markets.  Thus good labor numbers will likely be bad for stock prices going forward.

This is all very obfuscated, and to overanalyze Fed actions can be a waste of time.  I want to know how participants are acting right now, and right now they bought little dip.

We are still searching for a conviction seller.  The rally continues until we find one.

All I did today was buy the HOD in GLUU and I am about to take this hit on WUBA ahead of earnings.  Aside from that I am excited for day three with the After Hours with Option Addict crew where we will be taking all of our newly minted terminology and market profile logic and analyzing some markets.

Comments »

Almost a Half Gap

Nasdaq futures are up just a point or so, essentially unchanged, as we approach the US cash open.  Today The Fed will release minutes from the July 29-30 FOMC meeting at 2pm.  The expectations are low, with traders looking for more details on the specifics of the exit strategy.  The overall consensus is for full details to be released at the September meeting.  Since we have testimony from Janet Yellen coming up Friday from Jackson Hole, any market reaction today is likely to be muted.  Keep in mind this meeting we are receiving minutes from today took place prior to the recent uptick in geopolitical tensions.

The Nasdaq Composite, not the front month futures contract but the actual index, has pushed well into the monthly gap left behind at the start of the dot com crash.  This context could be one of the factors leading to this low volume drift higher.  If you think about how price behaves in a volume void or pocket, we tend to see this type of slow grind up through it.  As we progress, I will be watching this index closely to see if we are destined to traverse the entire region or instead perhaps only half for now.  I have noted the gap and its midpoint on the following weekly chart:

08202014_Weekly_NQ

The intermediate term timeframe is bullish.  We are seeing a series of higher highs and lows print since exiting a tight price compression on 08/11.  The move has featured five overnight gaps in a row which exceeded the prior day range.  As a result, our composite profile has some very pronounced peaks and valleys.  When we eventually find sellers, the question will be how much ground are they able to cover?  We can gauge the timeframe of the seller and their conviction by how many of these price levels highlighted below are recaptured by the selling.  I left the measured move targets on the chart for one last look (127.2% and 117.2% Fibonacci extensions) but since we have actual price action in place now I will delete them.  I have also noted the current midpoint of this move just to give some perspective to the progress made:

08202014_IntTerm_NQ

Taking our eyes even closer to the action, we can see the short term trend is higher.  Not just price but also value continued to migrate higher yesterday.  In its wake we left a poor low which may be vulnerable today.  I have noted this price as well as other areas I will be observing today on the following market profile chart:

marketprofile_08202014

Comments »