Heavy sell flow in the globex session, most notably just after US market close and in the early premarket hours of the US session, have seen the price of the /ES down as much as 10 handles since yesterday’s close. Mounting tensions in Egypt, Cisco earnings, and the overall benign action of August appear to have motivated sellers into the market.
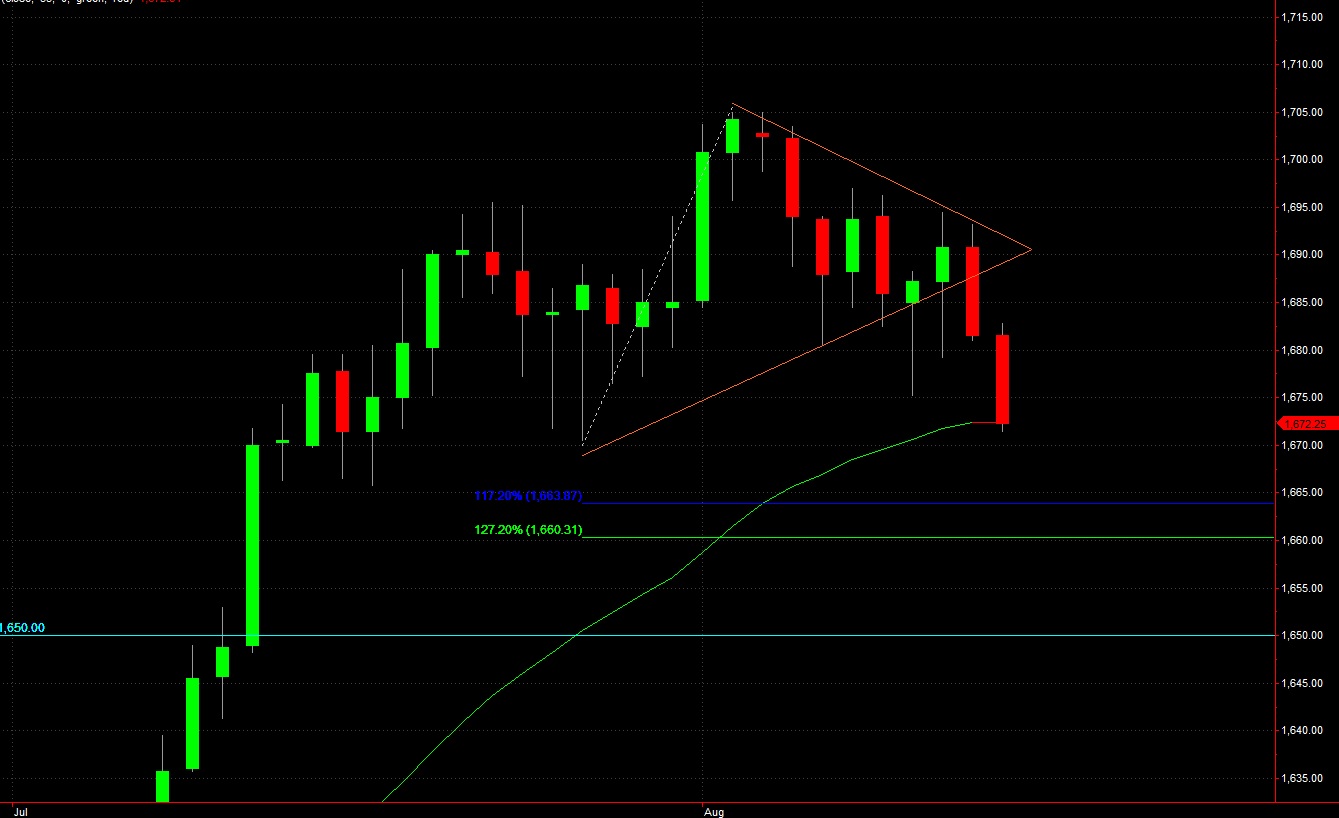
If you zoom back and view the bigger picture via a daily chart, you’ll see the market formed a tight consolidation triangle, compressing price, before bursting lower. This type of move can carry a lot of energy, but thus far has only taken us to the low end of an otherwise bracketed market. See below:
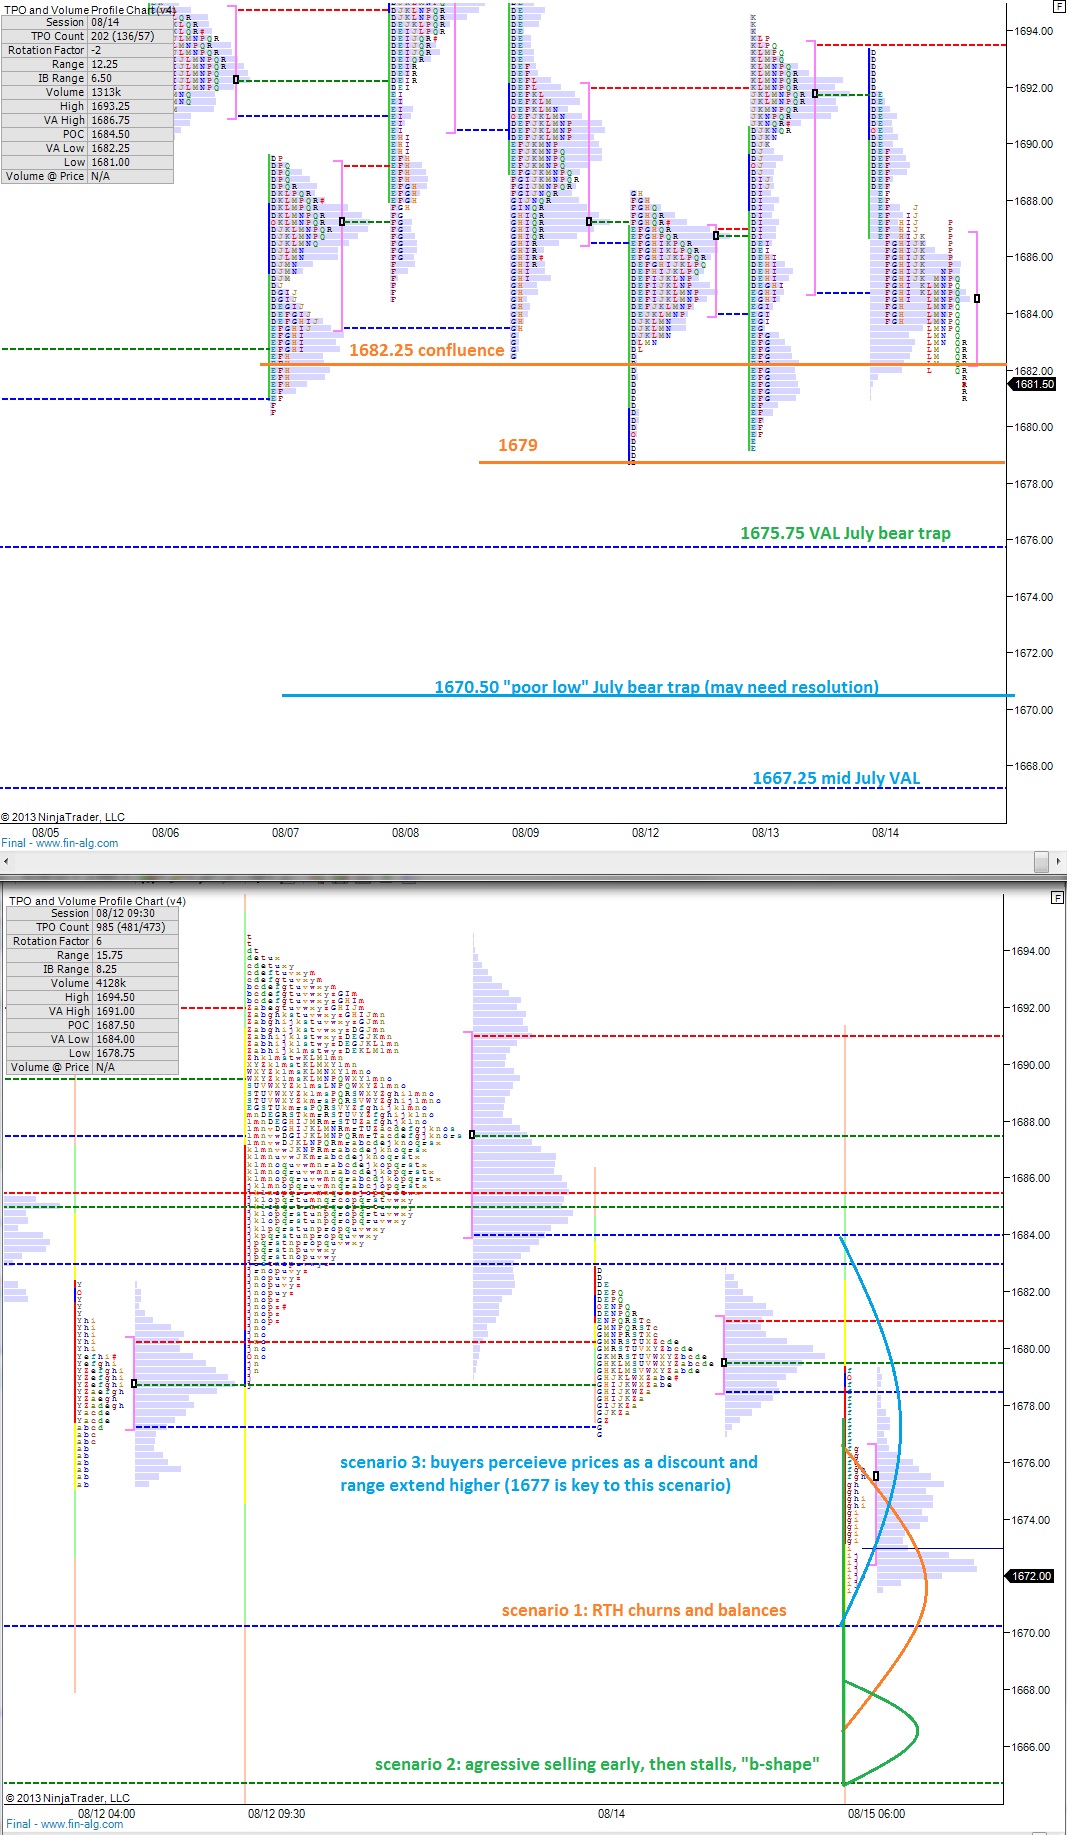
When I look at my 24 hour profiles (second profile chart below) and start envisioning what trade may look like today, the first thing I notice is the thorough auctions that took place above. They have formed nice, smooth bell curve distributions suggesting a solid auction of the price levels took place before the market decided to head lower. Therefore, no unfinished business was left behind for the market to clean up before heading down. It’s just a thought really, but adds credence to a possible deeper price correction.
The relevant levels of support coming in on our RTH chart date back to mid-July, 07/16 to be precise, which should give you an idea of the churn we’ve been experiencing. I’ve highlighted these levels, as they will become shockingly relevant as today plays out, along with a few scenarios for today.
The best trades often fly in the face of recent market activity and if support holds, we could be in for an abrupt rally back to the top of the bracket next week because the overarching trend is still higher.


Yeah, the “symmetrical triangle” is one of the most recognizable technical patterns. As a result, a ton of people pick up on these patterns and buy/short the break (in either direction). Often I find that the best trade is to wait until price breaks the triangle and fade that move. We’ll see if that holds true.
That said, it’s awfully slippery to the downside in the area where $IWM is trading premarket, so things could get interesting today.
This sure looks like buyable blood, but I’ll let the morning progress a bit, sellers are still pushing hard
1664.25 07/11 VPOC is another key support I did not mention.
scenario 4, hide!
brutal break of that triangle, I think they sent a message, this correction is for real.