Fri Dec 27, 2013 8:29am ESTComments Off on The Flow of Profit Taking
The markets engaged a one directional drift this week after news of a The Fed tapering on December 18th reignited the spirit of the long term directional control—the bull. As the [Santa] rally has progressed we start to see the marketplace working into equilibrium. This process can be seen as overlapping price action. As our balance establishes further it will be seen as overlapping value areas.
These prints are the result of sell orders entering the market with a force equal to and at times greater than the force applied by buy orders. As the rally ages, we eventually reach balance or see a sharp rejection lower by selling.
This has not occurred yet. However, we may see profit taking start to kick in today ahead of the weekend. This does not mean you should automatically take profit in your own portfolio, only that your plans should be assessed on individual stocks and consider taking profit or selling if your desired target has been achieved.
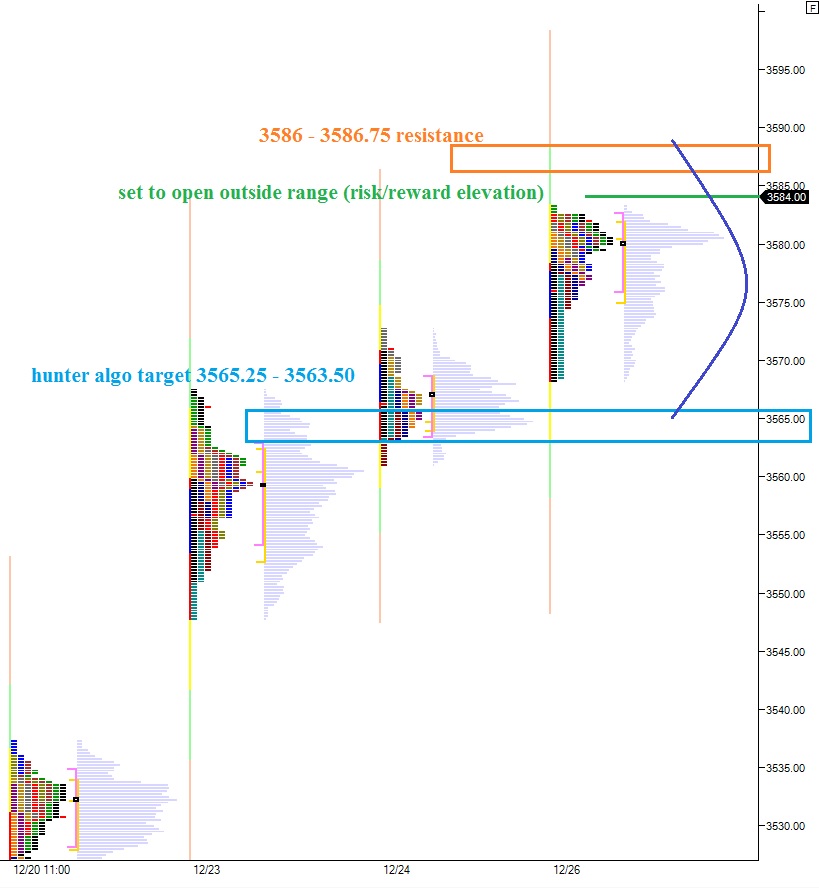
We also want to measure any downward move and whether it makes logical sense in the auction process, or whether we are seeing a shift in control away from the long term trend. Should we see selling enter the market, my expectation is for algorithms to begin hunting stop orders. This action could take price in the NASDAQ futures down to the support zone from 3565.25 – 3563.50.
I have highlighted this zone as well as a few other market profile thoughts on the following chart:
Thu Dec 26, 2013 7:56am ESTComments Off on Morning NASDAQ Context
The globex market opened back up for business this morning at 6am and was greeted by an early bid which drove prices higher. In the short term we have become overbought and it will be interesting to see how these conditions are met as we approach regular trading hours.
Seeing price swing a fresh high in the premarket provides an interesting bit of context for bulls to hang their hat on, as the likelihood of making swing highs during non-cash trading hours is low. This type of context is not always actionable, however, as the mornings swing high cold hold for days and even perhaps weeks prior to being eclipsed. Therefore the premarket swing high is interesting from a context perspective, but not necessarily actionable from a timing perspective.
Price is currently trading entirely outside of Tuesday’s range suggesting we our coming into a market which is out of balance. This creates a higher risk/reward environment then a market opening in prior range.
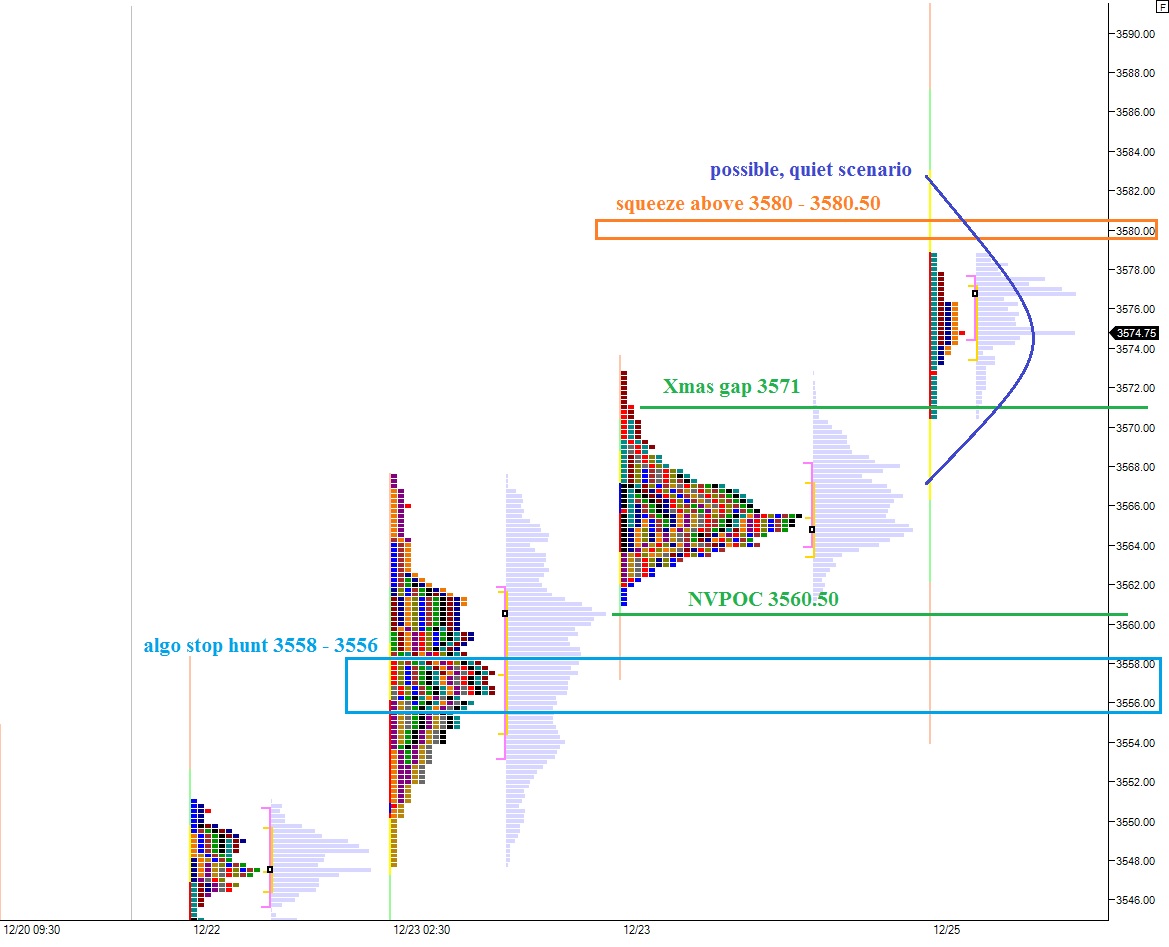
Early on, my expectation is to see sell flow work into the market. On the NASDAQ, I am looking for order flow to take price back into Tuesday’s value and perhaps through our entire range, putting any newly initiated longs underwater. Sell stop hunter algorithms will be targeting 3558 – 3556. This price zone is just below Monday’s VPOC at 3560.50. The VPOC still stands naked after buyers reacted just above the level on Christmas eve.
Should we instead see buyers driving off the open, I will be testing their might verses 3580 -3580.50. If price is sustained above this level early on, it would be wise to avoid any fade or gap fill intraday shorts. A gap fill would take prices down to 3571. Given the close proximity of the gap, my expectation is for a fill to occur today.
I have highlighted a few of the levels on the following 24-hour market profile chart:
Mon Dec 23, 2013 9:11am ESTComments Off on Ho Ho Pro Gap
The index futures are currently trading well outside of yesterday’s range. The S&P futures are set to open nearly 10 handles higher. This is pro gap territory where attempting to fade the price action for the gap fill down is more difficult.
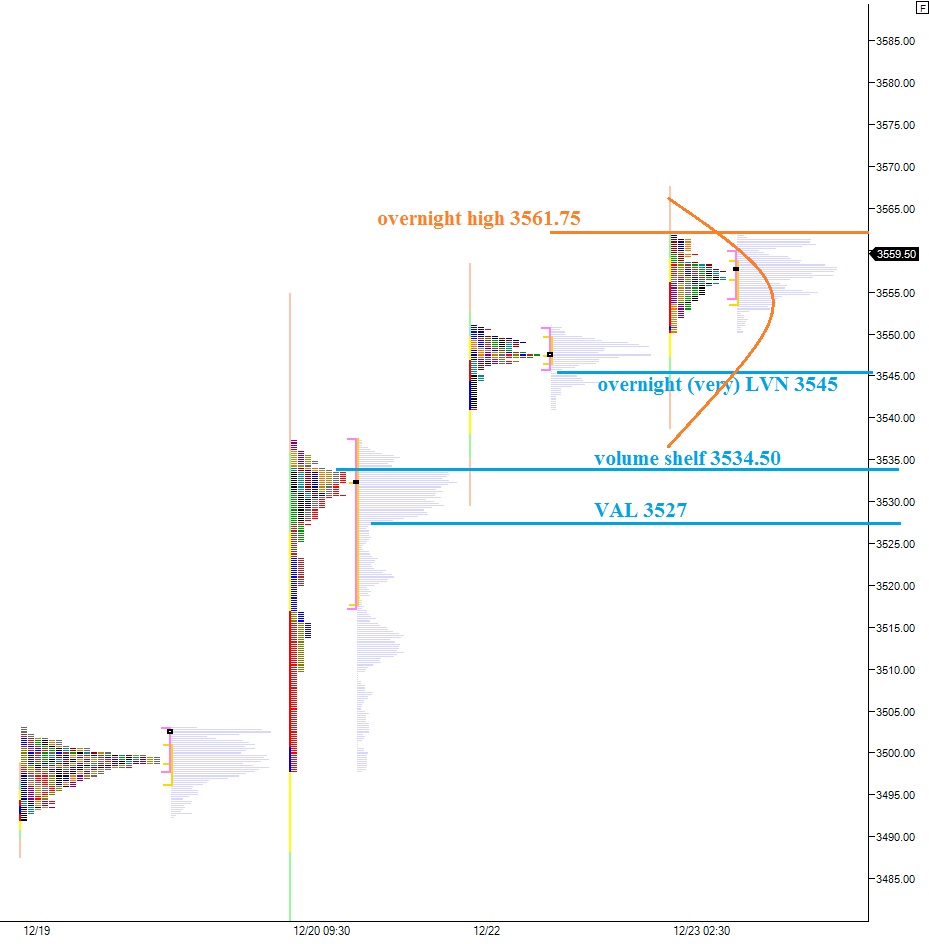
Turning our attention to the NASDAQ, via the /NQ_F, we can see the market printing two distinct distributions overnight as price drifted higher.
Intraday trading in this large gap environment can be difficult, but it is best to choose one side and stick with it to avoid getting chopped. The opening type will help shape this bias. Should price drive higher or lower off the open, we can gather who is in control of the action. A sideways auction with little given back to the downside would suggest the market has accepted the overnight move and to play the long side, for example.
I have highlighted a few levels of support, as well as a few scenarios on the following market profile chart:
Fri Dec 20, 2013 8:35am ESTComments Off on Put a Bow on the Week With Market Profile Theory
The market drifted higher overnight, with the NASDAQ printing two methodical rotations higher. The action was dynamic enough to press price outside of yesterday’s value, but static enough to keep prices within yesterday’s range. Thus the risk/reward level is elevated today, but not National Homeland Security Red by any means. It’s more like a code orange.
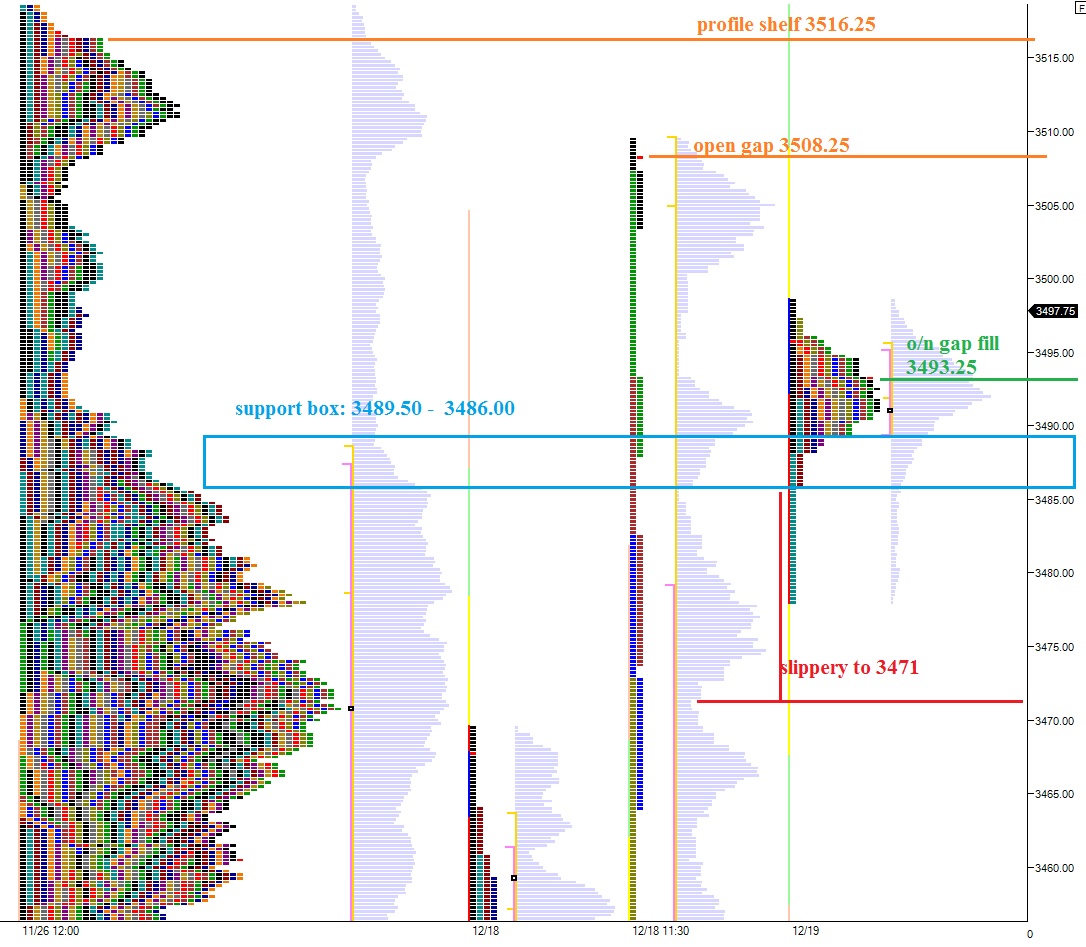
Talking overnight gaps, we still have a gap open between Wednesday and Thusday on the upside at 3508.25 and we have this morning’s gap down to 3493.25. These contextual pieces may lend themselves to a bit of chop in the early market hours.
Yesterday was a digestion/balancing day, with the market accepting it’s marked up prices and buyers on the delta. Buyers on the delta refers to the order flow intraday, where we saw participants willing to take the offer and actively engage the market to enter long positions (or cover shorts). We printed the very uncommon normal day in market profile terminology, where the first hour’s price action was very wide and contained the range for the rest of the day. We have a buying tail on the low end of our profile suggesting buyers perceived the early drop in prices as deep discount and reacted accordingly.
Overall, we printed a P-shaped profile which signals a short squeeze occurred. Whether that squeeze will provide the tinder to spark another rally will be revealed today by the auction activity.
I have highlighted levels I will be watching to track the progress made by buyers and sellers on the following market profile chart:
Yesterday afternoon, once we had our news of taper, we saw a clear entry of the long-timeframe trader. It started with an aggressive buyer reaction to prices perceived as deep discount—a long tail printed off the lows. Next we saw two-timeframe action where the intermediate term was wrangling for control with the long timeframe. This action can be seen just below our balance zone’s value area low. Once we reentered the balance zone, long time frame captured control of the market and pressed us through the value area and up to our hinge of supply near the annual highs.
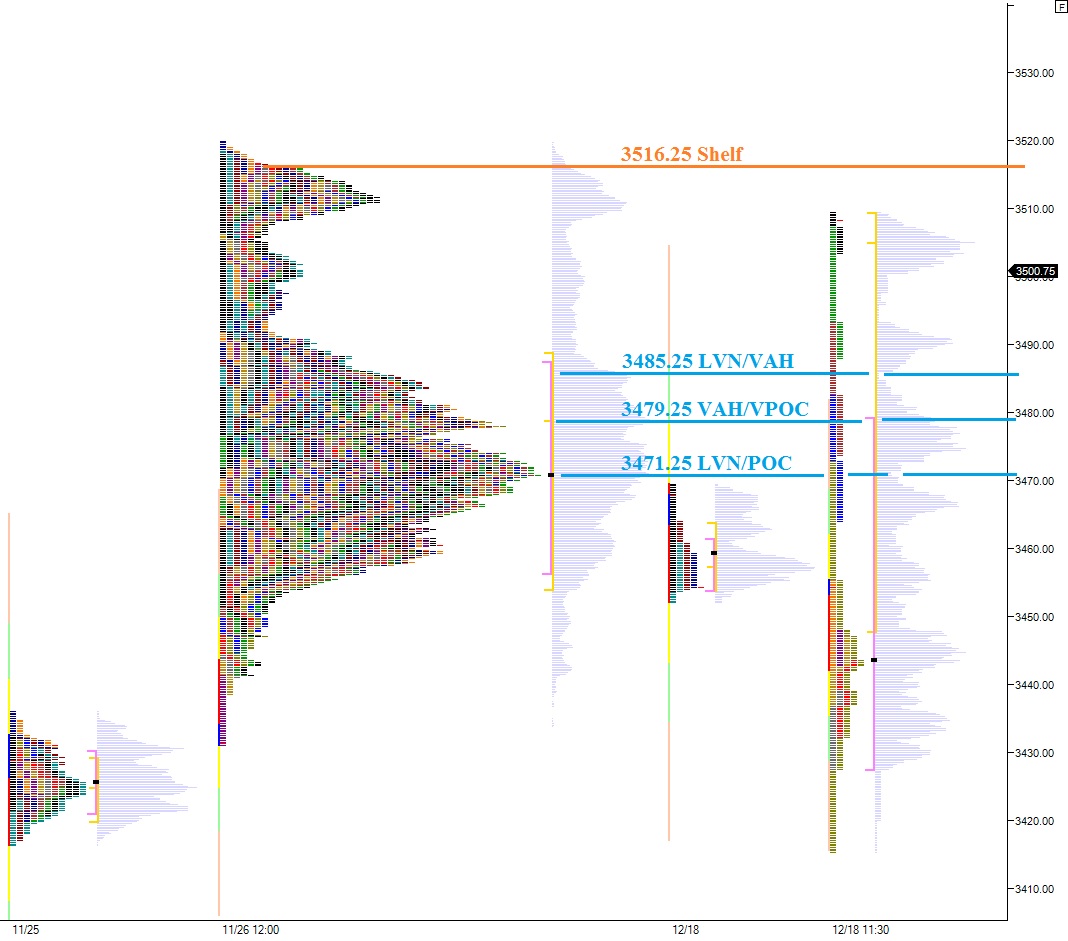
My expectation today is to see back-and-fill balancing taking place between the shelf of historic price action at the highs and the layers of support built below. I have highlighted these reference points on the following NASDAQ market profile chart:
While the market is balancing out, look for individual pockets of momentum to run as people chase performance in this last full week of trade. Check out the Option Addict blog and comment section where top traders are sharing the names they will be watching for momentum.
It is not necessarily that today’s news headlines are any more important than what we saw last month or any other day or week for that matter. Instead what makes today important from a trading point of view is the aging balance zone which has developed in the intermediate term.
Long term, we have a market in the solid control of buyers.
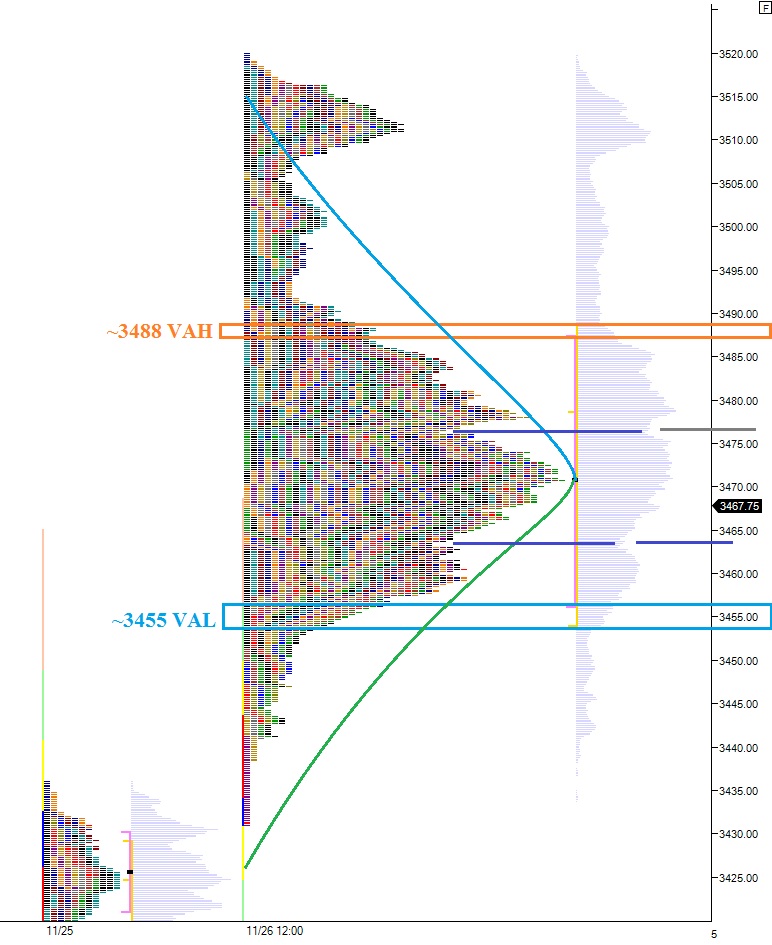
Intermediate term, we lack control. Since about November 26th, the market has balanced and chopped with no clear victor in place. I have illustrated this intermediate term balance today using the NASDAQ composite futures and the developed Gaussian curve spanning several weeks. See below:
On the short term, I give sellers the slight edge for liquidating the market on 12/11 and since then only allowing the market to coil.
Yesterday we printed a neutral print, which signals indecision and tends to occur near inflection points. This is balancing.
Overnight we bounced back from the late afternoon fade and have chopped along. More balancing/indecision.
Thus I conclude we are in a balancing environment. Therefore we must be aware of when the market is moving out of balance, and who is asserting control. As you can see on the above chart, there is a hinge of overhead supply the market needs to negotiate. The low end of our intermediate-term distribution shows a buyers’ tail.
Drilling into the daily market profiles, I list the key levels to monitor as we move about today. I am especially keen on 3452.50 – 3450 below. If we do not see buyers at this level, the downside could accelerate.
The NASDAQ futures market showed a bit of follow through on the behalf of the sellers, where price took out our Monday morning low. However, the probe lower, likely algorithmic in nature, was met with a reactive buy force and price swiftly auctioned back into yesterday’s value range.
Conversely, the SPX futures made no new low overnight, instead continuing to coil. There has been a subtle bit of relative strength exhibited by the SPX verses the NASDAQ composite these last few days including yesterday where we printed a normal day. In market profile theory, a normal day features a dynamic open, likely driven by a longer timeframe trader entering the marketplace. The range of the first hour is not breached for the rest of the session. These are very rare, occurring in the SPX only five times in the last six years. Oddly enough, we printed a normal day in the SPX on Friday and Monday.
The action suggests coiling and this uncertainty is suitable for our current situation. We are nearing the close of a very strong year in the markets. Many are likely closing their books early to lock in the gains, yet we have strong pockets of momentum in select industries. The Fed, our current market moving exceptional, is experiencing a changing of the guards from Bernanke to Yellen and we have taper talks given the recent progress in the labor markets.
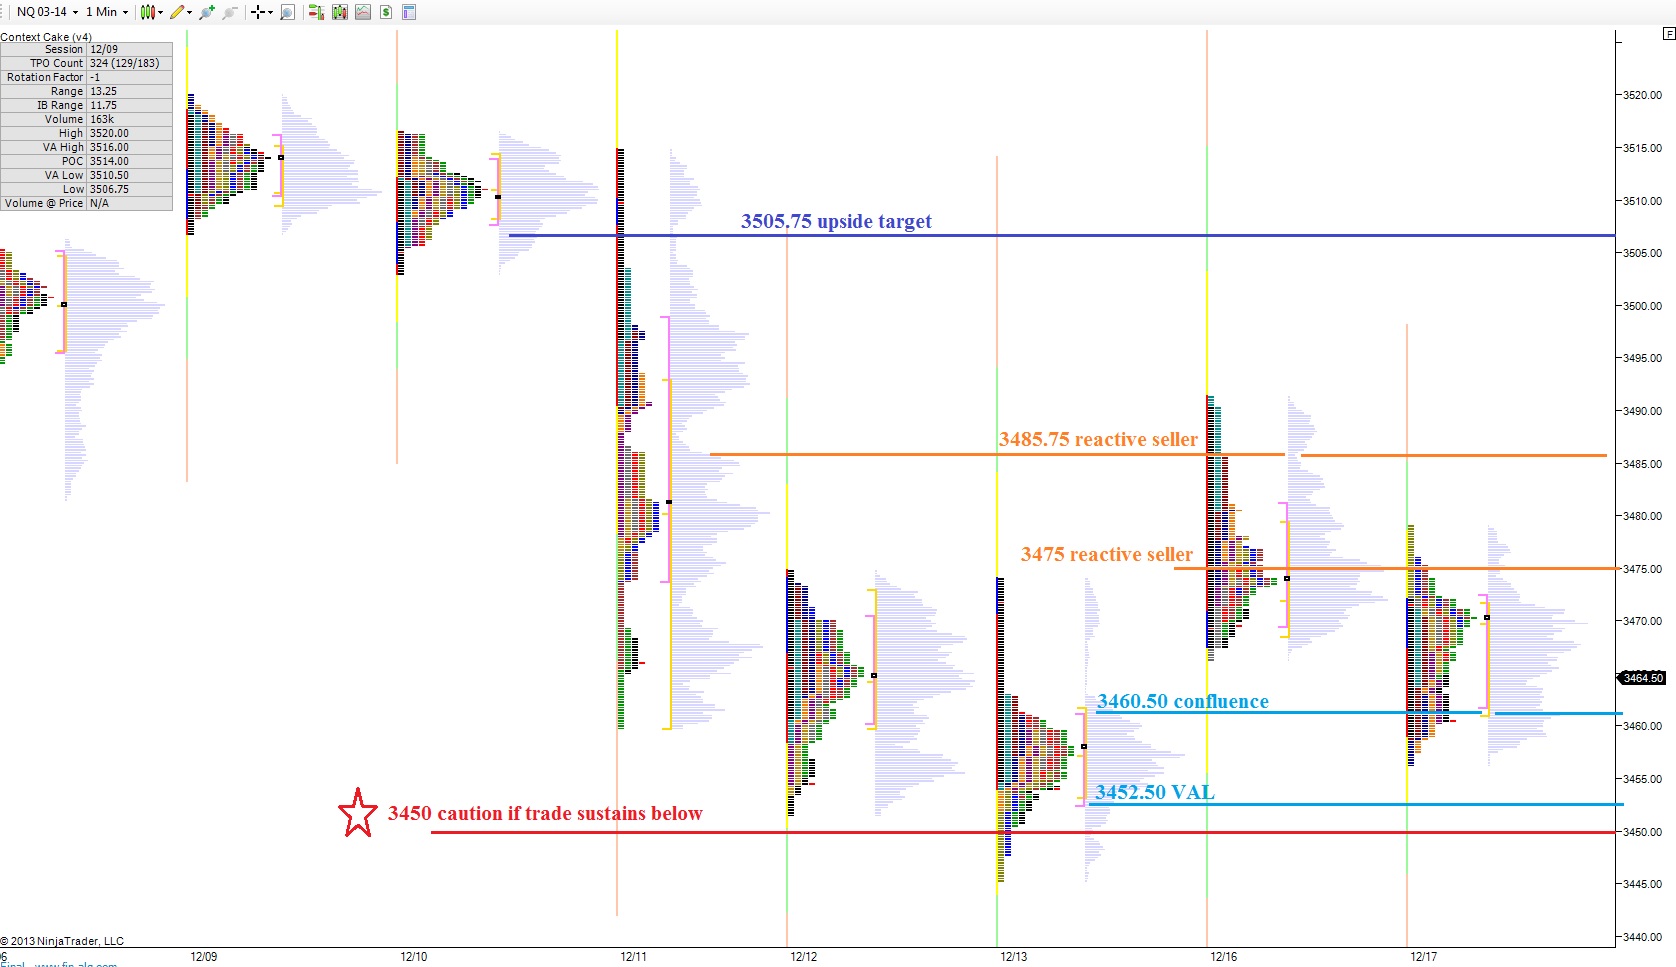
The markets have two choices today. Either continue to coil ahead of Wednesday’s Fed announcement or move away from here. I have bracketed both the NASDAQ and the SPX today as guideposts as the day progresses. Keep these brackets, or support/resistance clusters, in mind today as the day progresses to measure any progress made by the buyers and sellers.
I have also highlighted a few scenarios for the NASDAQ using the 24 hour market profile chart:
The buyers rolled out the cavalry early on, buying up the indices, only to retreat after an hour of progress. I heard (read) several seasoned traders speak of a subtle change in the character of the market these last few days. I like to go heavy on context work because these subtle cues come from the footprints of the marketplace.
We need to understand what timeframe is in control on a given day. By establishing what timeframe is in control, we can decide what reference points become important. The drive higher early on looked like the long term timeframe taking control of the marketplace but we later learned that was not the case. The rest of the day we faded the early strength, a slow move lower controlled by the day timeframe sellers. Intermediate term we lack a clear victor and are instead experiencing balancing trade.
In summary: Long term – buyers firmly in place, intermediate term – balanced/two way action, daily control-buyers, and intraday control – sellers. PPT nailed a swing low for now, which is always fun(d), now it is a matter of building upon it or sellers blasting through it with old school scud missiles.
When we land our hot air balloon in the thick forest and begin investigating individual trees, we can see risk still being engaged in the marketplace. Alternative energy plays caught a bid. Solar stocks started seeing some inflow after an orderly, mind you deep, pullback off the recent highs. These issues will be interesting to track into year-end as to whether they can put in a higher/tradable low here. I am long FSLR and YGE from higher prices, -9% and -15% respectively.
I thought I was getting cute last week, selling off my “bottom shares” in RVLT. You know, the ones I bought at the beginning of September for two fifty. Lo and behold, RVLT rips higher after signing a contract with the Navy for 17,000 LED tube lights. This is one of those deals that seems big, but in the grand scheme is really small. That type of installation however, could yield over 200k in profit margin given the company’s current revenue structure. I think the market excitement comes from the hope that this is only a primer deal with more potential deals in the pipe. Investors.com also published an LED pumper piece Friday evening which may or may not have contributed to the inflows in LEDs today (h/t @randadtrade).
However, you did not need to know about the pumper piece or the Navy deal to get long RVLT last week. No friends, you just needed sentimental confidence as was on display by iBC comrade @Eliza_Mae_iBC who spoon fed the trade in what he called the “holy grail” chart setup. He shared his thoughts after I sold my “bottom shares” like a jacked-ass. Fortunately, I still was ¾ sized into today move. Even Raul, faithful to the LED tech, became discouraged. I bought more CREE this morning to repent for my loss of faith. Side note-yes, Twitter is useless. You should believe what these analysts tell you. You would not want to encounter likeminded people who engage in real-time, money making conversations, I know.
I still like my OWW shares, as they do absolutely nothing but go sideways.
That’s all that was done. I was up 1.75% today. With a little bit of market cooperation, I just may hit my annual target.
Note: All price levels mentioned going forward will be in reference to the March contract.
If you were just waking up to the market, you may be unaware of the wild ride index futures took overnight. The S&P printed over a 20 point range in the overnight session after reversing early weakness. The Nasdaq traded over 40 points in range. In short, last night featured violent indecision of the overnight/low volume variety.
As of 8am, the S&P is set to open above Friday’s range which tells us we are in a high risk/reward environment. The NASDAQ is not quite above Friday’s range, but is outside of Friday’s value which gives us a similar context to frame our day.
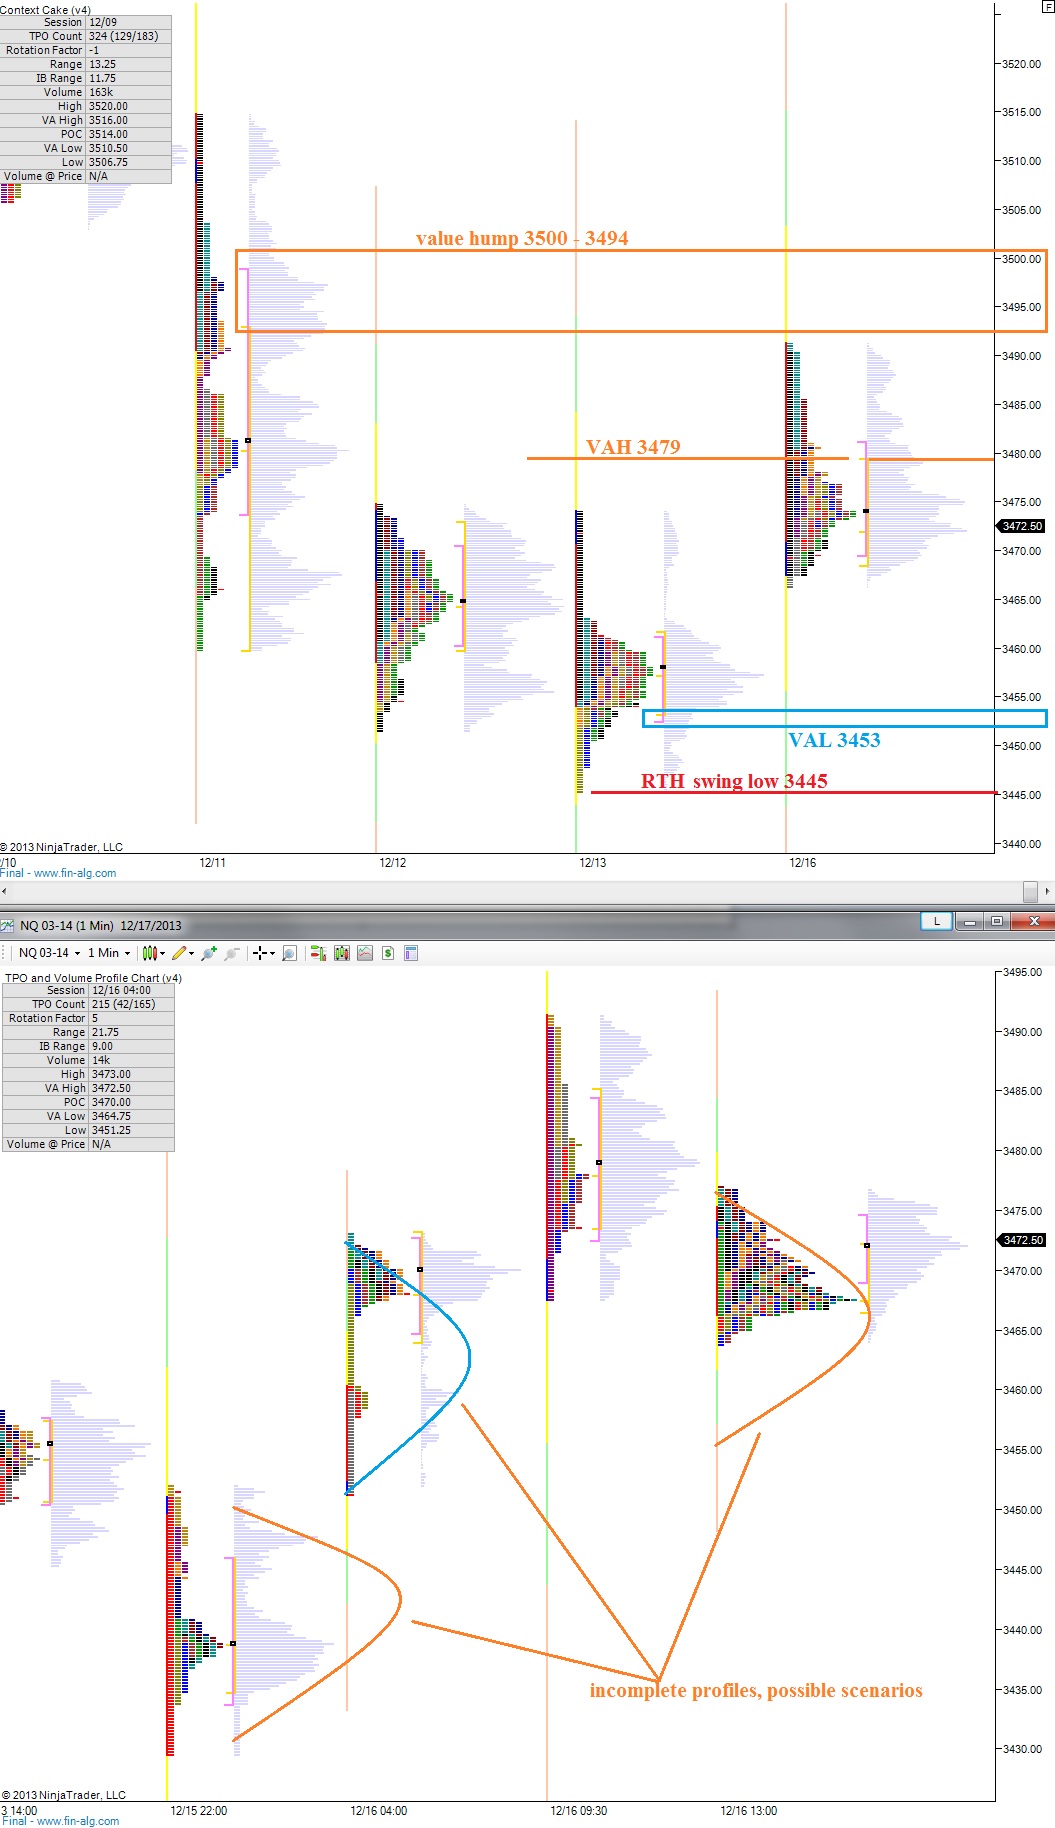
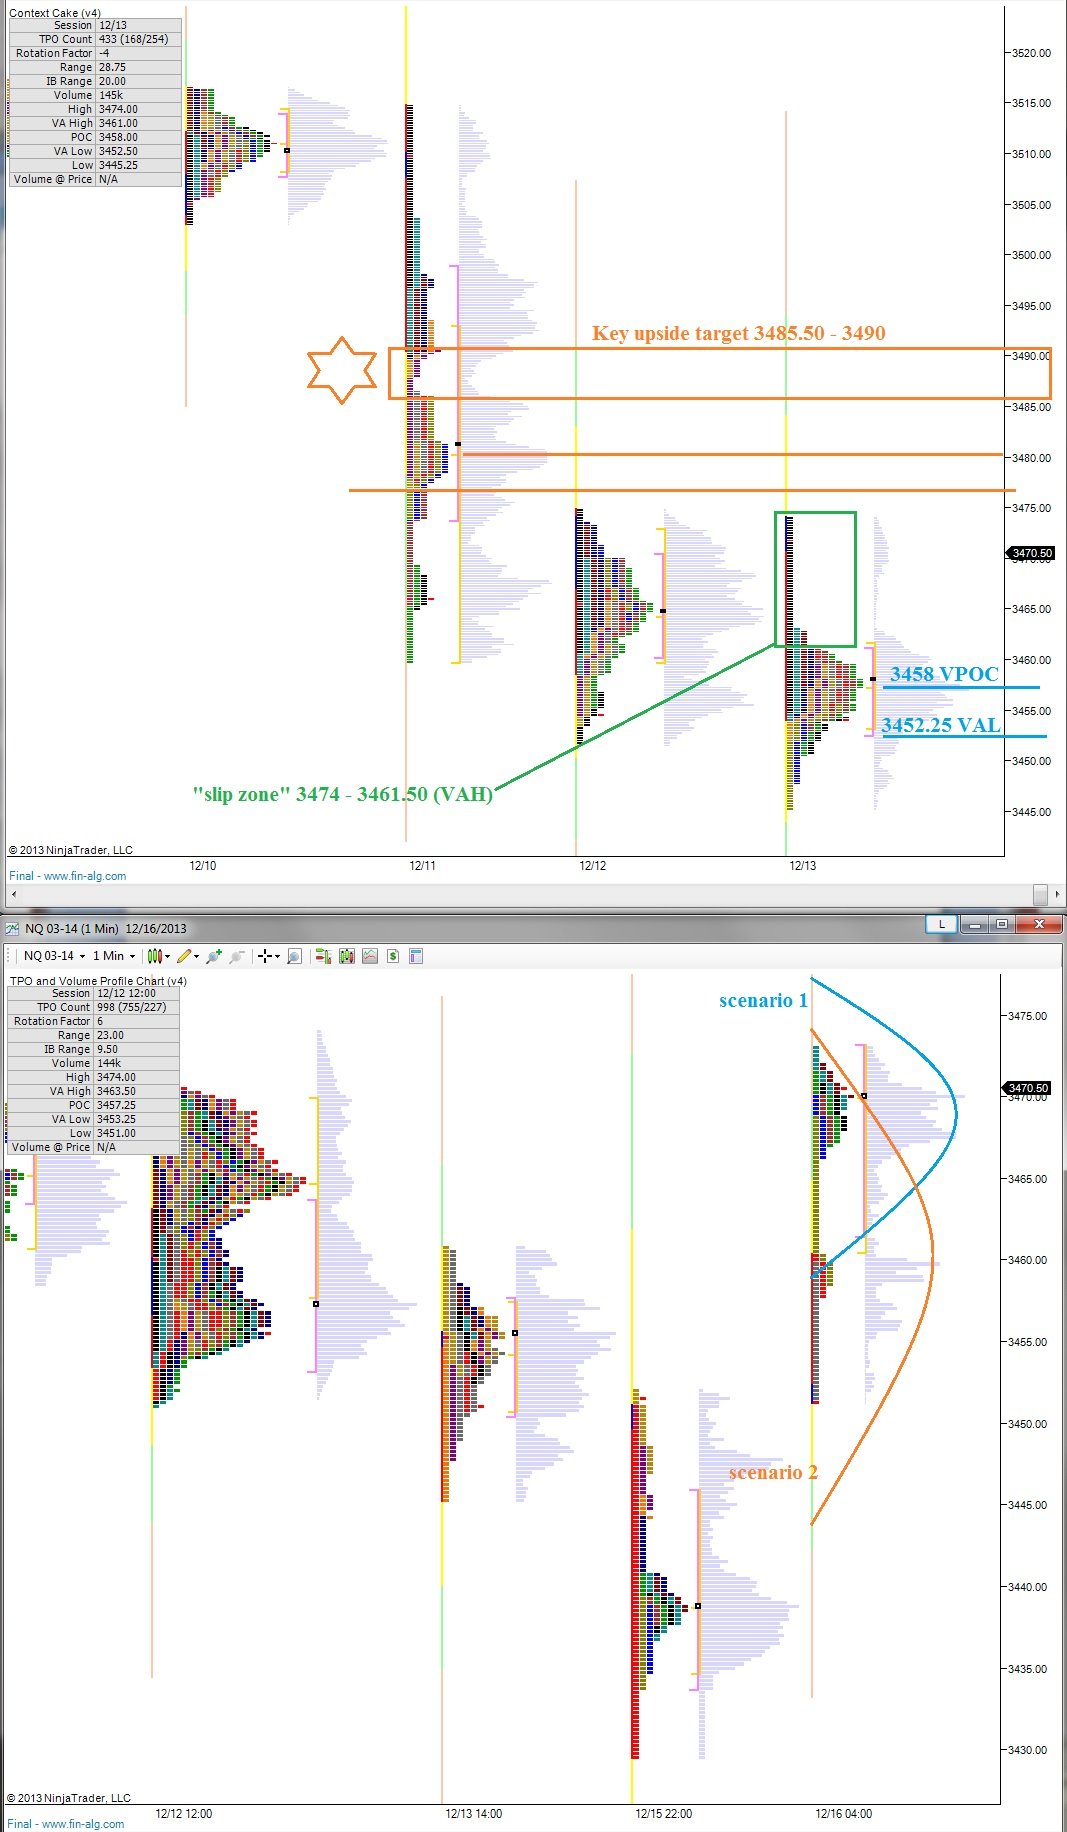
Early on it will be interesting to see if sellers can reject the overnight progress and press back into Friday’s value. Turning our attention to the NASDAQ, we are opening in the slippery single prints from early Friday where sellers aggressively auctioned lower. We may see a similar push from sellers early on and should monitor trade at 3461.50 which marks the value area high on Friday’s session. Below there we have a VPOC at 3458 and a value area low at 3452.25. Short sellers will be on the lookout for a rejection of this range as it may signal a bullish reversal is materializing.
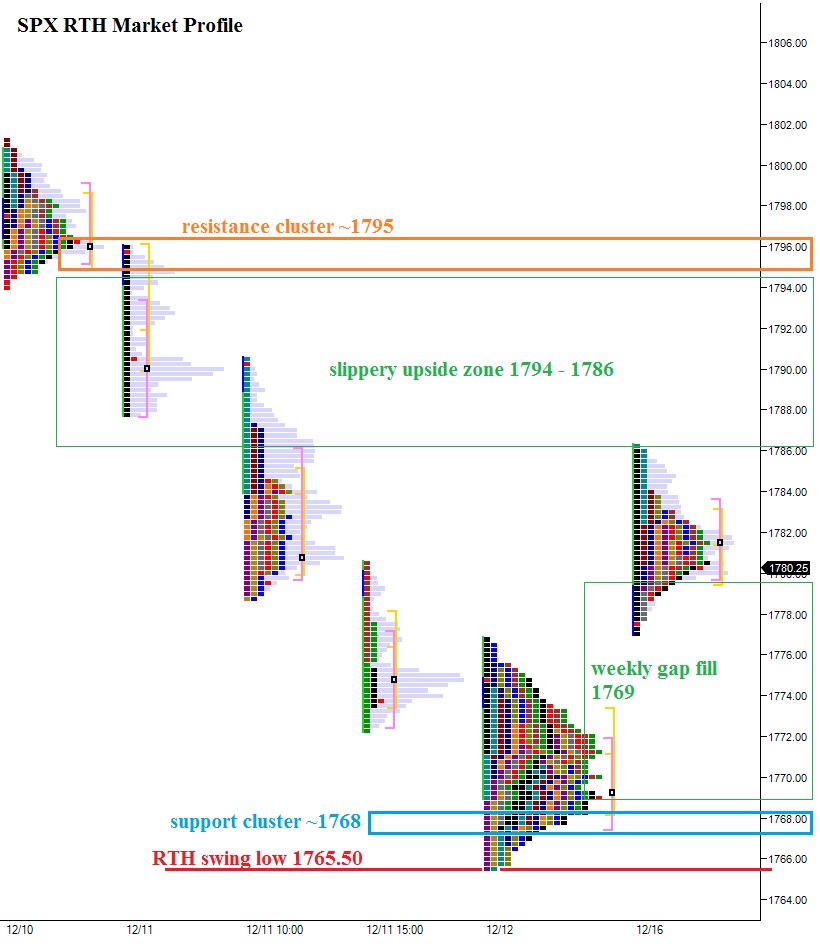
I have noted these levels, as well as key resistance points and a few possible scenarios on the following market profile charts:
We continued working through a correction yesterday in the NASDAQ where sellers continued to their control. Their success in controlling yesterday’s auction can be seen in yesterday’s RTH market profile print. Assessing their control boils down to the following points:
Range extension lower
Value overlap/lower
VPOC migration lower
Lower high and lower low
The positive news for longs is price has begun the pinball process of discouragement, where price is chopping around and taking no prisoners on either side. If my read on sentiment is correct, I will be looking for a higher low to setup soon on the NASDAQ. This may occur as soon as today.
The S&P has a very similar sentimental context.
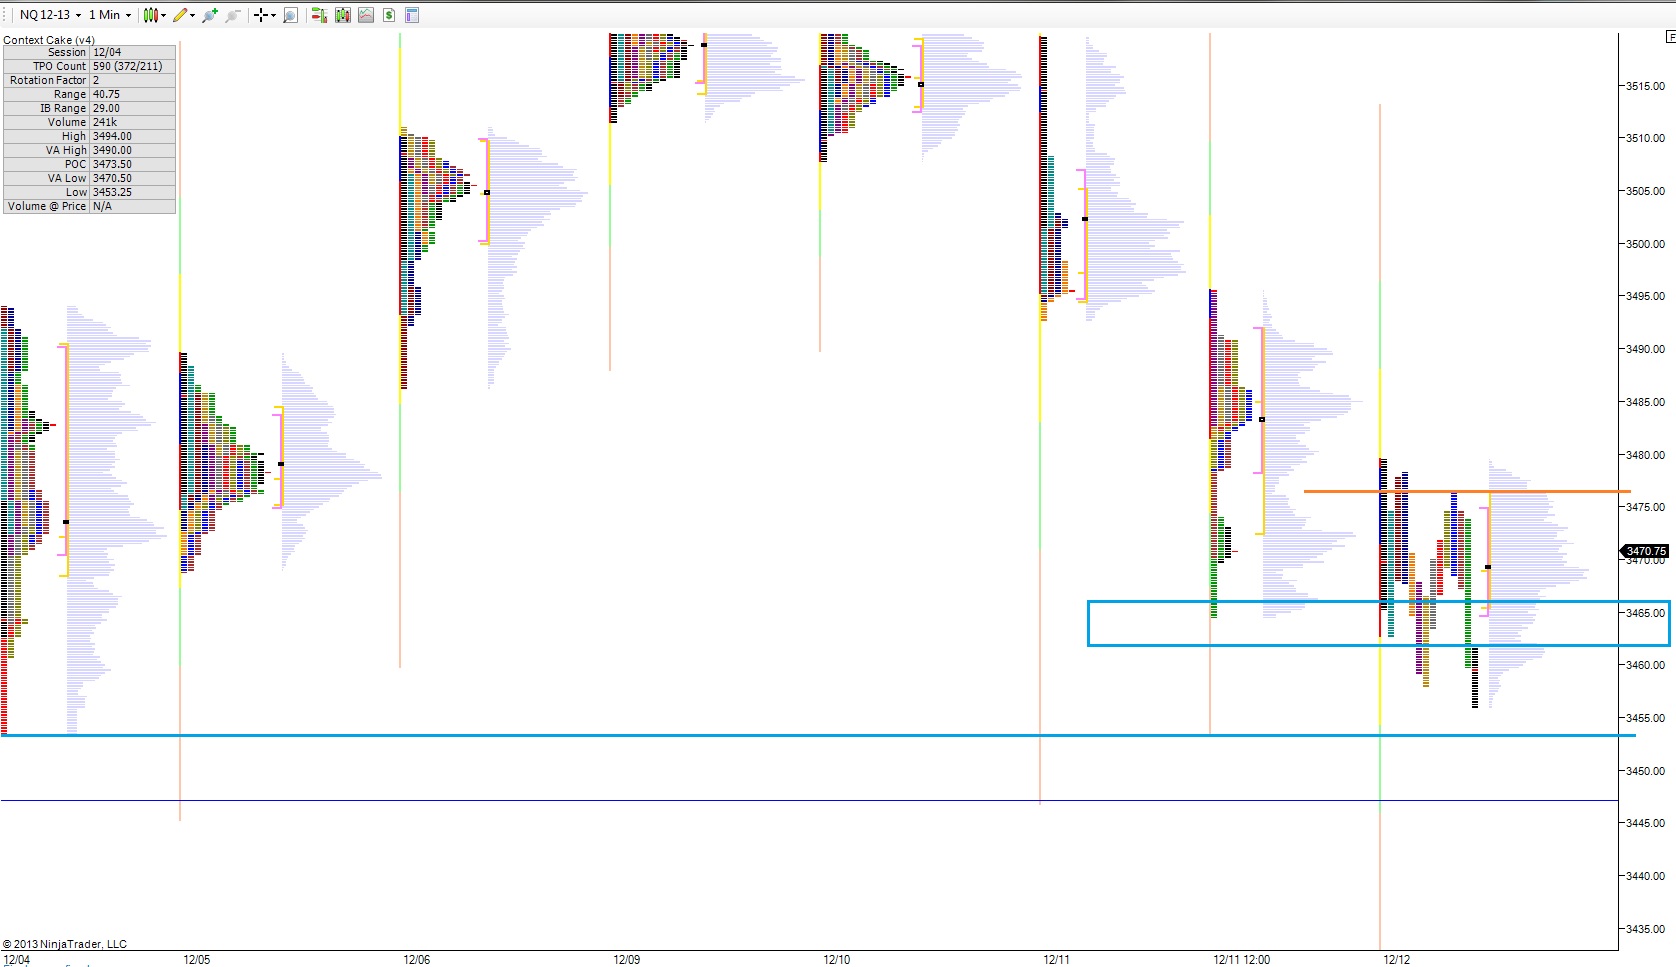
Buyers came in overnight and bid the markets up a bit, but we are still trading inside of yesterday’s value, thus it has been accepted. Early on, I will be looking for sellers to reemerge and press price lower. I will be gauging their sentiment between 3465.50 – 3462.50. Should their pressure abate in this range, I will be looking for long exposure. Should their selling campaign continue, I will look for sellers to push into our 12/04 low at 3453.25.
On the upside, I will look for any signs of trade sustaining above 3476.50 our value area high from yesterday and also a low volume node left behind during Wednesday’s liquidation.
I have highlighted these levels on the following market profile chart: