The behavior of the equity markets last week cleared up any uncertainty as to whether or not everyone was back to doing business. Volume increased in most instruments and move have increased in size and speed. Both the NASDAQ and the S&P have been chopping around which creates opportunistic conditions for day traders. These benign conditions have allowed individual pockets of momentum to make large runs too.
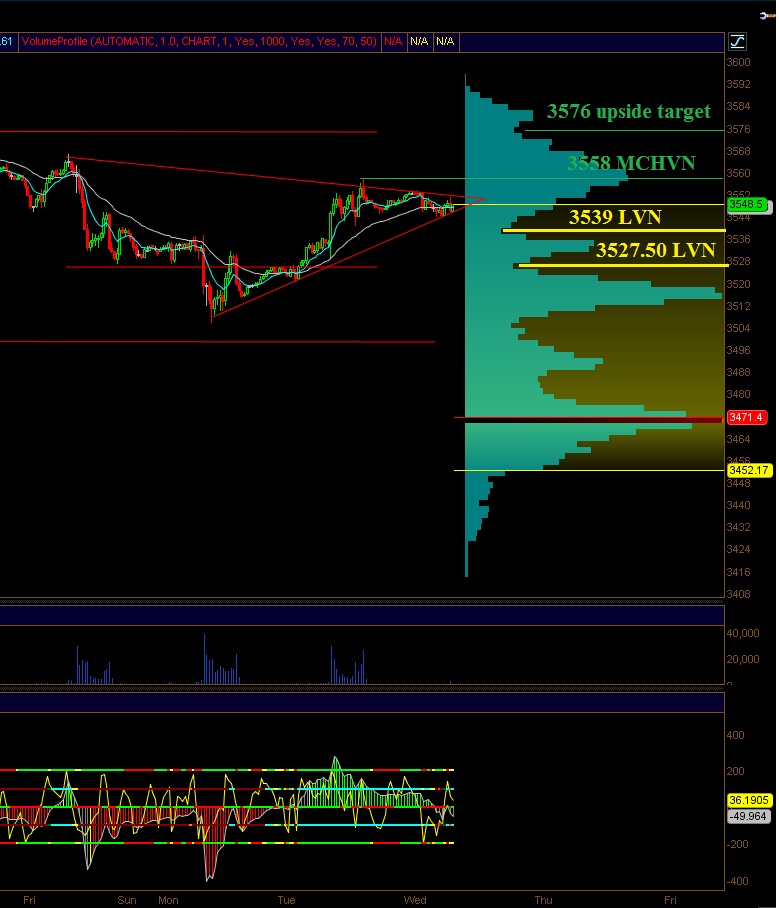
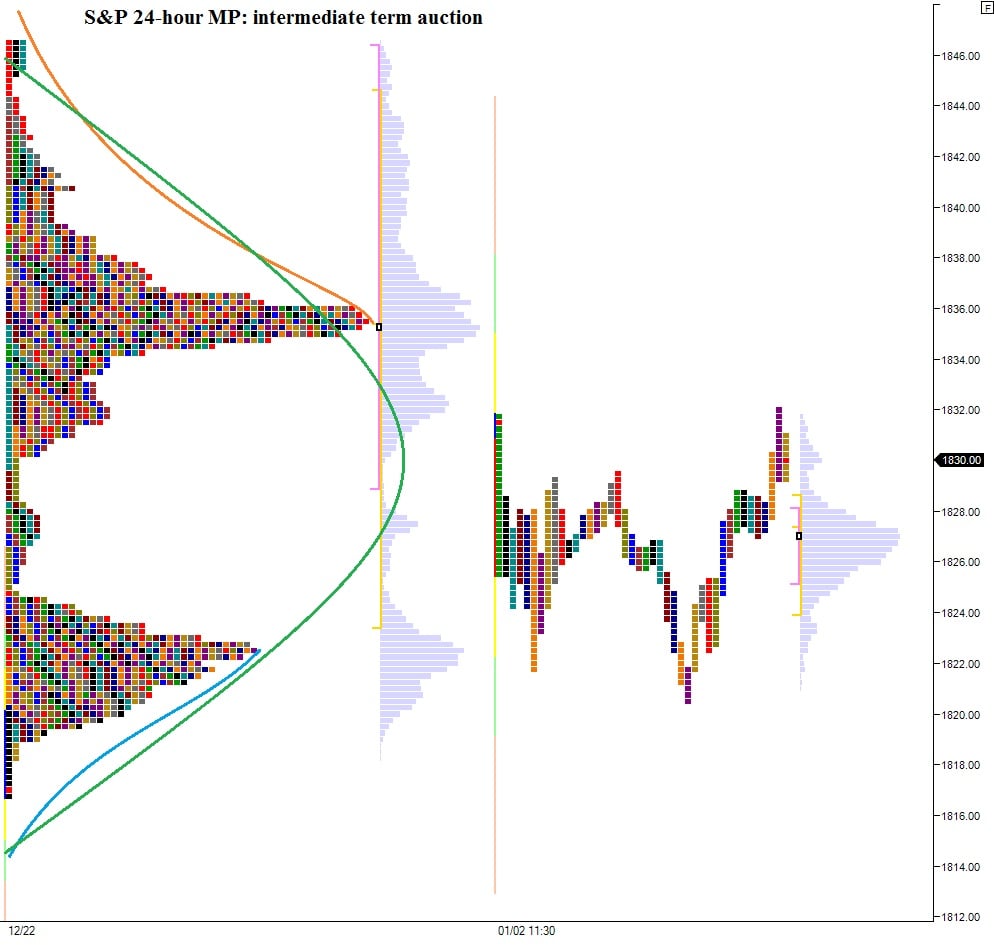
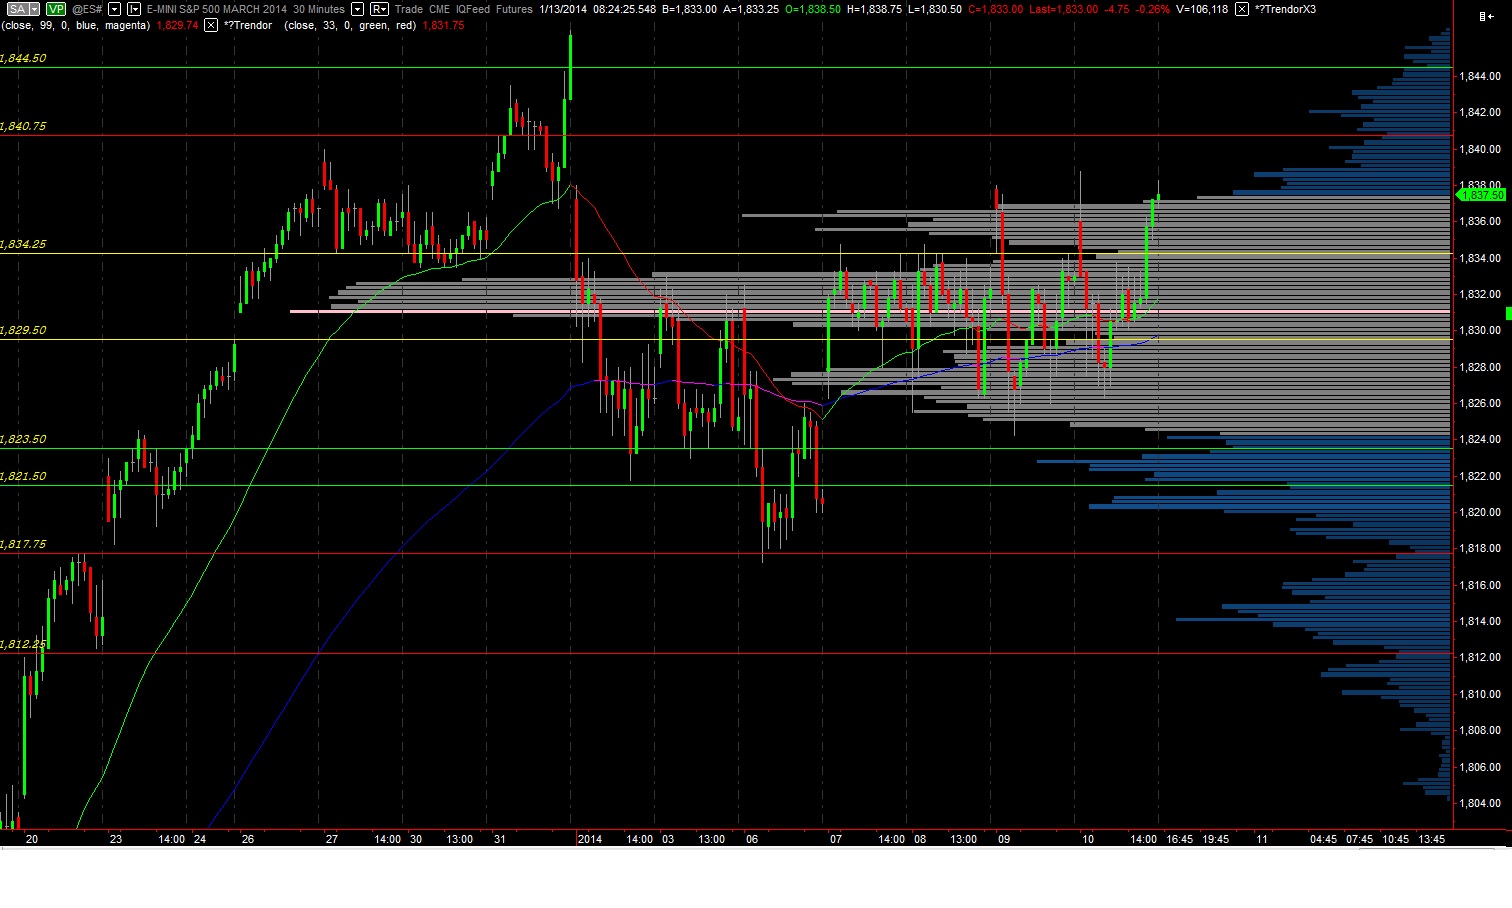
I spent the weekend building out a few new charts since Mirus futures and Ninja trader will not be working properly any time soon. The first chart is 30 minute candles of the S&P 500 via the /ES contract. I am using the 30 minute bars to simulate the TPOs of market profile. I am doing so with high quality tick data which produces a very accurate volume profile. In this chart we can clearly see the intermediate term balance occurring since 12/20. I have highlighted the low volume nodes of this chart, as I feel they present strong opportunities for traders to position their books and also observe sentiment:
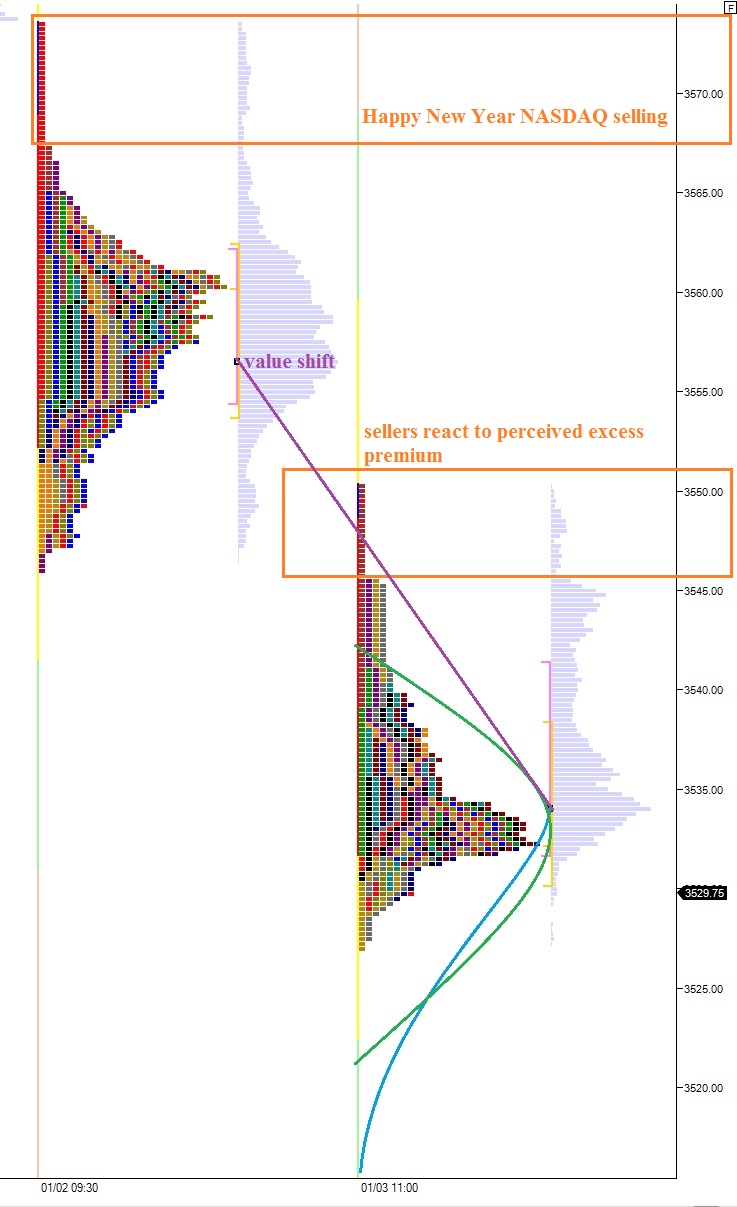
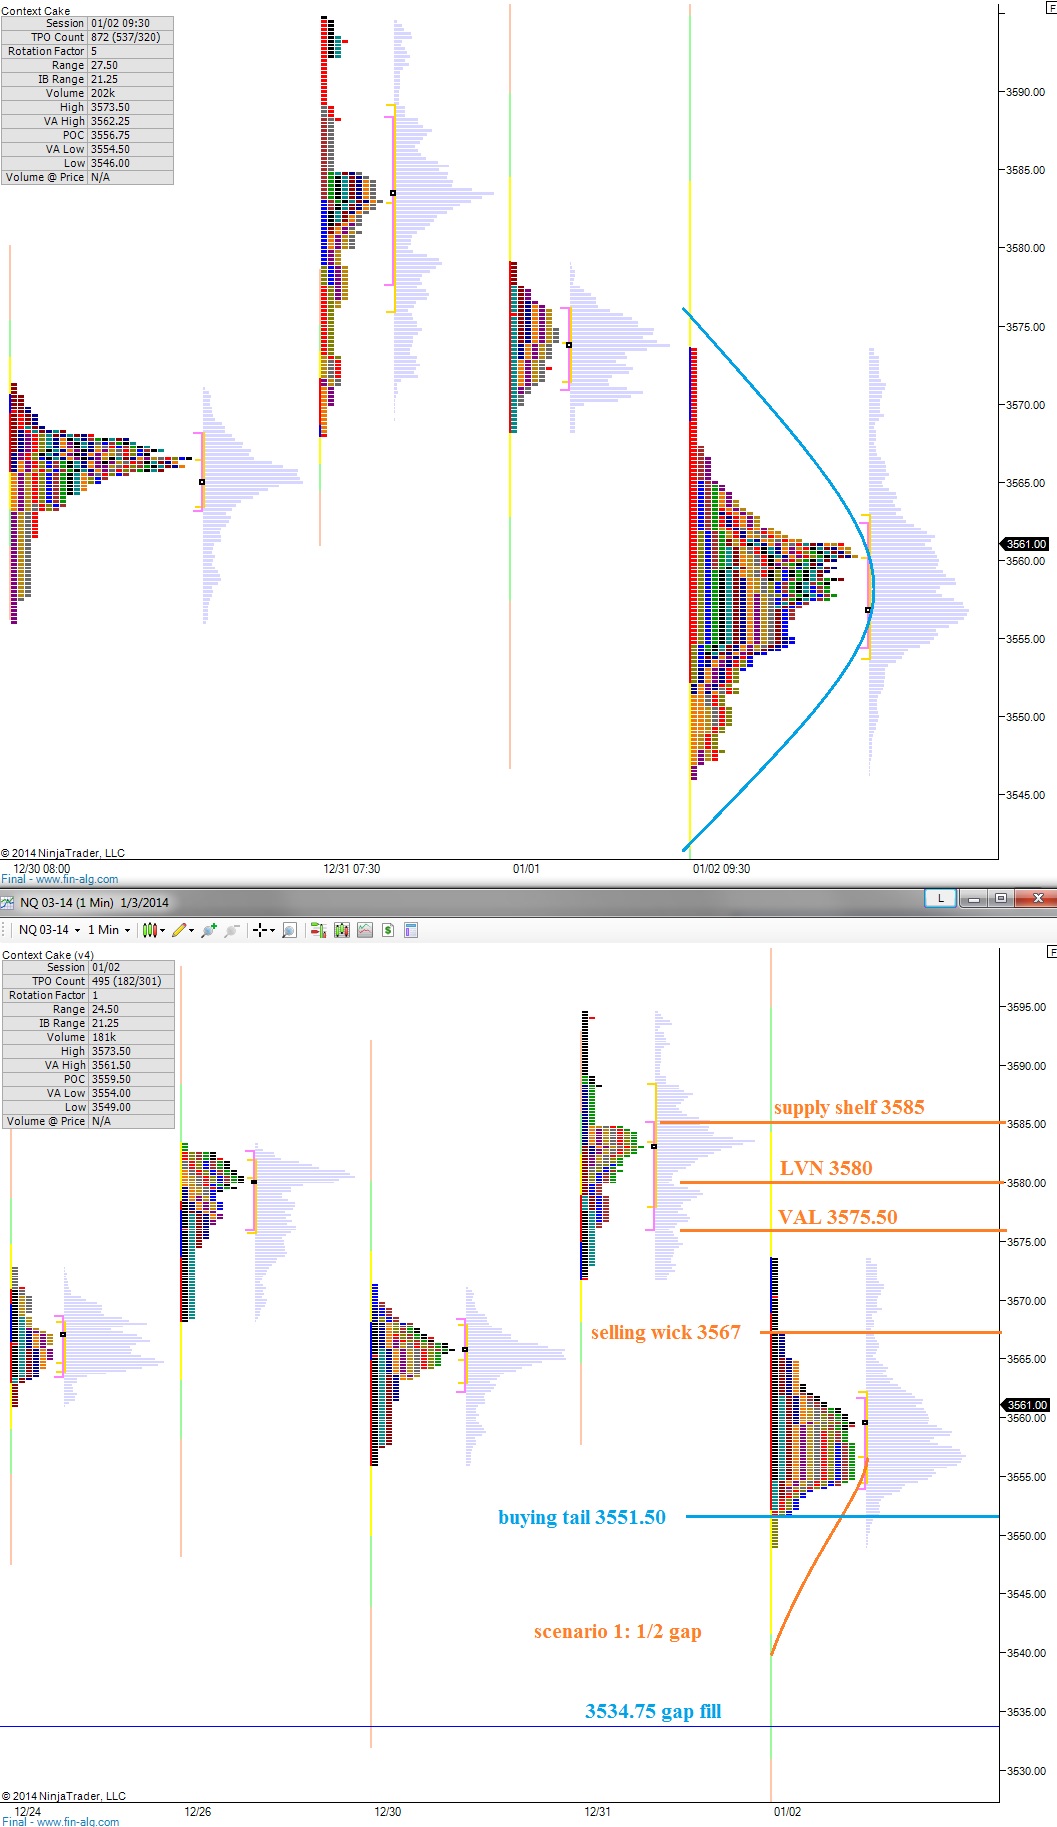
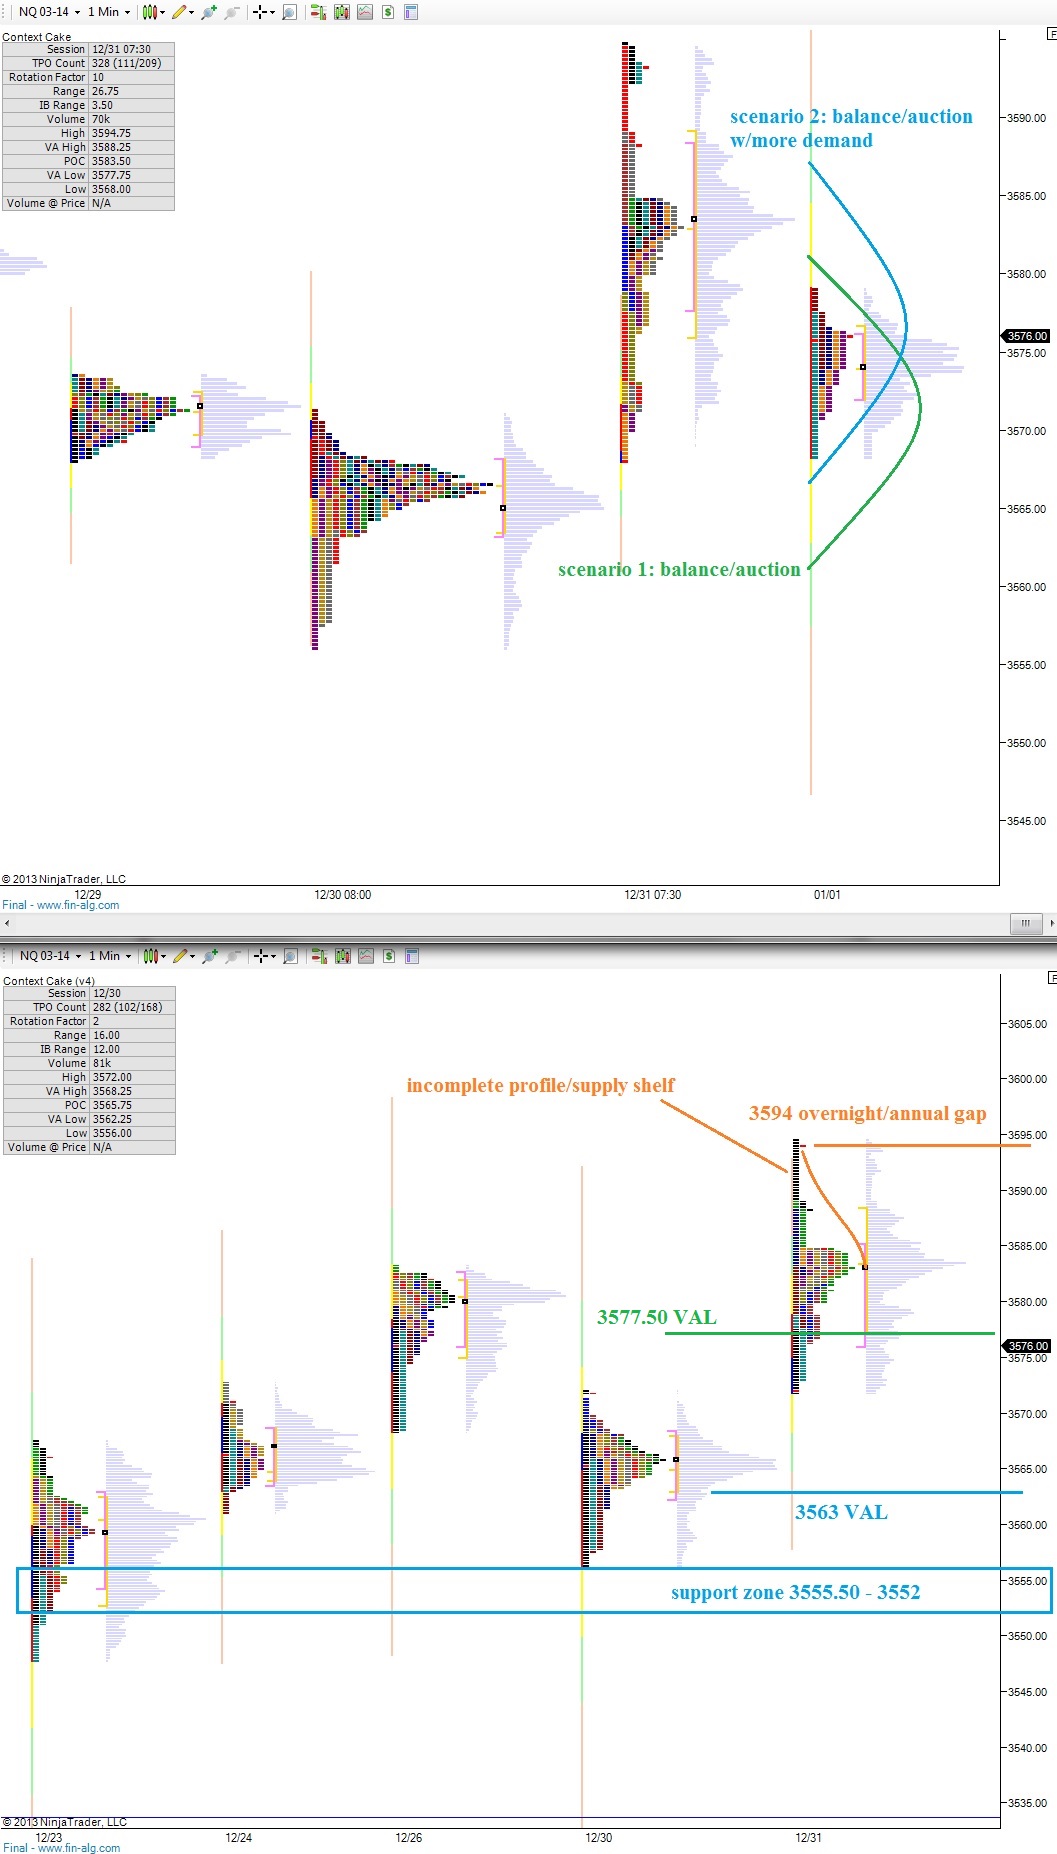
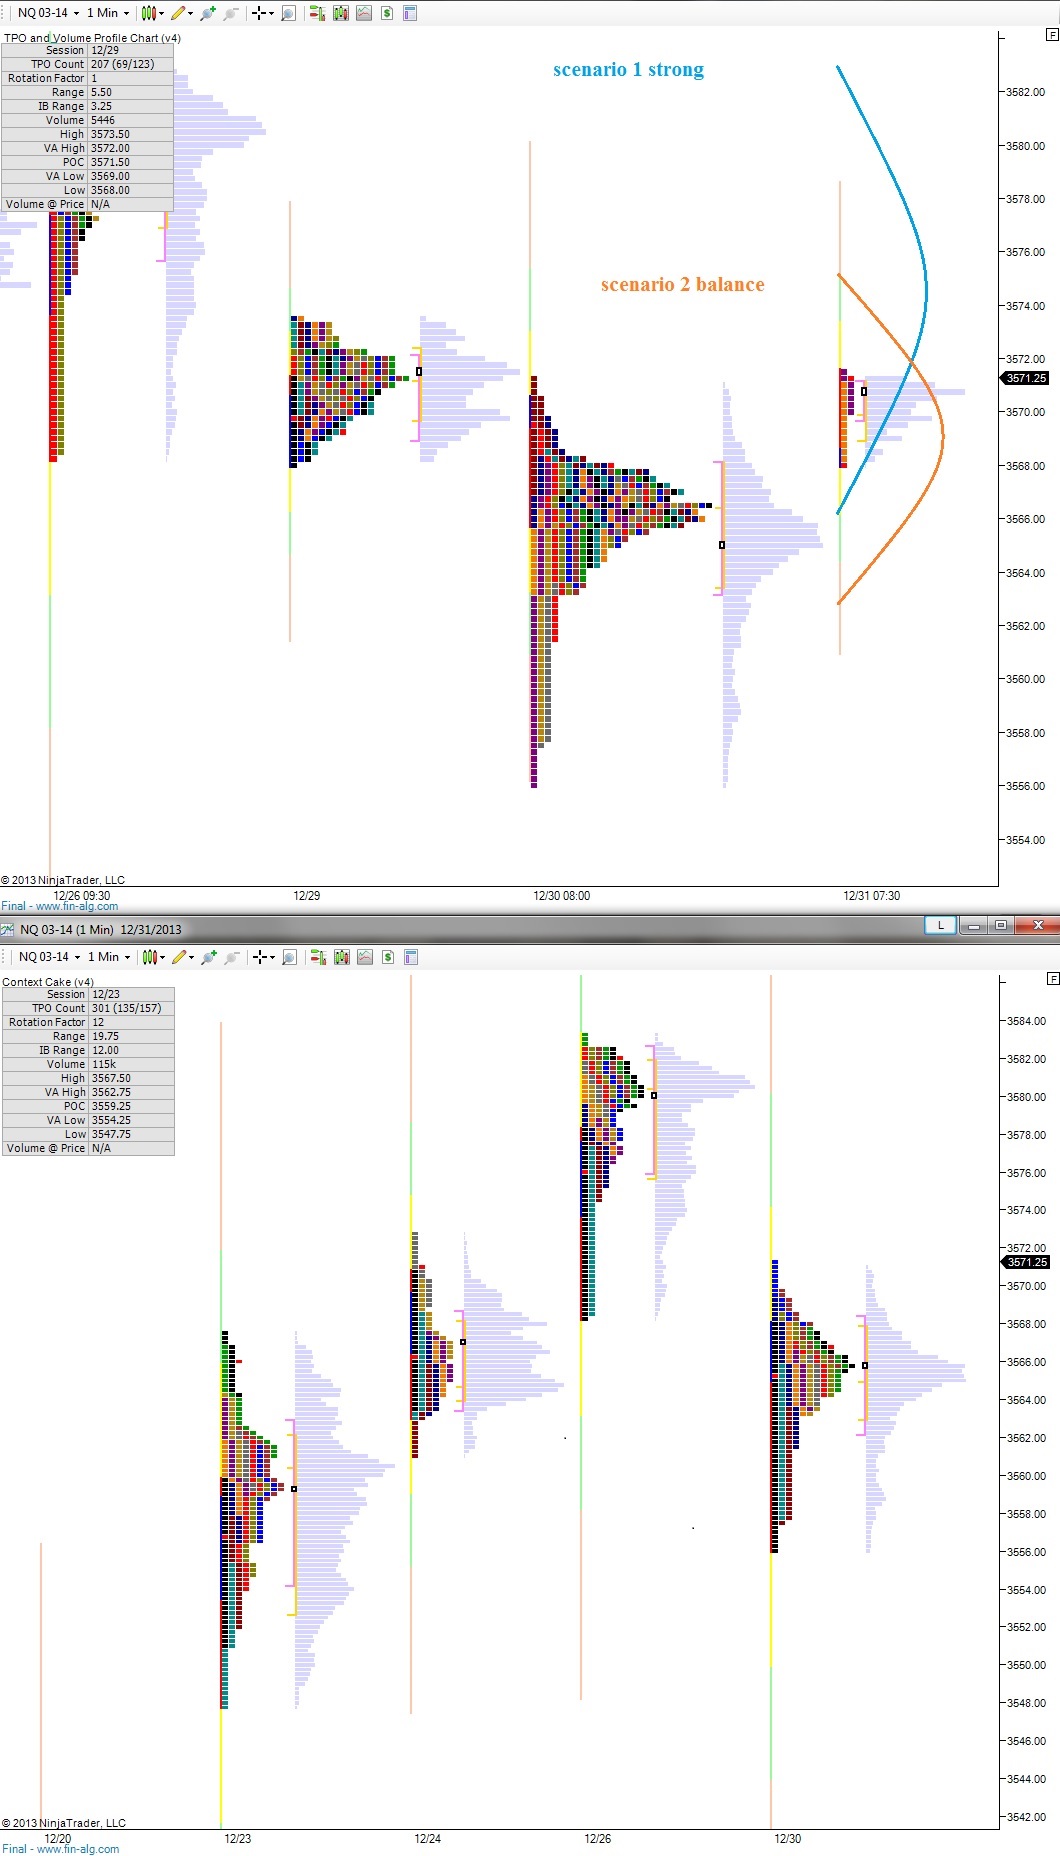
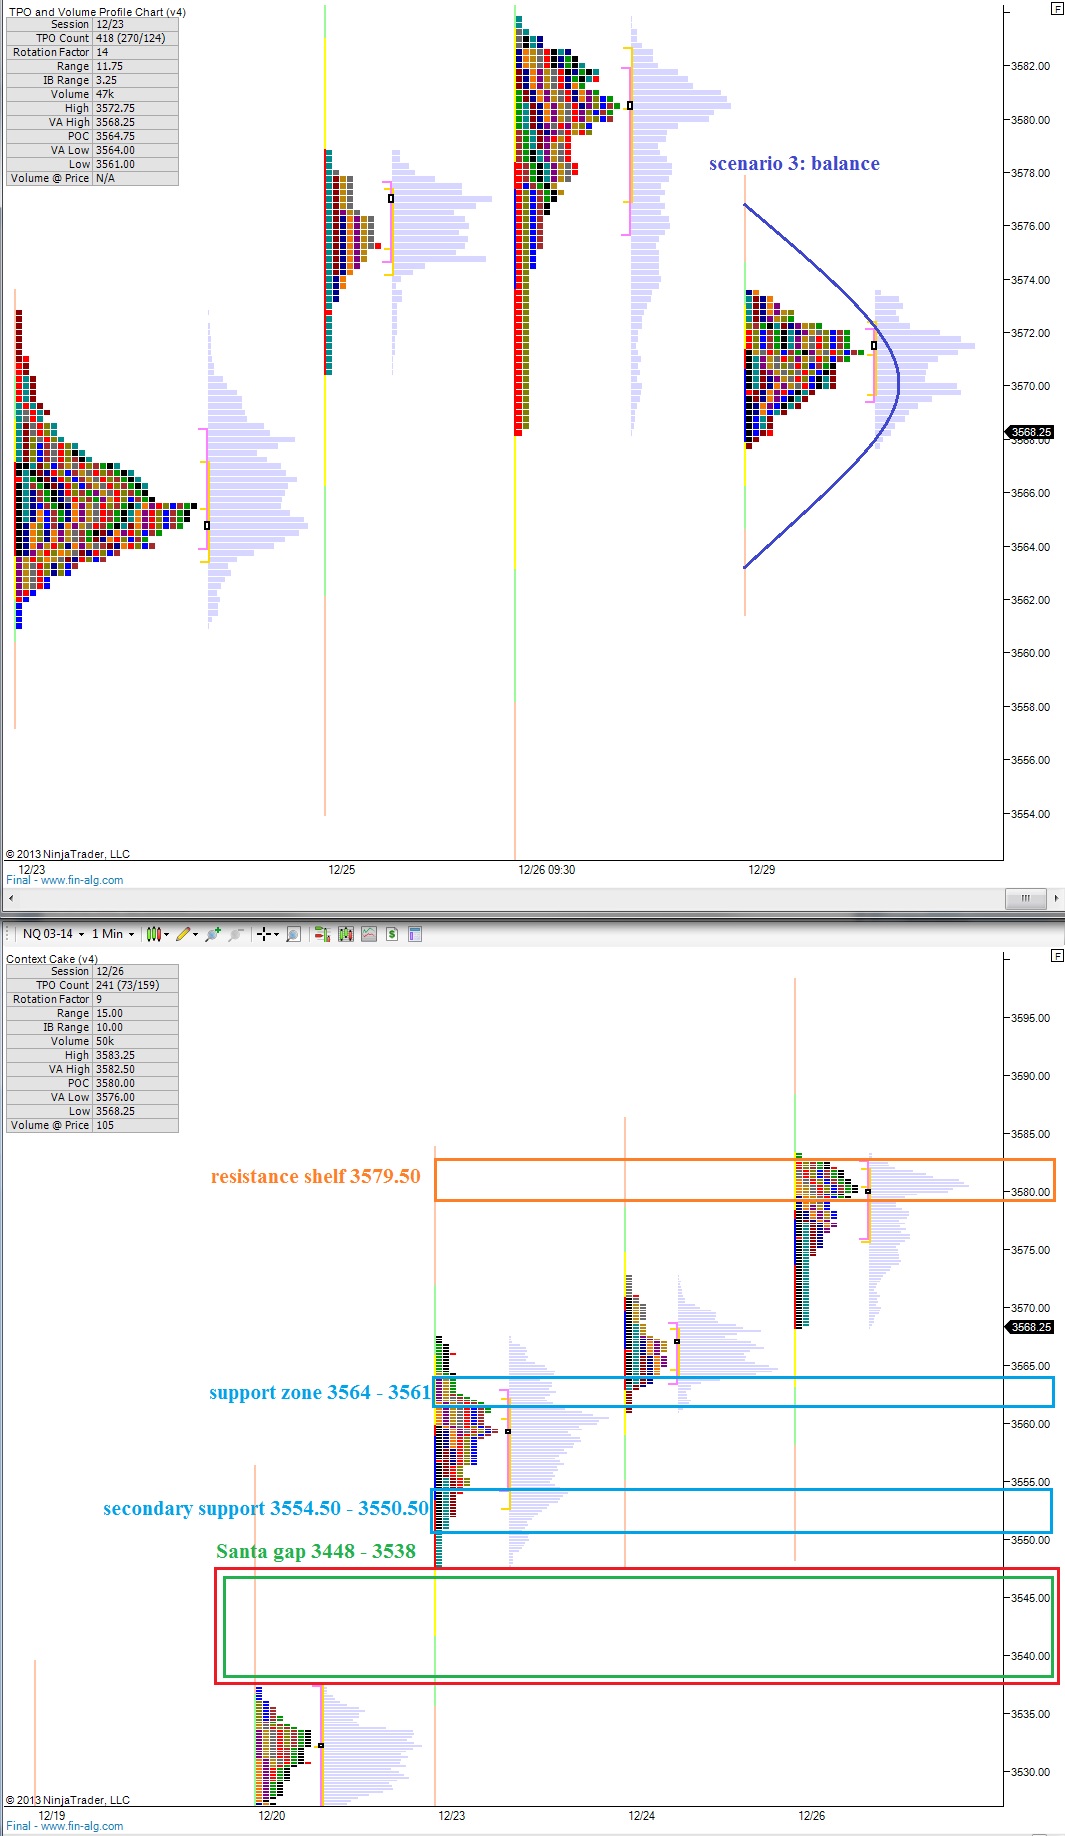
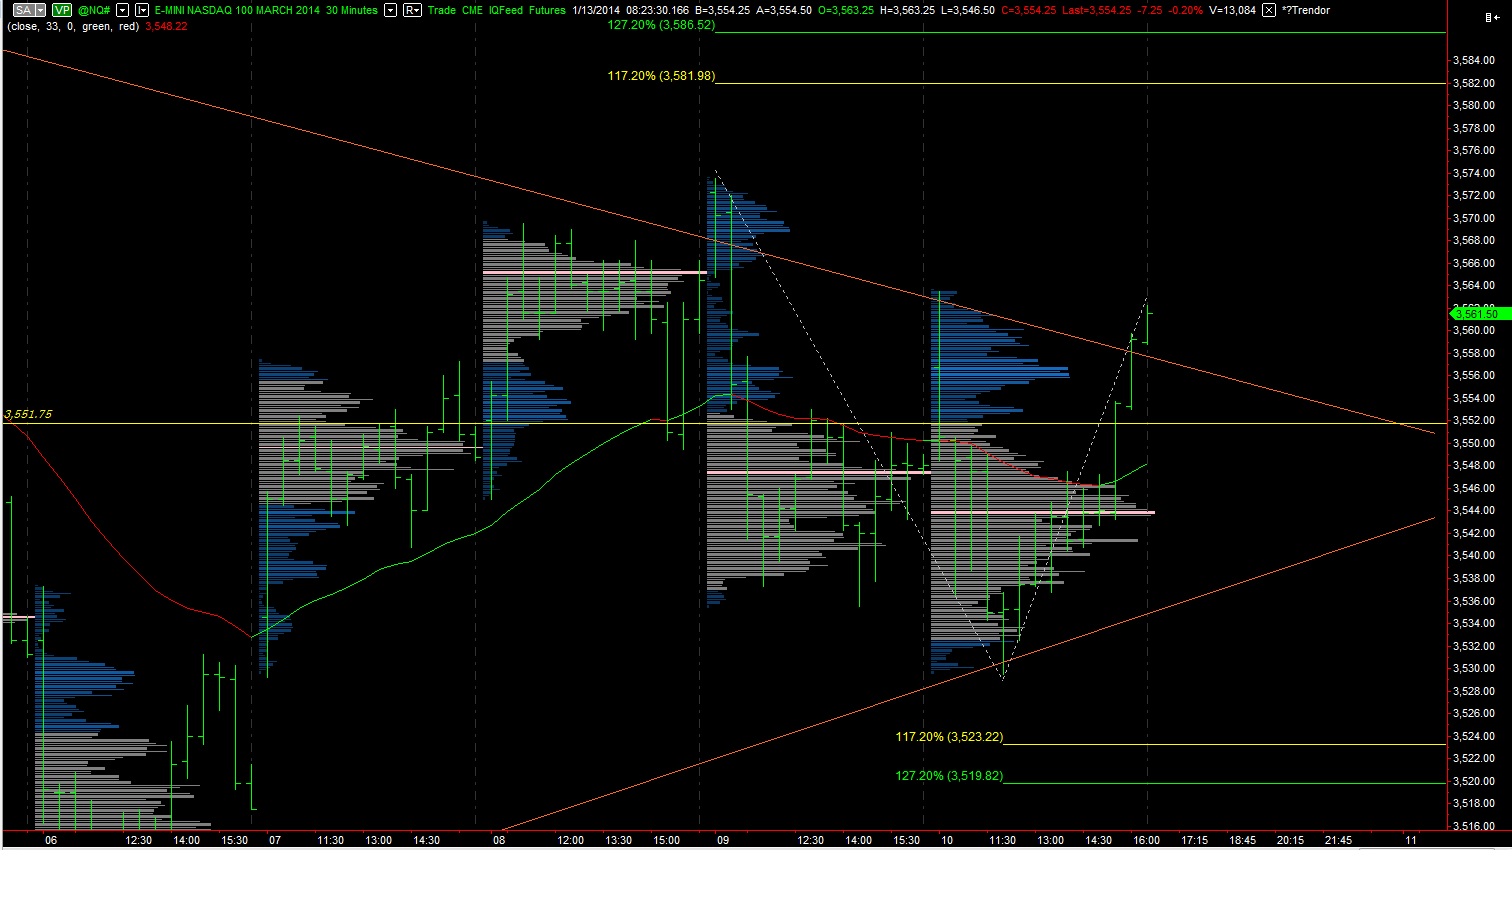
Next I have made RTH volume profiles for the NASDAQ via the /NQ contract. These will assist me in observing the day session and who is asserting control of the tape. We can see price consolidating recently. The past four sessions have been “P, P, b, b” in structure. In other words, two short squeezes then two long liquidations, but neither time did the consolidation break. This is big players wrestling for control.
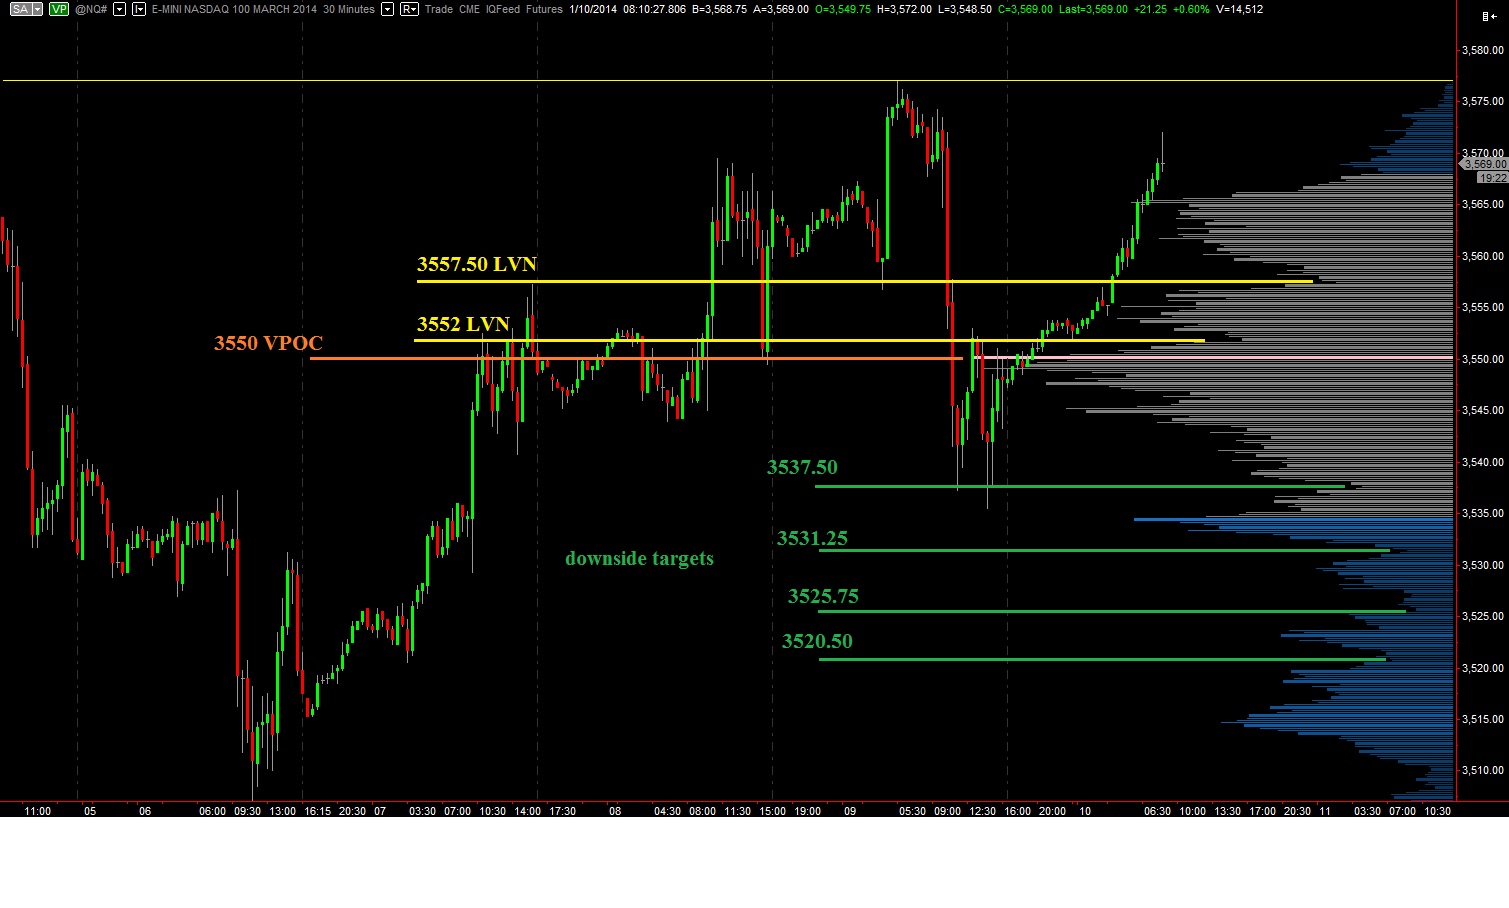
At the apex of this action is 3551.75. This price level has been the scene of many struggles between buyers and sellers and I will be using it as a pivot of sorts today. I have highlighted this level and my upside and downside targets on the following volume profile chart:
Comments »