There is only so much analysis one can do when the price of an instrument is climbing to fresh highs. Mostly I rely on measured move targets to the upside and highlighting support levels. This is important, but I much prefer the confines of territory we have already auctioned.
I have these expectations sometimes, based upon analysis, where I expect something like lower prices. Yesterday I was expecting some follow through on the morning weakness in the Nasdaq. The challenge with expectations, especially those built upon market profile logic, is the timing. The old axiom says the market can stay irrational longer than you can stay solvent. The duration of “longer than you can stay solvent” is drastically shortened when you add a big leverage element to your trading.
GPD numbers came in better than expected and jobless claims worse than expected. The initial reaction to this cocktail of economic numbers is buying across the equity index complex. Overall however, it appears we will be gapping lower on the open, an event we have not seen in the Nasdaq since 08/12.
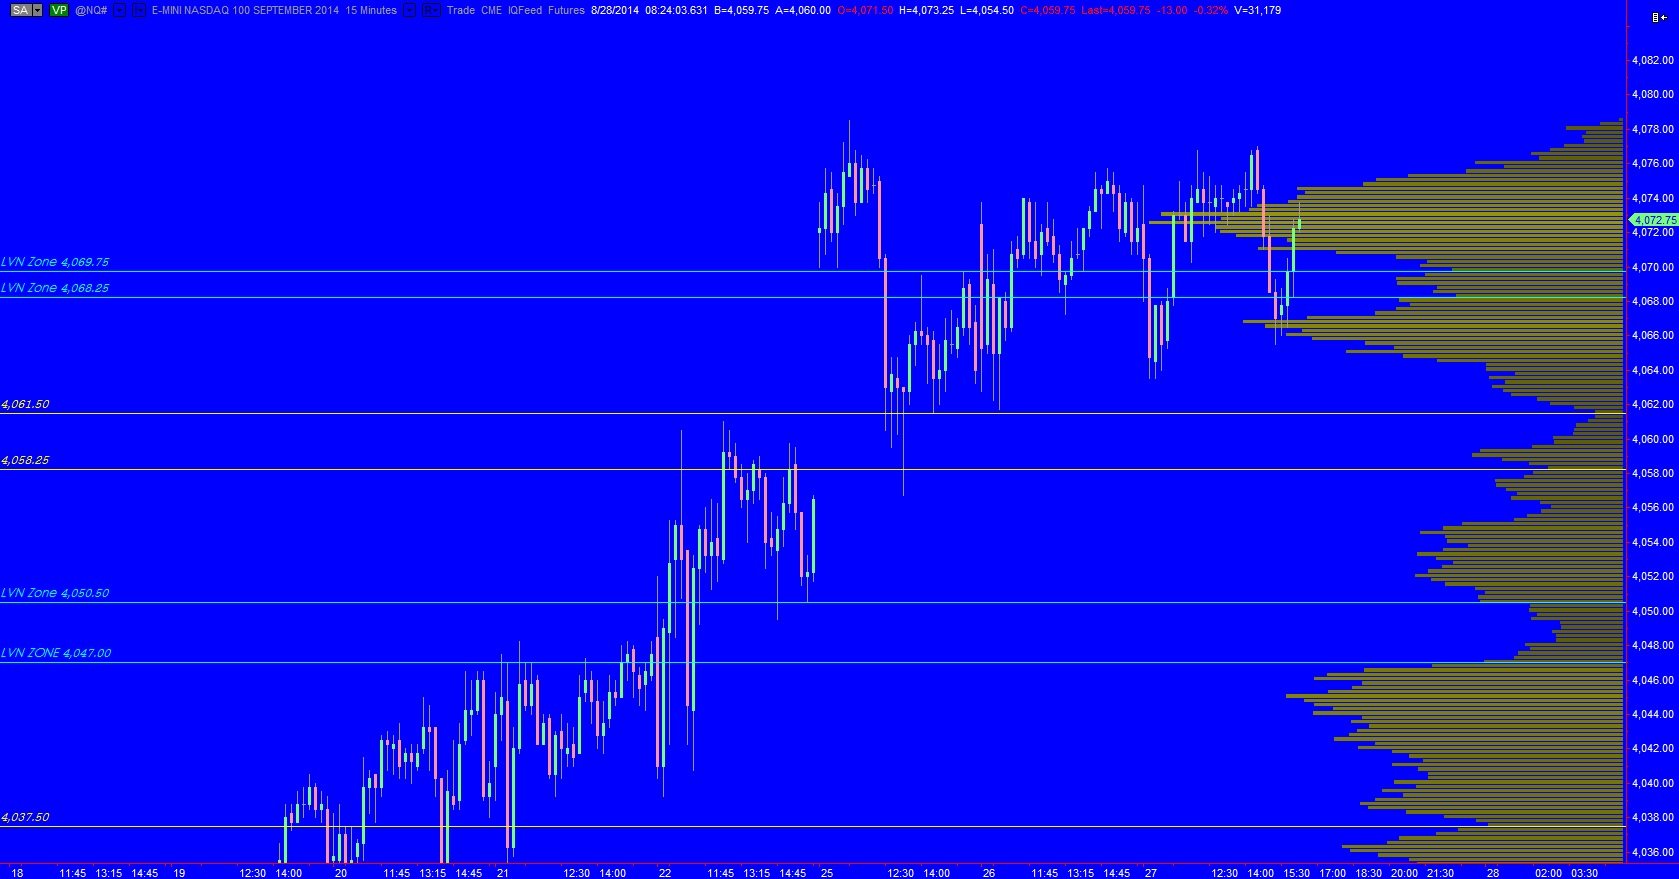
I have highlighted the key composite price levels on the following chart. I will be watching how we behave at these low volume nodes for clues about the ledge of overhead supply and looking for signs of dip buyers creating demand below:
I have noted the short term price levels I will be keying off of on the following market profile chart:
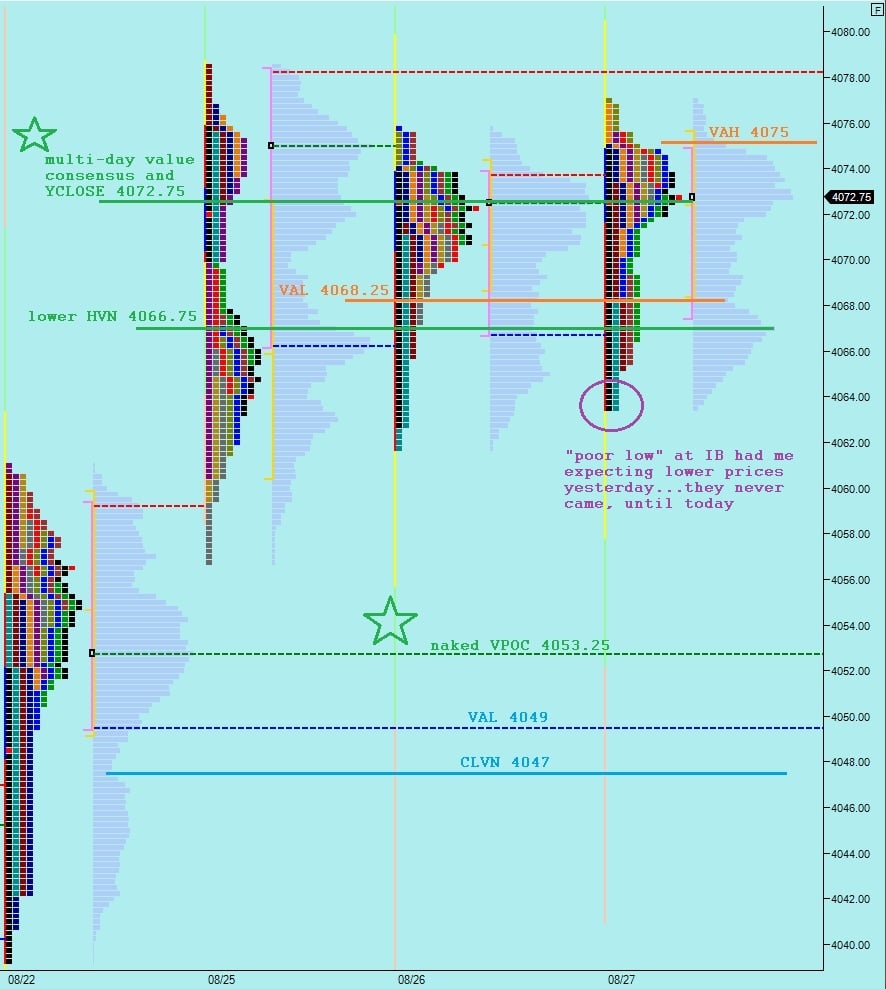


Primary hypothesis – opening on the cusp of 3 day balance increases the odds of 2-way OTF price action. Buyers push off the open to close the range gap to 4063.50 (poor low) and continue to HVN target of 4066.75. If responsive selling is found here then we rotate down to target naked VPOC at 4053.25 and look for responsive buying at 4049. Otherwise if we do not find sellers at lower HVN 4066.75 then a full gap fill to 4072.75 is likely
Hypo 2 – drive lower off the gap down, take out VAL 4049 and CLVN at 4047 and sustain trade below these levels before a second push down to 4037.50
Hypo 3 – sellers push off the open, down to NVPOC 4053.25 and we find responsive buyers around these levels who push us back up into yesterday’s range and target 4066.75
hypo 3 to a tee….then what?
couple things, open auction outside range, no real rotation out of it yet to gauge OTF participation, double bottom at o/n low 4054.50 is kind of weak, could test lower again. However buyers holding this MID at 4059.50 has me looking for a proper test of HVN at 4066.75. It’s still pretty murky though until we see a real rotation
love how I understand everything you say
I am glad you understand it! For a while it felt like I was taking to myself over here lol
Hey Raul, I was wondering why you analyze the Nasdaq as opposed to other indices and also how tight does the action have to be to qualify a neutral extreme?
action tightness does not factor in to whether a day type is neutral extreme. neutral extreme will have range extension on both sides of the initial balance and then end the day by closing near one of the range extremes (HOD or LOD). A tighter IB increases the probability of a neutral print because the range is smaller and thus easier to traverse in both directions. Today’s IB in /NQ_F is 10 points, the very low end of normal for this instrument
Sorry, I meant how tight does the EOD action have to be.
first thing first you need a neutral print established, then a close in the upper or lower quadrant of the range is reasonable to consider calling it neutral extreme. thus divide it into four pieces and look for a close in either extreme quad to qualify as neutral extreme. Again – not a concrete rule but a good reference nonetheless…the more extreme your close the more directional conviction in theory
Okay, thank you. And thanks for the crash course, I’m enjoying your blog much more =)
I analyze the Nasdaq because most of the stocks I trade correlate well with the oscillations of /NQ, plus I intend to go back to day trading this product soon and want to be intimately familiar with it. I keep an /ES (S&P) market profile also. It develops more slowly, has less intraday “tells” but is still important