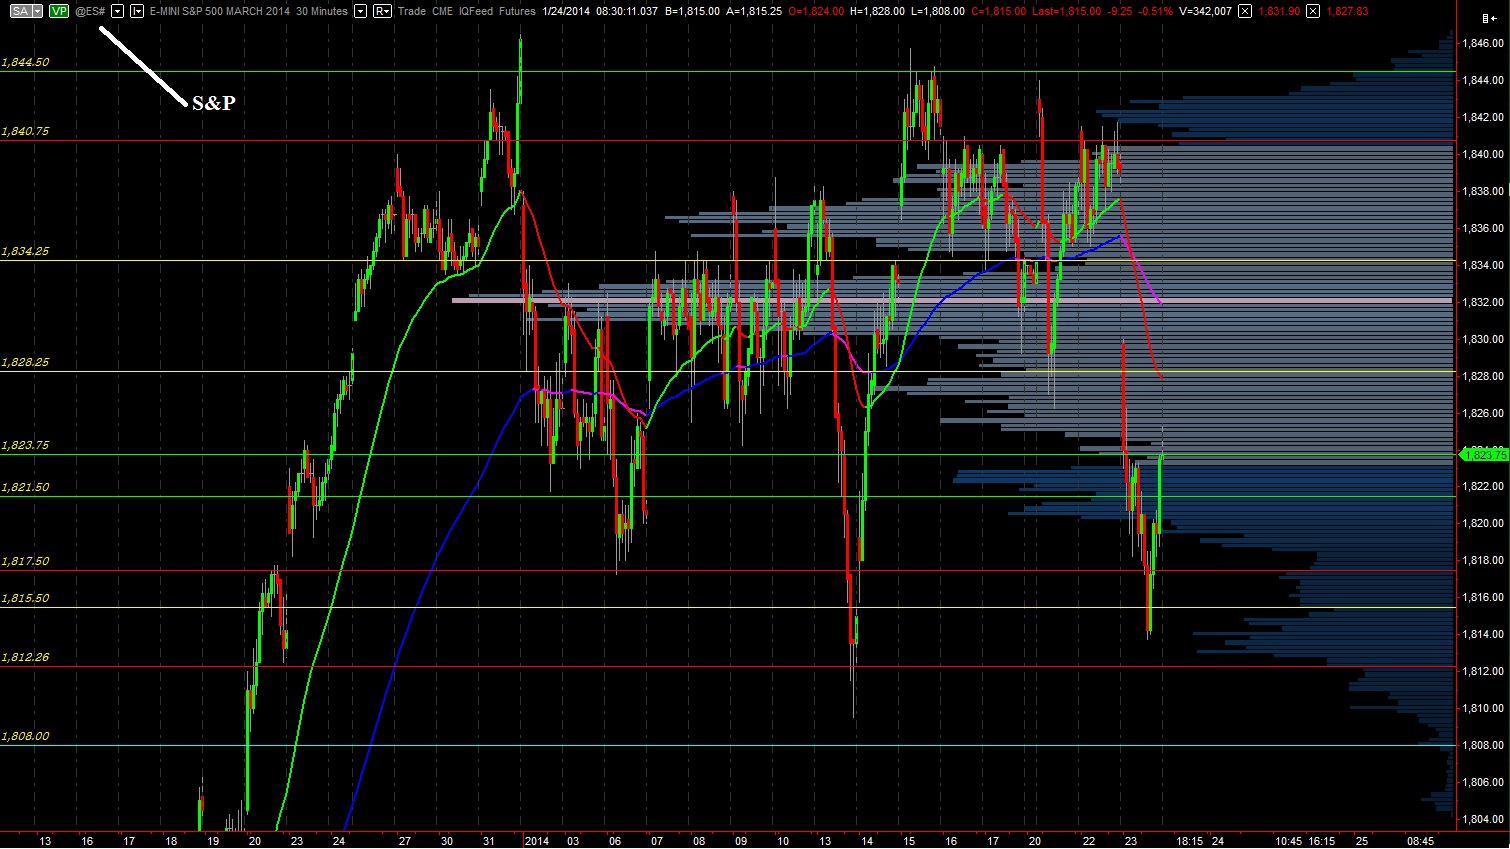
More waves of selling rippled through the marketplace last night, as the afternoon bounce in both the S&P and NASDAQ were faded. A bit of a risk divergence emerged from the move. While the S&P was able to take out our low on yesterday’s session, the NASDAQ held. Since reaching short-term oversold conditions on both indices, we are coming off the lows into the early USA hours.
With my really fancy futures data (FFD) I get to a clean look at exactly the ticks where events of interest have occurred. I share these ticks with you, finest people of the interwebs, because we should all have this information available while making our educated guess on market behavior.
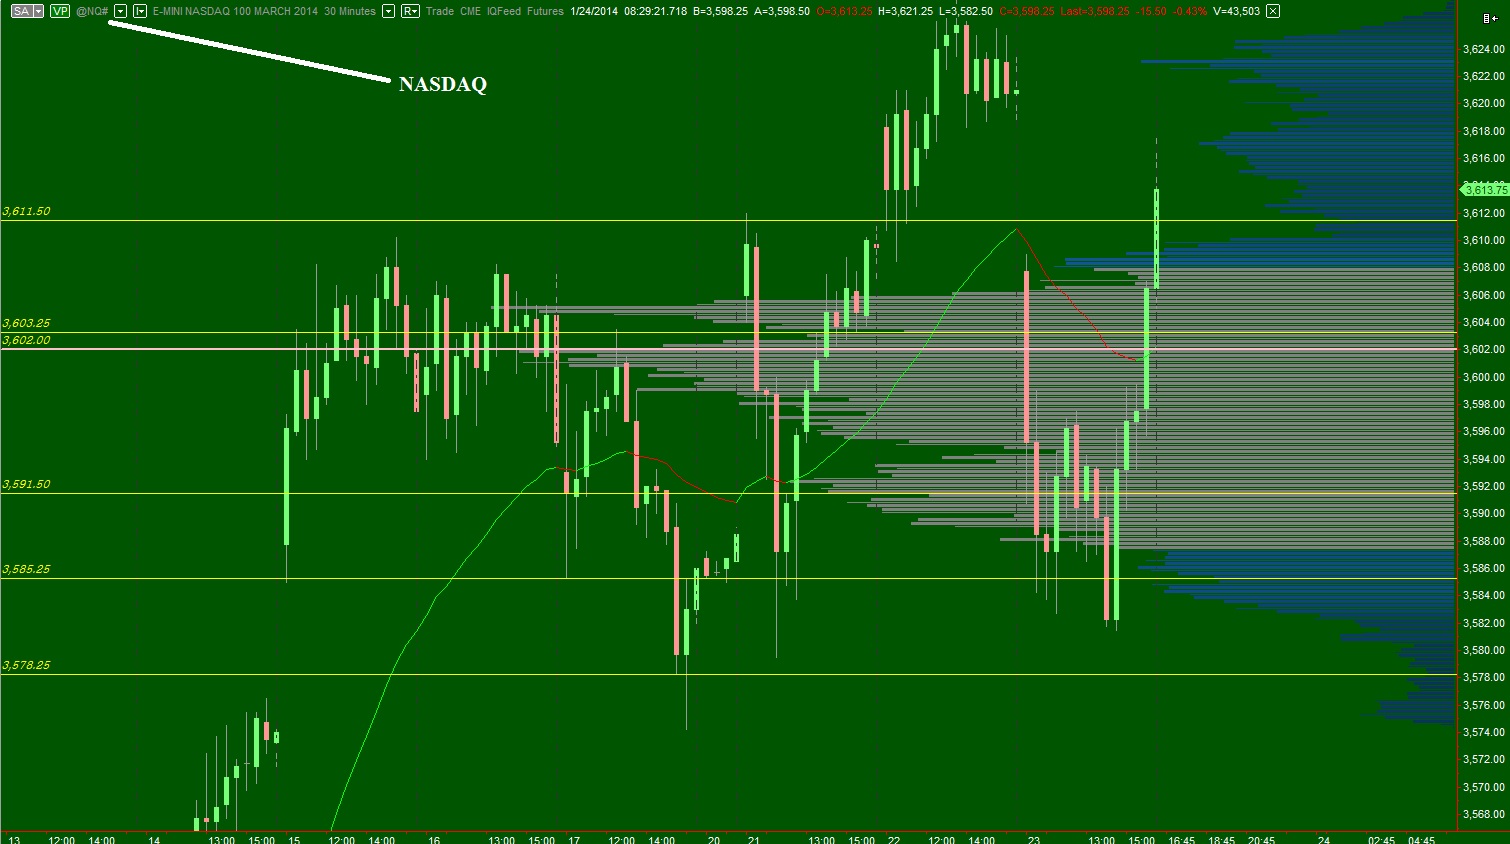
I will make one note and then present my intermediate term balances. Yesterday the NASDAQ market profile print had a smack of long liquidation—a temporary market phenomenon driven by forcing participants to liquidate their positions. It resembles a lowercase letter b. These typically signal a strong initiative seller entered the market in the morning, but the force of selling was met by sufficient buy flow. As a result, no further progress was made in the afternoon. This is what may have sparked the afternoon ramp. Be aware there are large timeframe traders here, aggressively battling for control of an intermediate term balance. Try not to get too beat up in the waves they produce.
We are on the [very] low end of intermediate term balance. I will be looking for signs of buyers. I have highlighted this intermediate term balance using the following two volume profiles: