Nasdaq futures are trading lower overnight as we come back to the market after a long holiday weekend. Last week was a very strong week for the composite and extended the new swing high made in the prior week. The net result of the action is an extended chart with buyers doing a good job migrating prices higher. The biggest economic news overnight was weaker-than-expected industrial production numbers from the Germans. We have little on the docket in the United States until Wednesday when The Fed will release minutes from their June meeting.
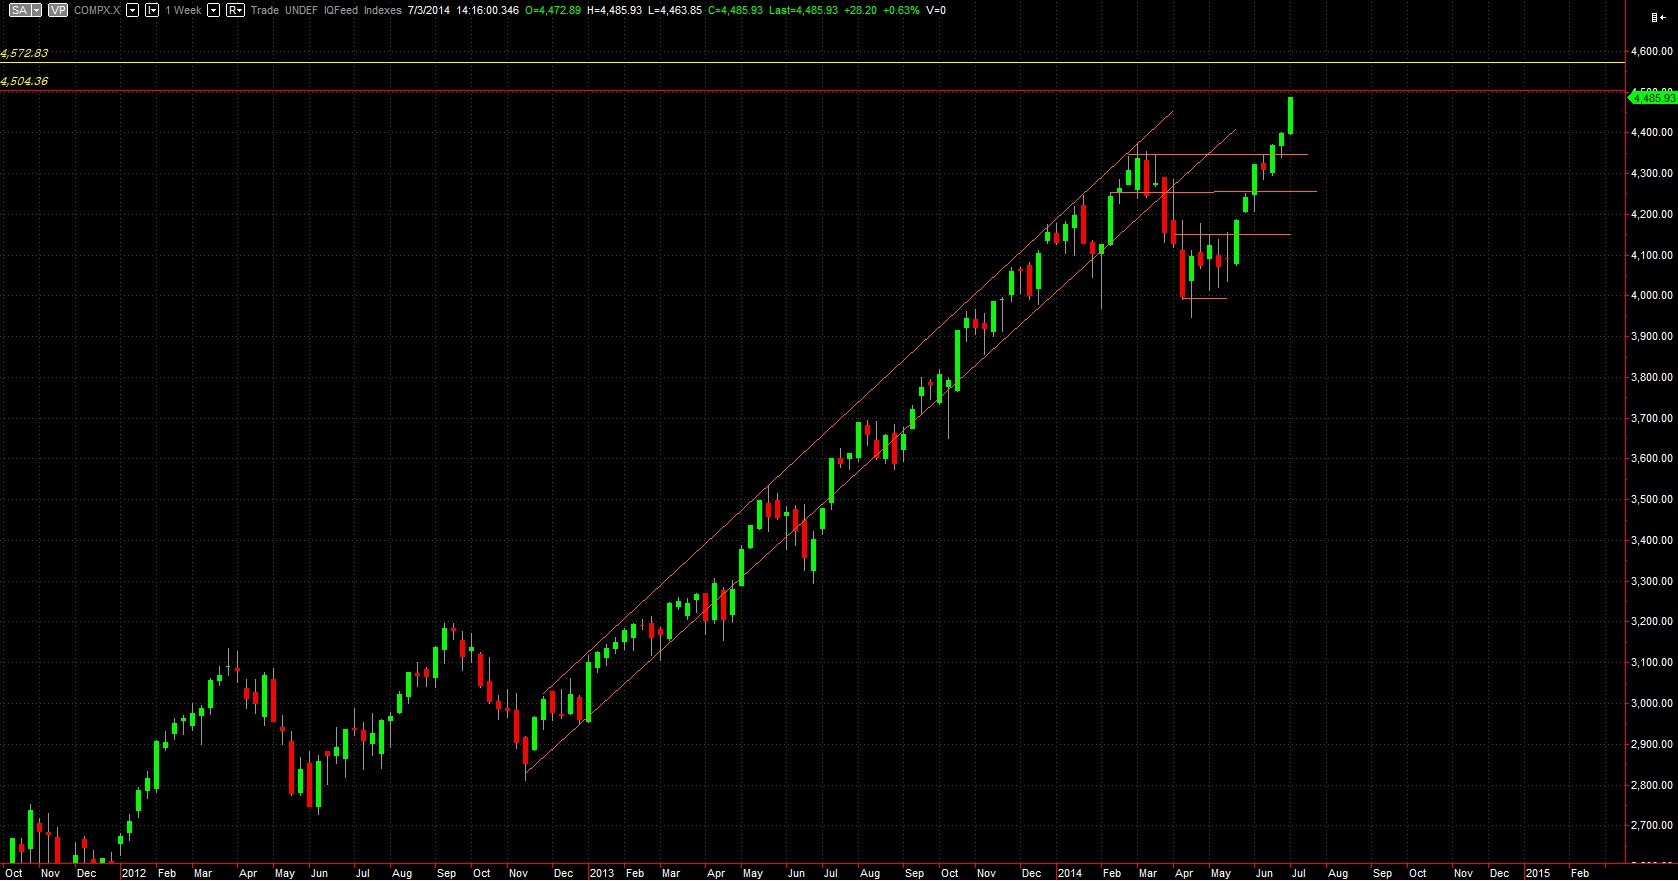
Looking at our long term Composite chart, you can see buyers in control via seven weeks of near uninterrupted progress to the upside. I have highlighted two price levels above our current price action. The first, red line, is where the 14 year old gap in prices starts and the second yellow line is where the gap ends. This the biggest piece of context I am observing above. Gaps tend to initially offer stiff resistance, perhaps even several times, before possibly being filled and likely in a rapid manner:
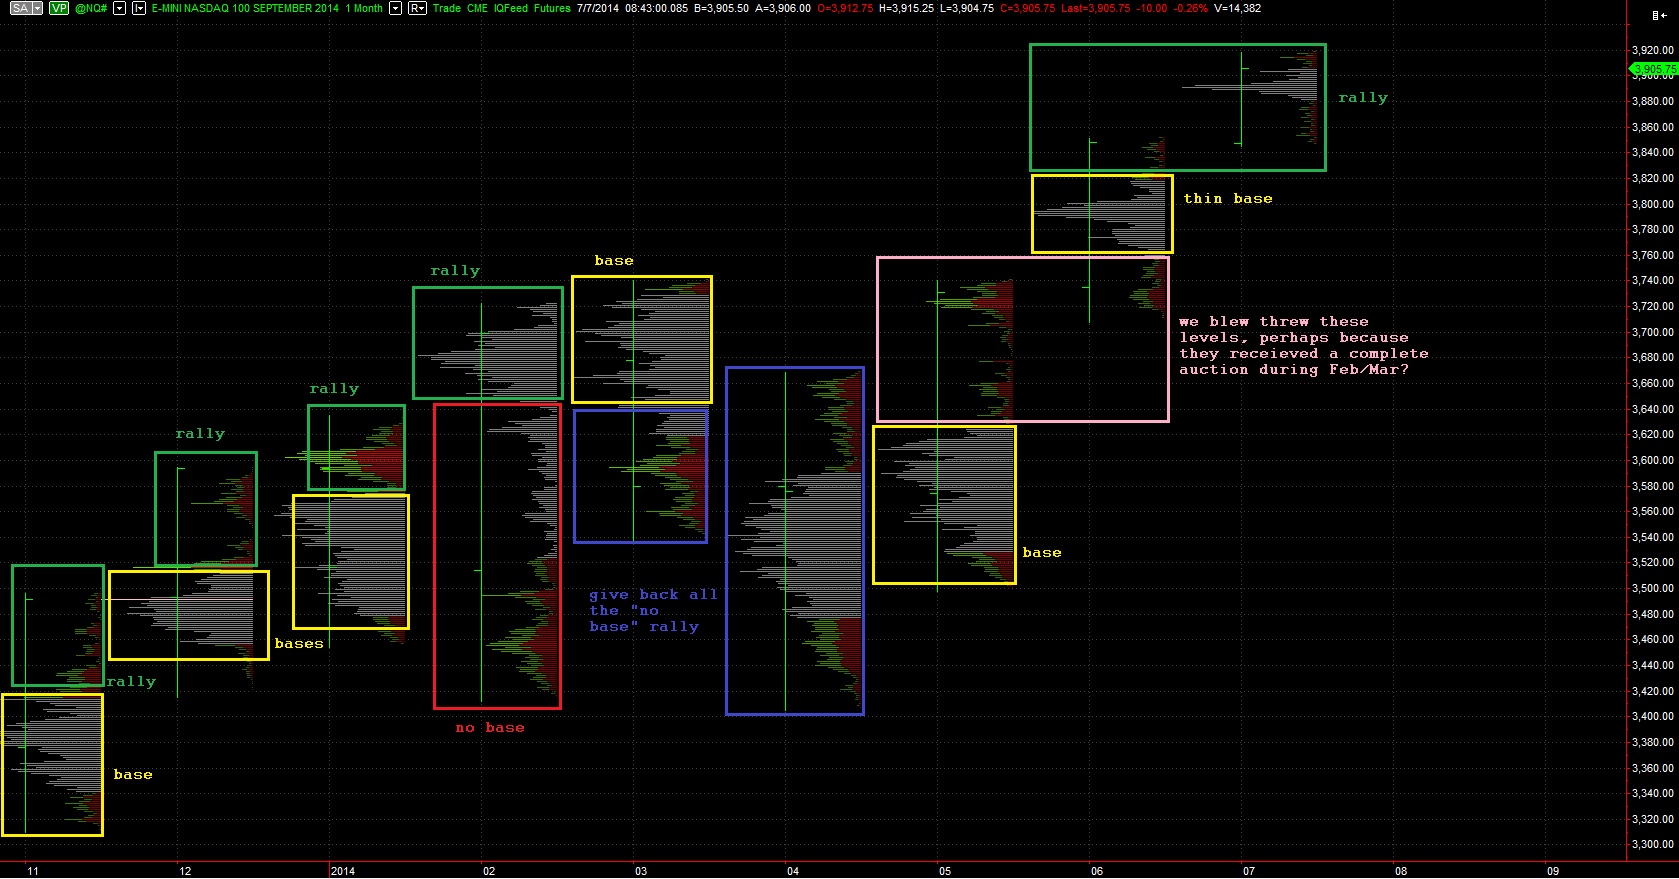
Long term, there is a bit of structure that troubles me a bit and it started in May. When I look at the monthly volume profiles, I see weakness in our recent bull run, the foundation poured before the rally seems odd. These long term context pieces are just that, long term, and are the very broad strokes before honing in on the more actionable short term. See below:
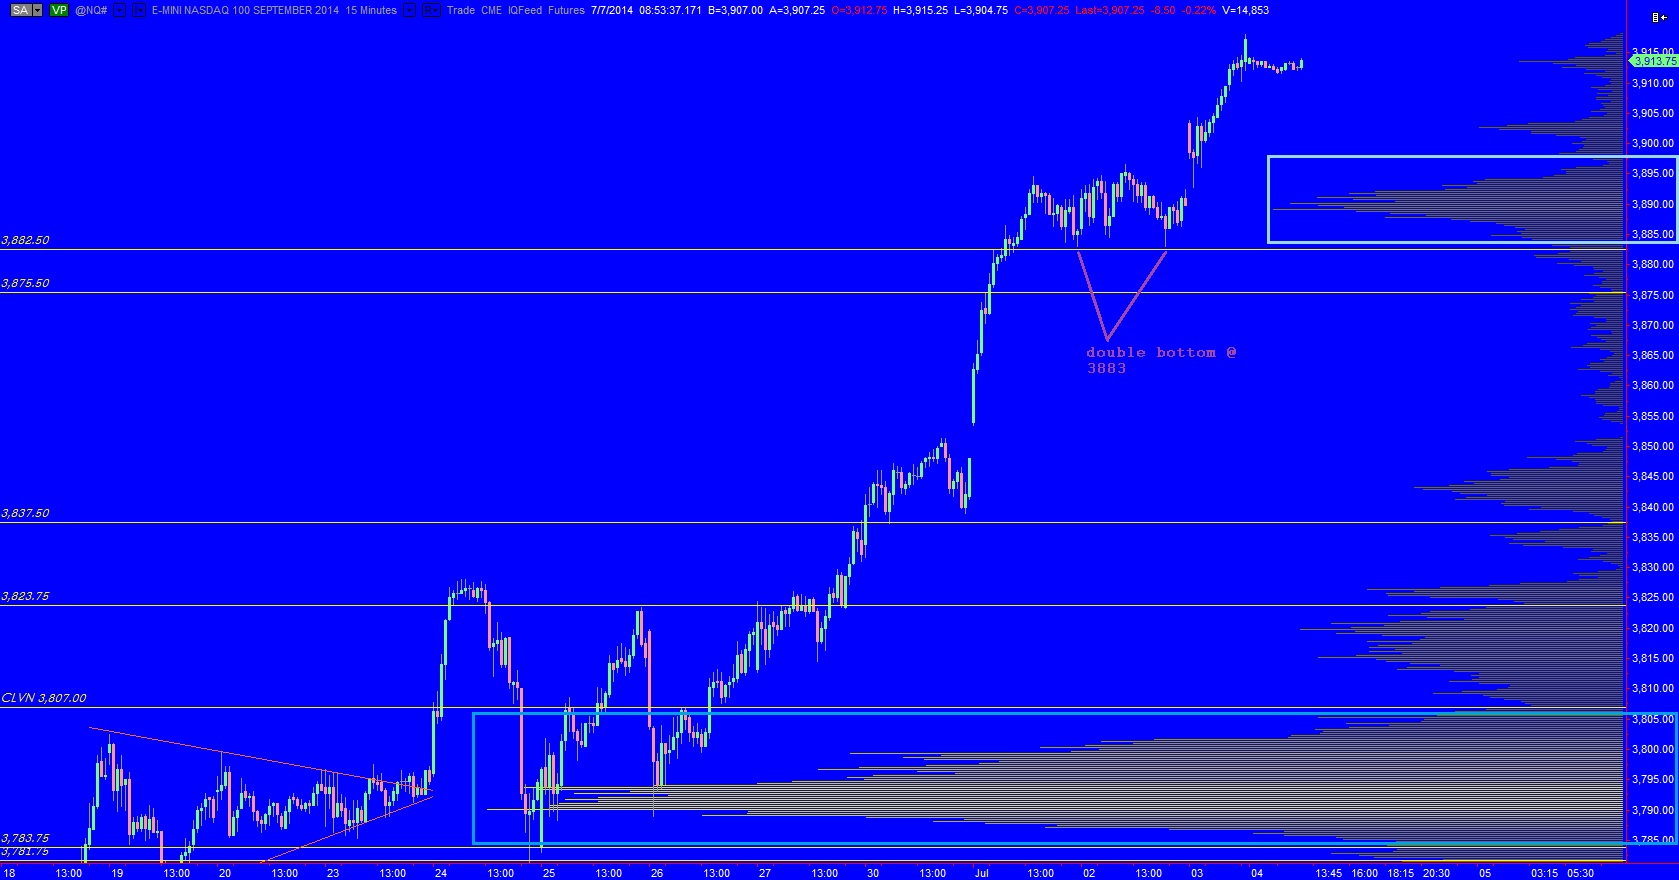
Intermediate term we might see a better perspective on just how much progress buyers have made these last two weeks. There was a significant compression down near 3800 and buyers used its combustion to propel market prices over 100 Nasdaq points higher. In their wake is a thin stretch of volume profile with some low volume nodes we might begin testing out if sellers start responding this week. There is some structure near 3890 but no really thick volume structure until you look down to about 3800. This is climbing the wall of worry and it appears many participants have opted to do so, see below:
Taking to the market profile, we can see the market never really came into balance as we closed out the week. The only balanced profile in sight occurred Wednesday after the trend. I broke out part of the trend day, the part where the trend ended, and combined it with Wednesday’s balance. This gives us a nice thick balance structure below to monitor. It also made the vulnerable double bottom more clear to see at 3883. We are currently set to gap lower inside an unbalanced profile which buyers were in control of at the end of last week. This lack of balance and the gap lower might lead to some interesting intraday action to start the week. I have highlighted some of the key zones I will be observing on the following market profile chart:
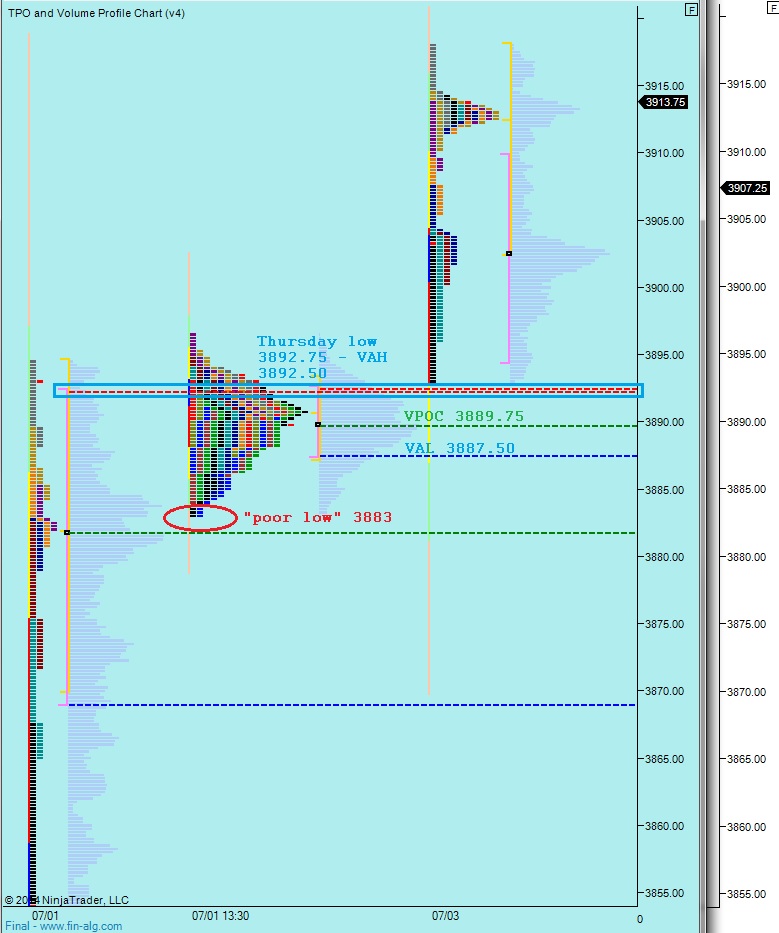


hypo 1 – rotate higher to fill overnight gap to 3913.75, find responsive selling to rotate down to test 3900 and possibly Thursday low/VAH @ 3892.75
hypo 2 – press lower off the open to take out 3900 then test 3892.75 and find responsive buying, eventually balance out near 3900
hypo 3 – rotate down through 3900 and down through VAH 3892.50 to test VPOC at 3889.75 and VAL 3887.50. If no buyers show then take out poor low at 3883.
hypo 4 – press overnight gap closed to 3913.75 and continue higher to Thursday high 3918