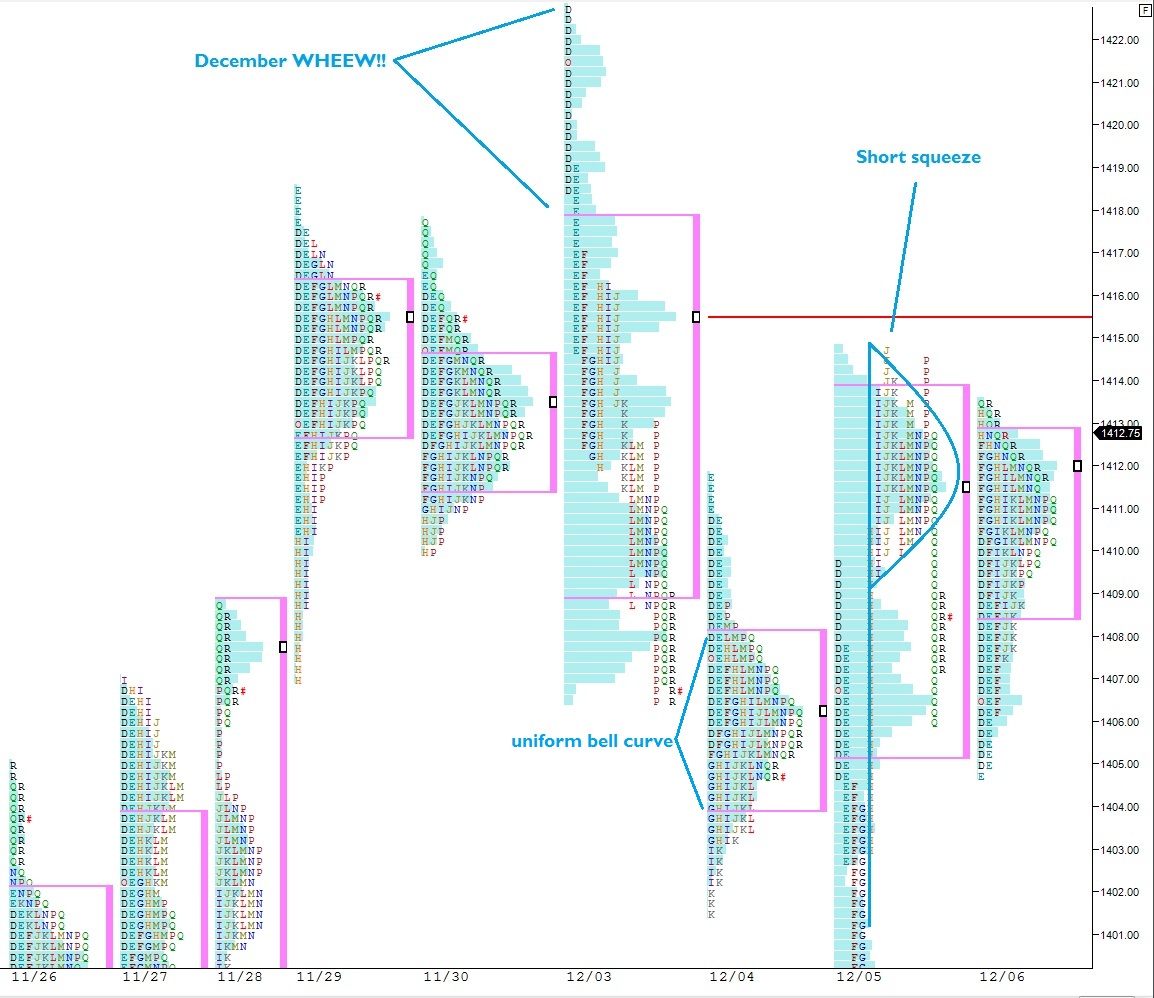
When the daily price bars start to tighten up on the SPY ETF, I like to take out my magnifying glass and take a closer look at the auction activity. Looking at a chart of the cash trading hours (9:30am-4:00pm EST) shown in market profile accomplishes this task.
We started the month this Monday with a euphoric gap higher and price was quickly knocked down and with enough steam to blast price below the value established at the end of last week. Price gapped too high, and the sellers reacted by smacking the penis or whatever it is Rhino likes to do.
Tuesday formed a very balanced, Gaussian curve of activity. Look at the shape of the profile, a very uniform bell curve. Balance was reestablished after the bears controlled price Monday. The buyers were back. Then yesterday morning (Wednesday) the bears showed some aggression and tested lower. Shortly after a vicious short squeeze ensued, giving us the familiar “P” shaped profile.
A short squeeze profile during a downtrend usually indicates a temporary market imbalance, and a continuation in the trend lower is likely to resume. However, during this indecision, after a V-shaped recovery, it can be the spark to get a rally started. Today’s action was tight and contained mostly within Wednesday’s value area. It sat put, while the euro dollar went off a cliff.
I glean bullishness from this closer examination. What firms my stance? Key levels above need to be captured ASAP by the bulls:
Wednesday’s high: 142.16 SPY
Monday’s VPOC: 1415.50 ES_F (right near Wed. high)
Sustaining trade above these levels gets the bears on their heels.
Watch for a flush if we spend too much time below today’s value area 1408-1405.


More on this
Will do Barbarossa.
Agree.