Nasdaq futures are lower this morning on heavy volume and an above average range. The selling started not long after cash markets closed in the USA and it made an aggressive rotation between 3-5am. The economic calendar is quiet as we head into the weekend with the most significant events being various Fed members speaking at 9am, 1pm, 2pm, and 3pm.
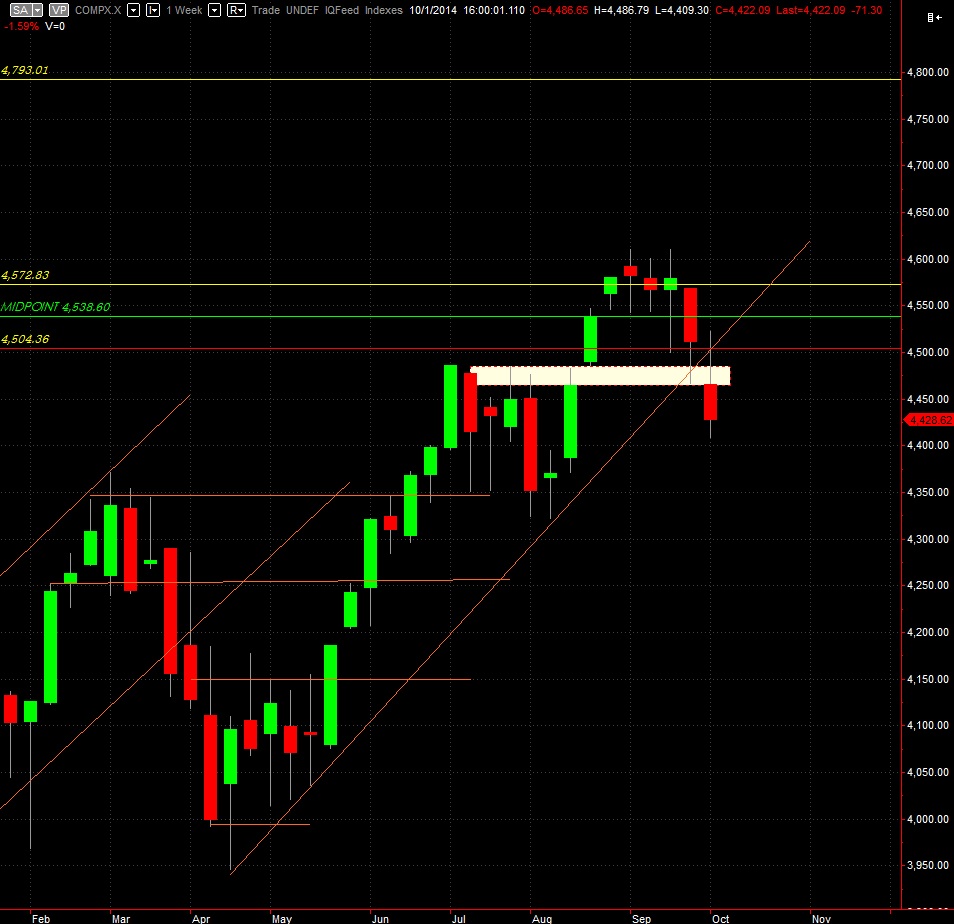
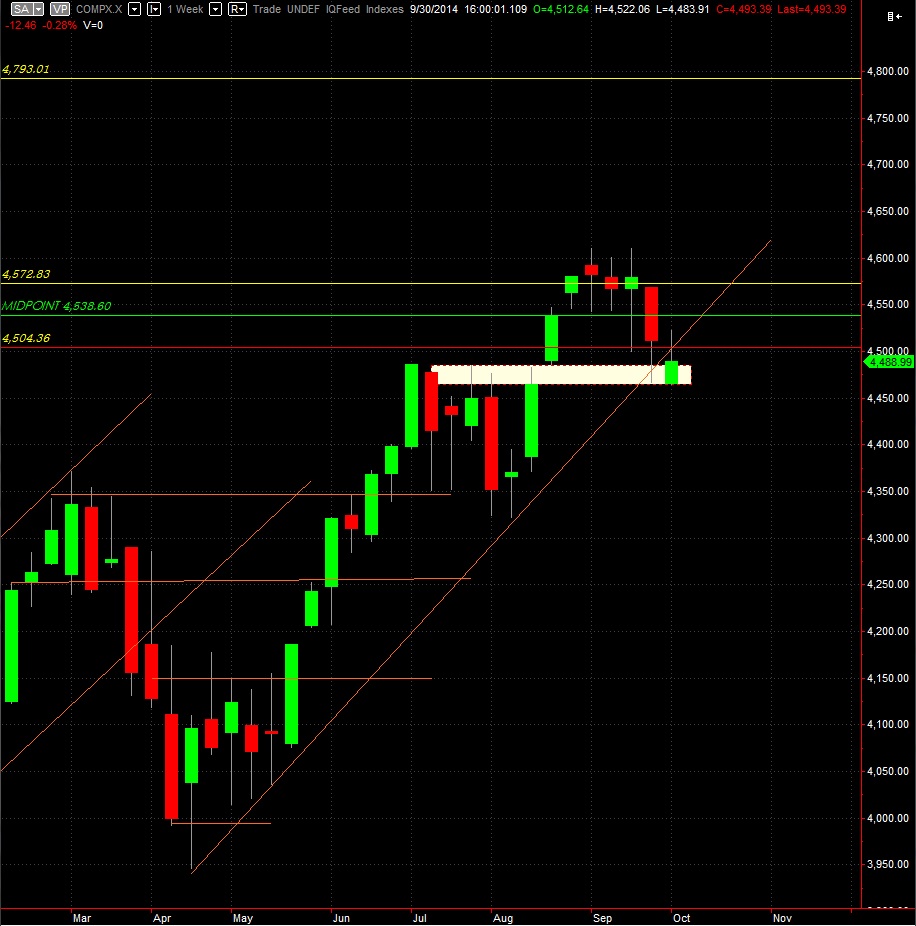
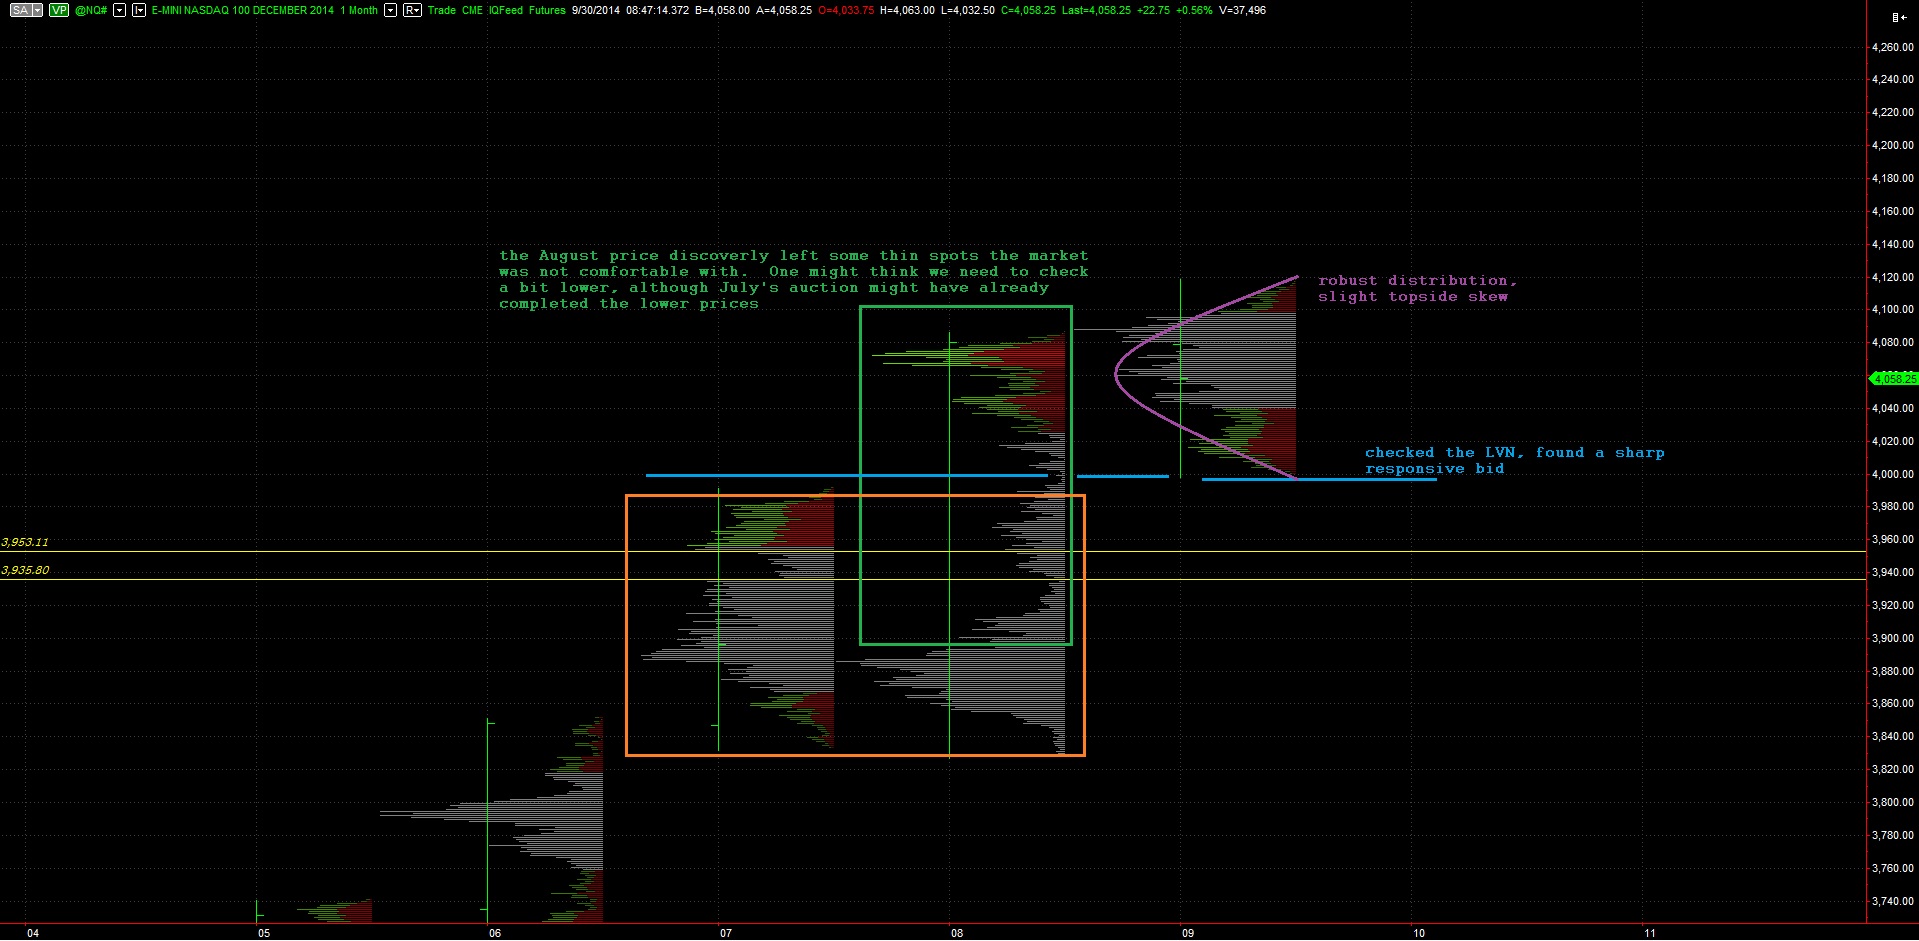
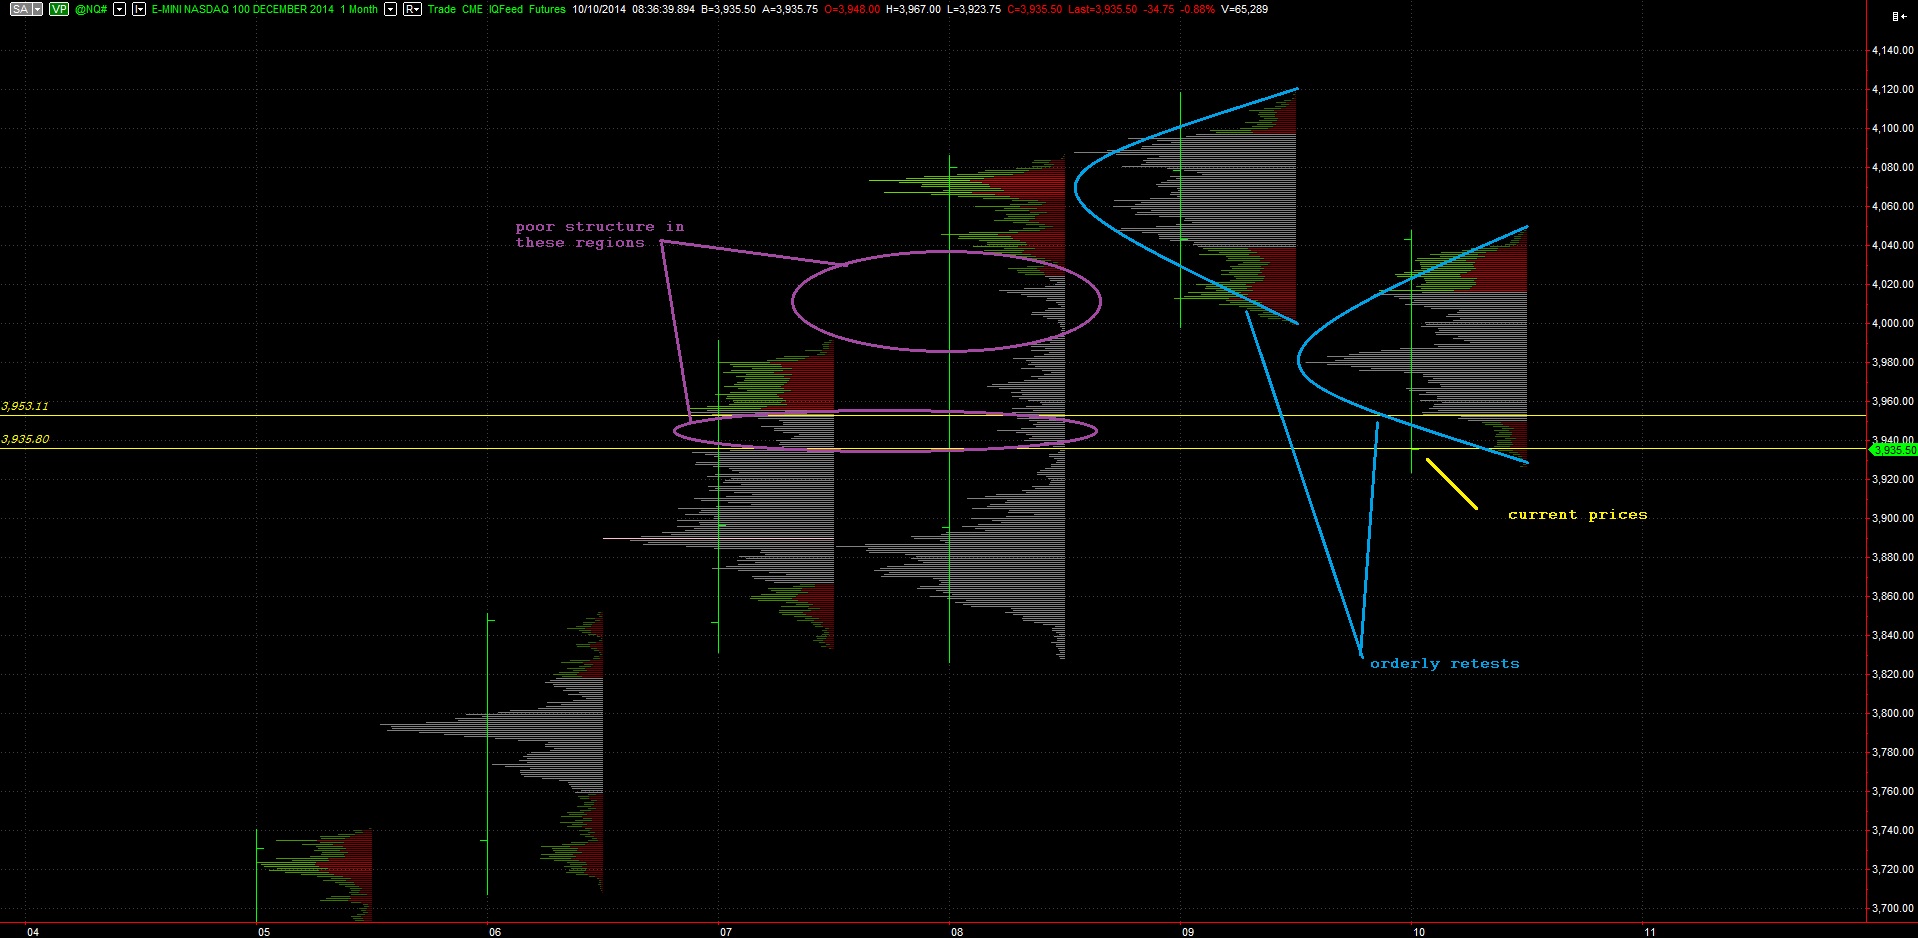
The Nasdaq is the weakest index this morning, but before we get too far ahead of ourselves, let’s have a look at the monthly volume profile chart to have an idea of where we are trading. Imagine you were driving from New York to Las Vegas. Being a resident of New York you are familiar with the roads you need to take to reach the major interstate. Once on the highway you can use a national map to guide your course. Once you enter the state of Nevada you would switch to a state map and once inside the city a city map and once inside your casino perhaps a casino map. The monthly volume profile is your national map. As you can see below, we are still trading above the largest volume distribution of August. When we went for a rally in August we left behind a poor structure which the market is now retesting. The current pocket we are trading in had decent price memory in July, but just above us (the two yellow lines) there was little-to-no history until this month. This is settling unfinished business. Price could still head lower but at the least we know we are coming into some solid structure:
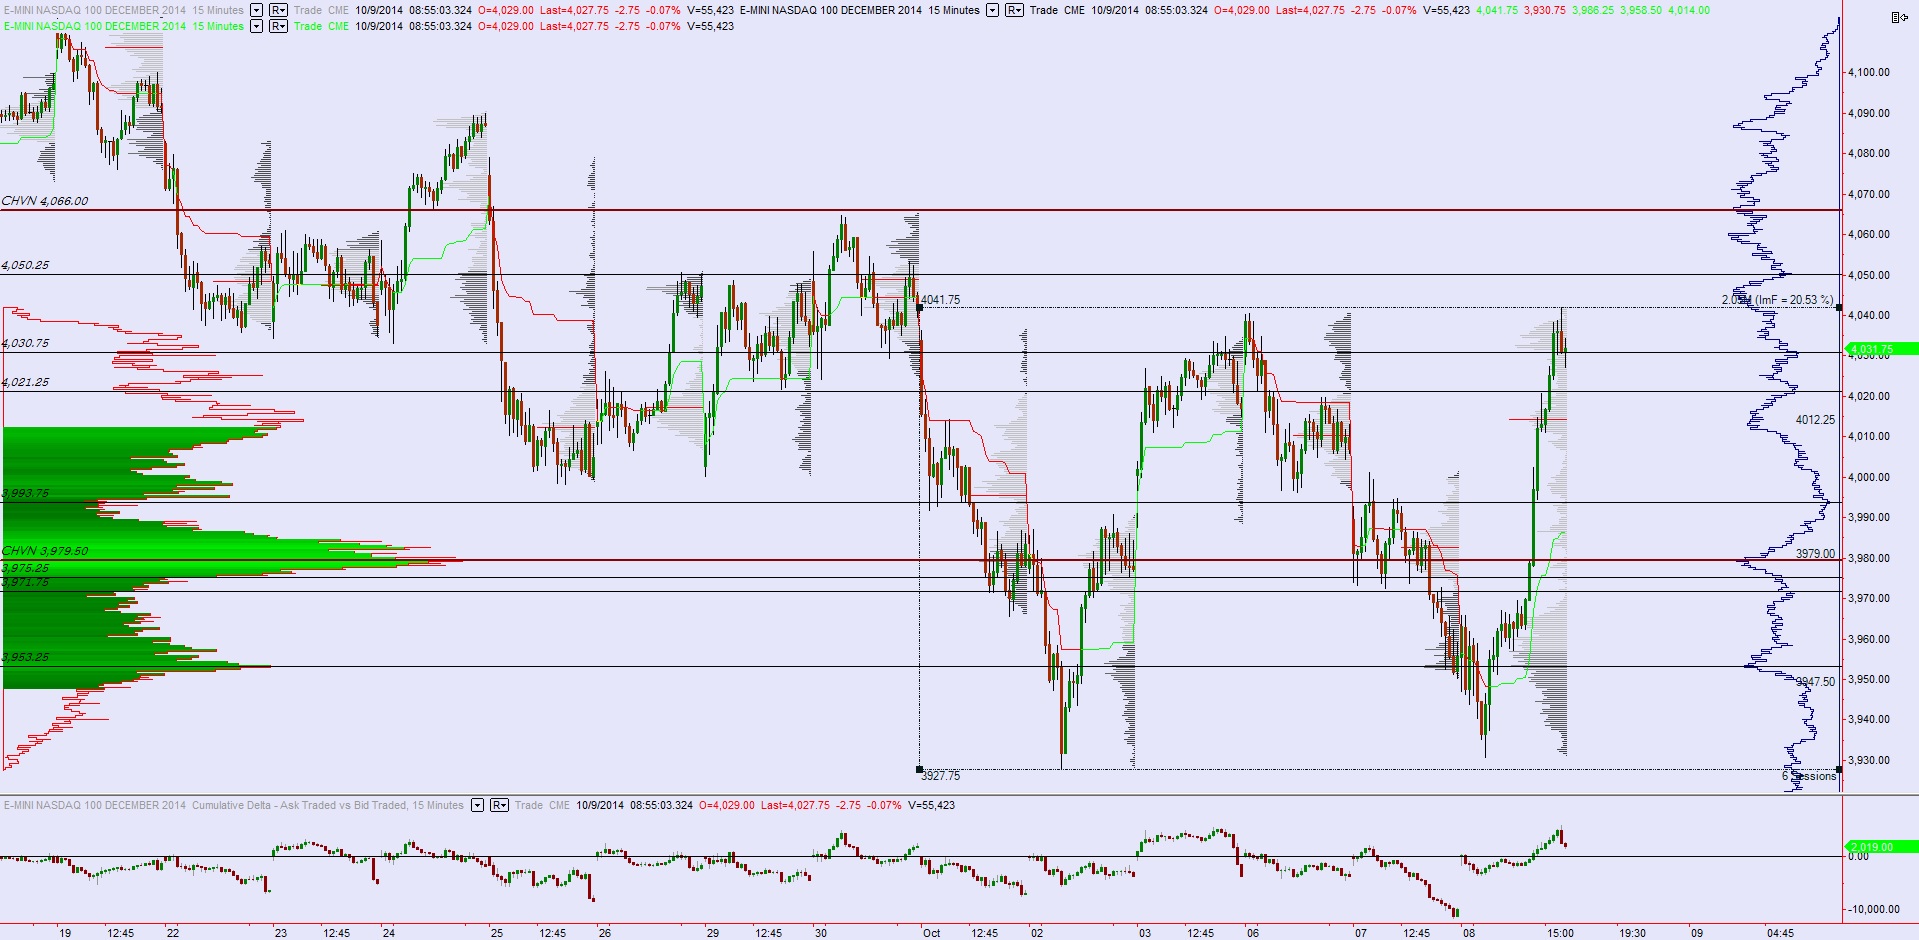
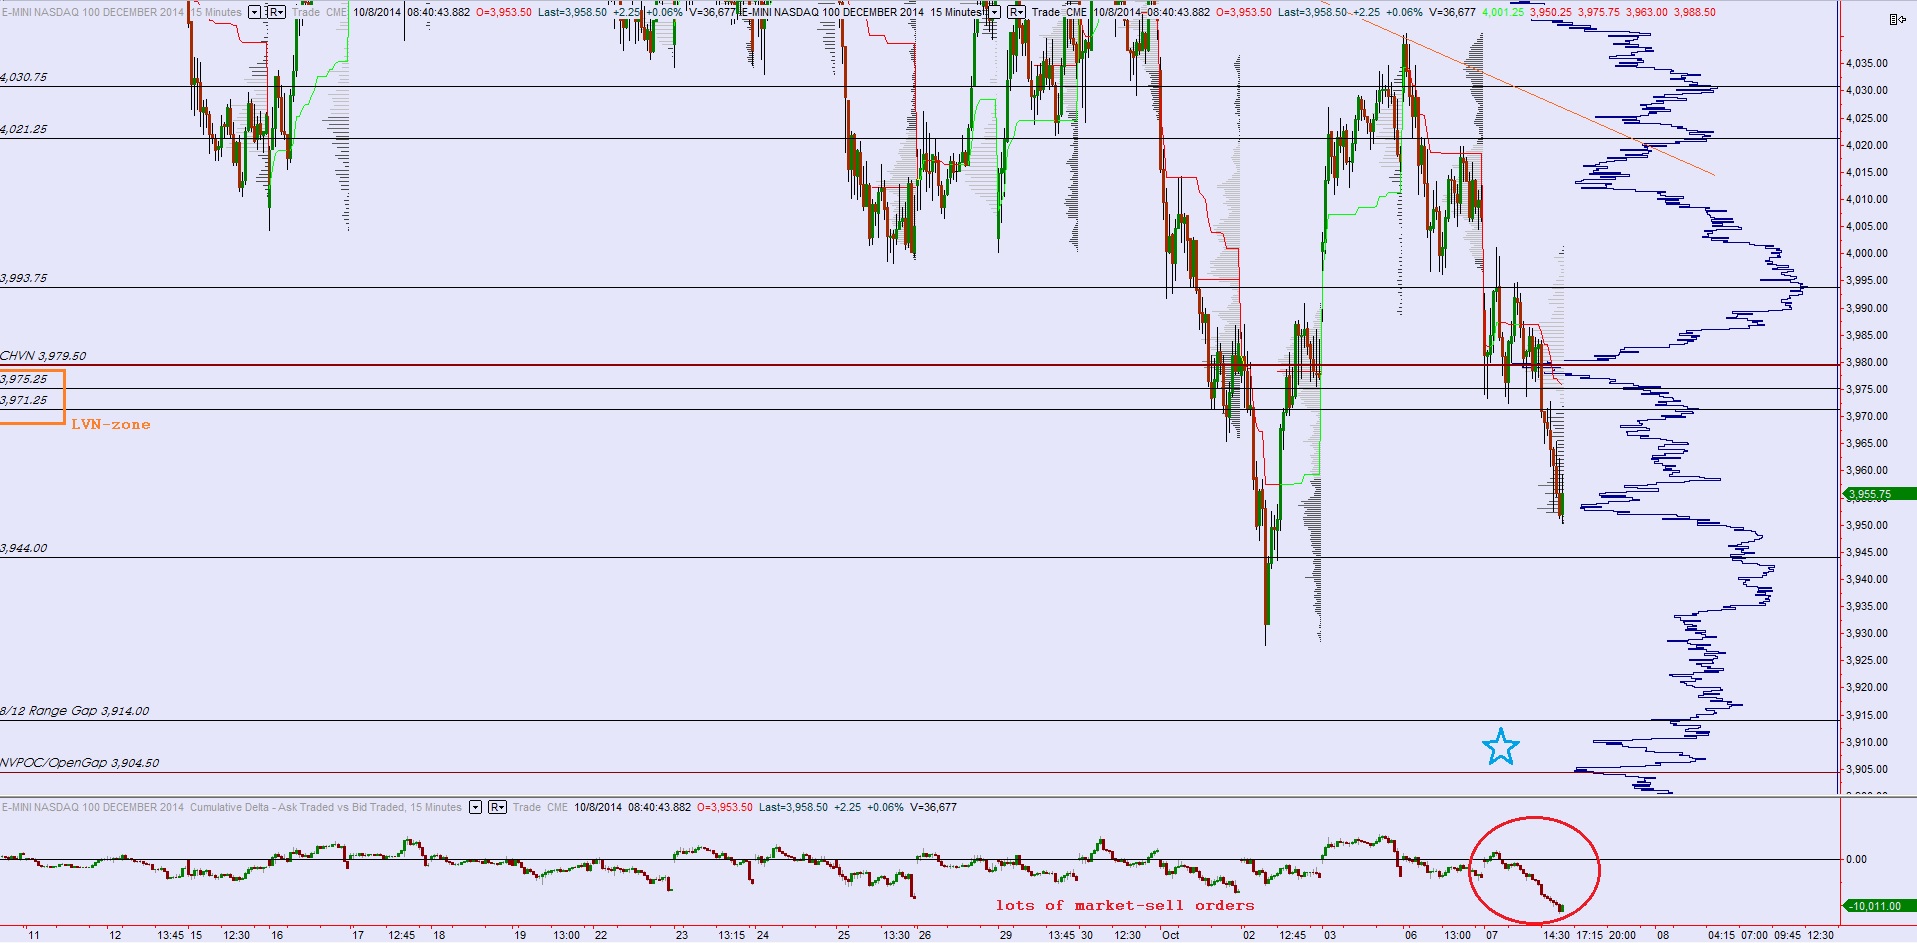
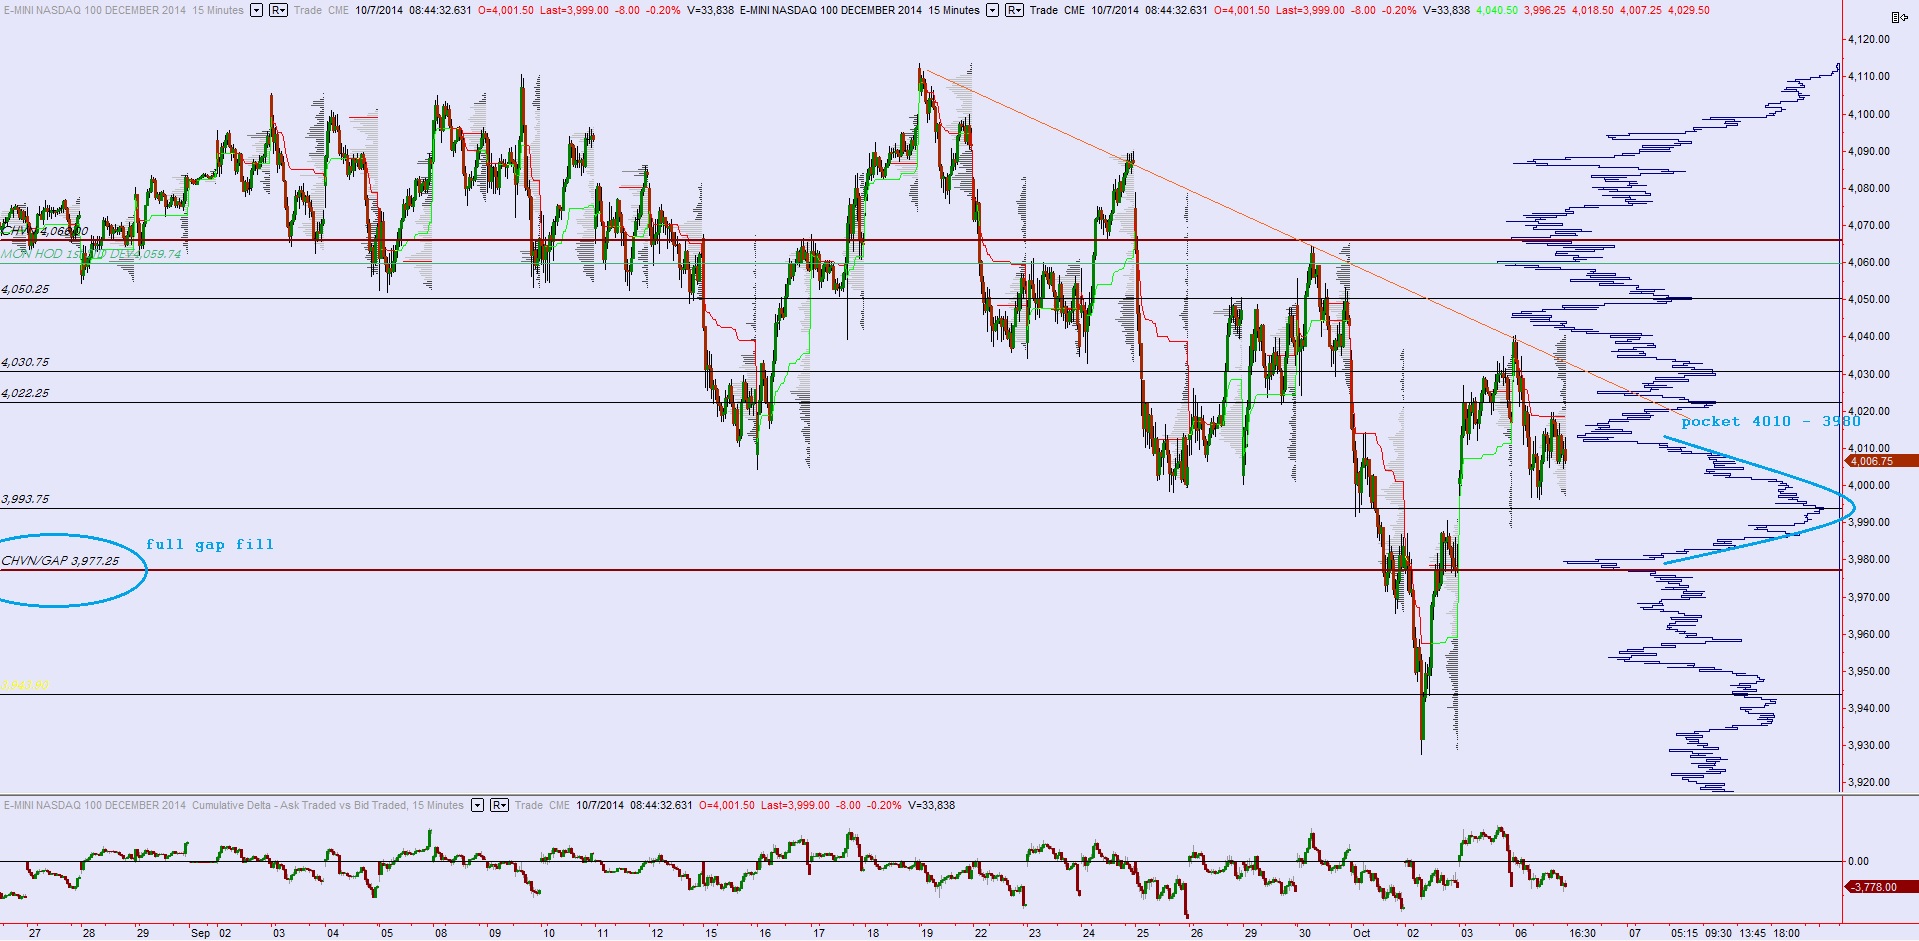
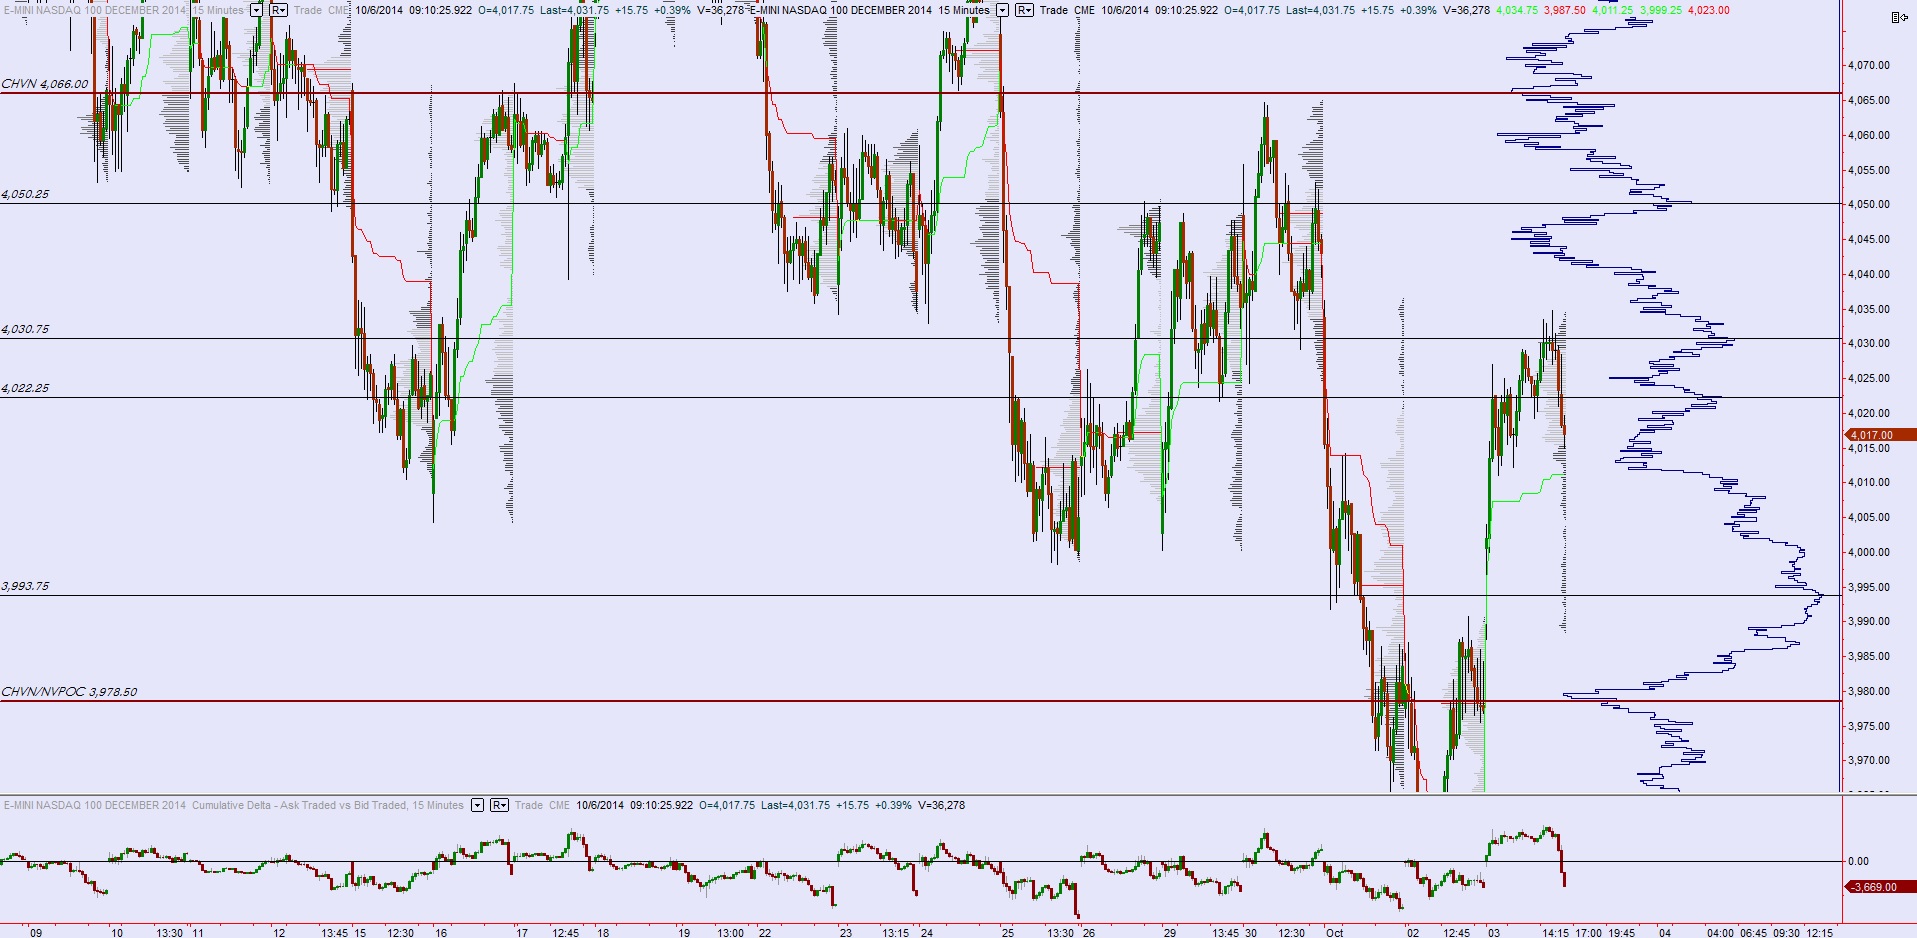
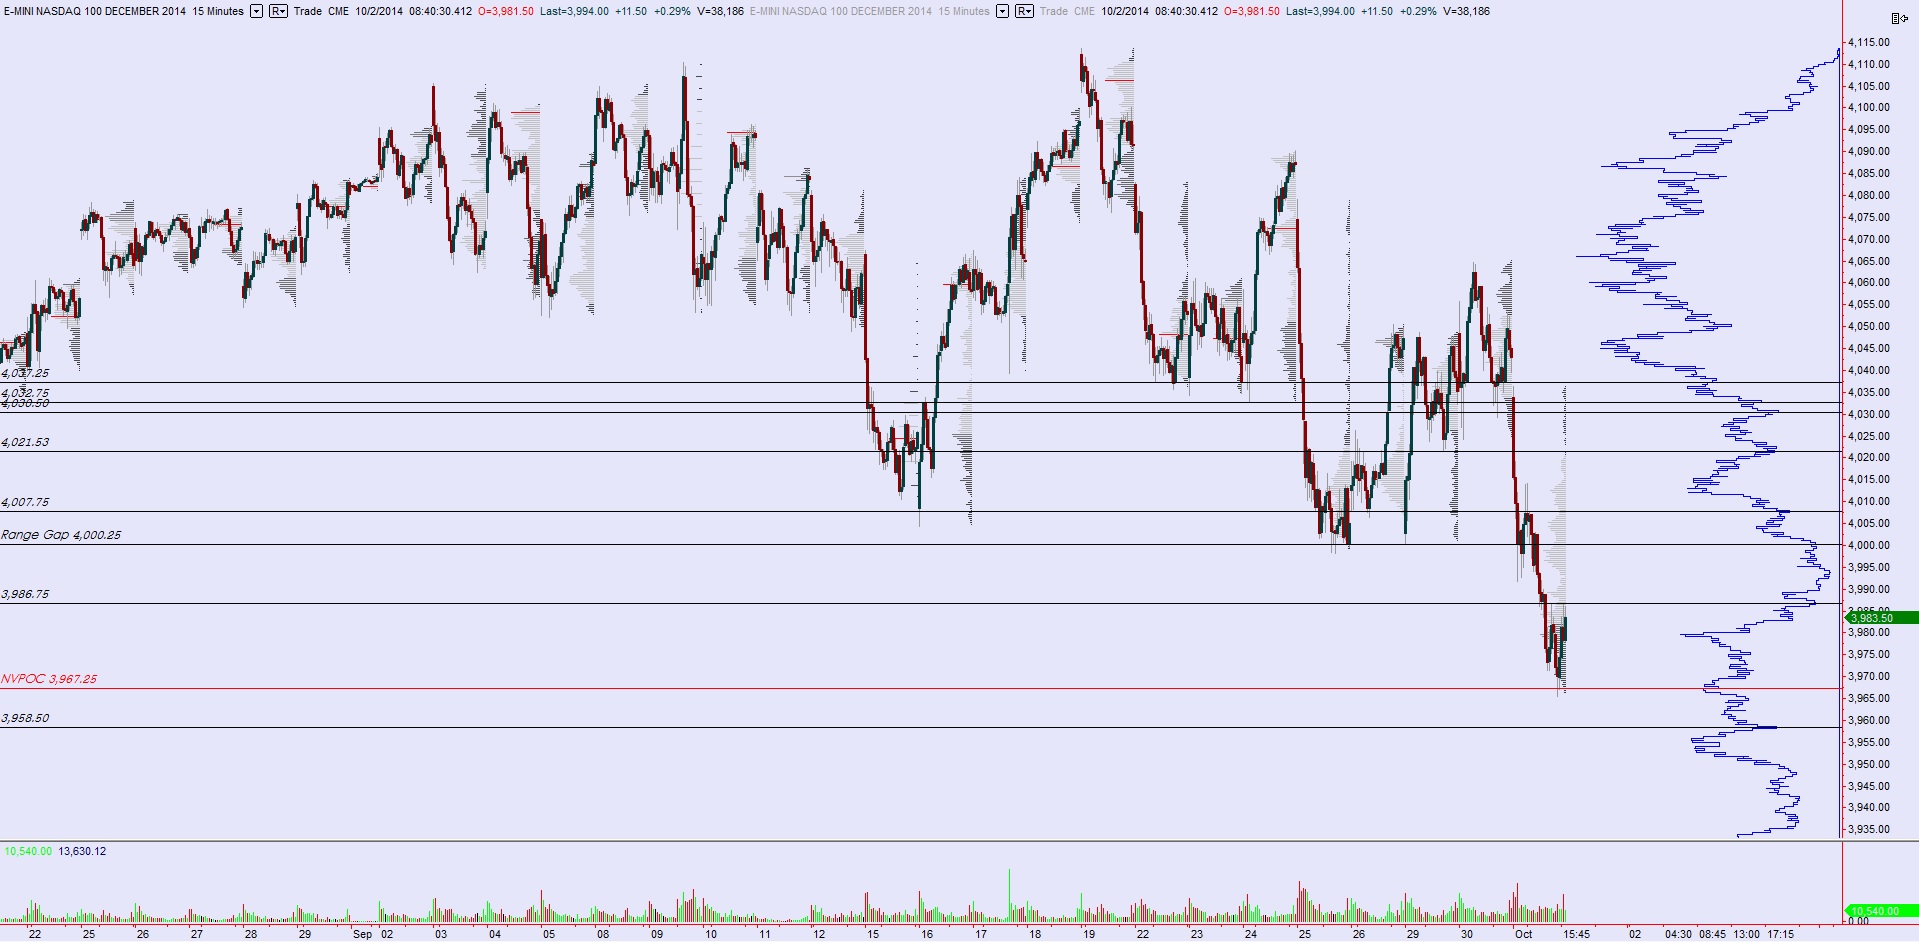
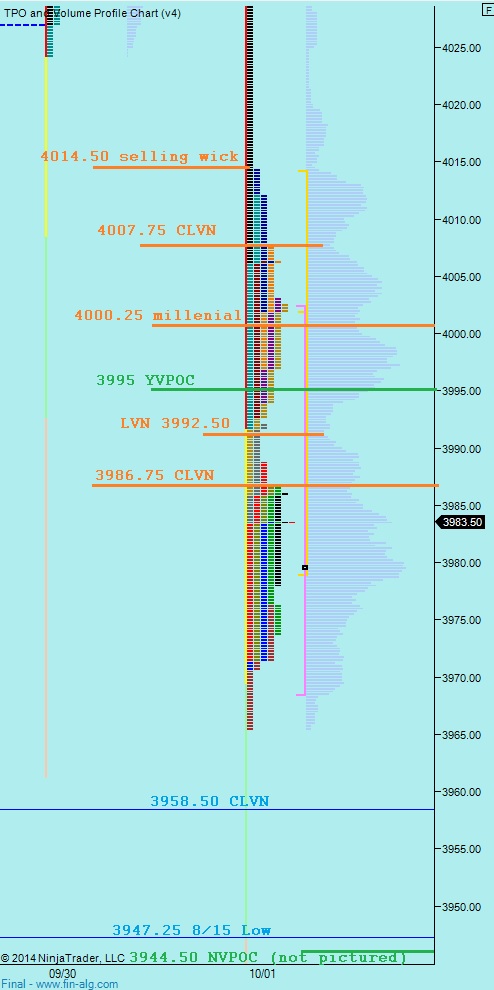
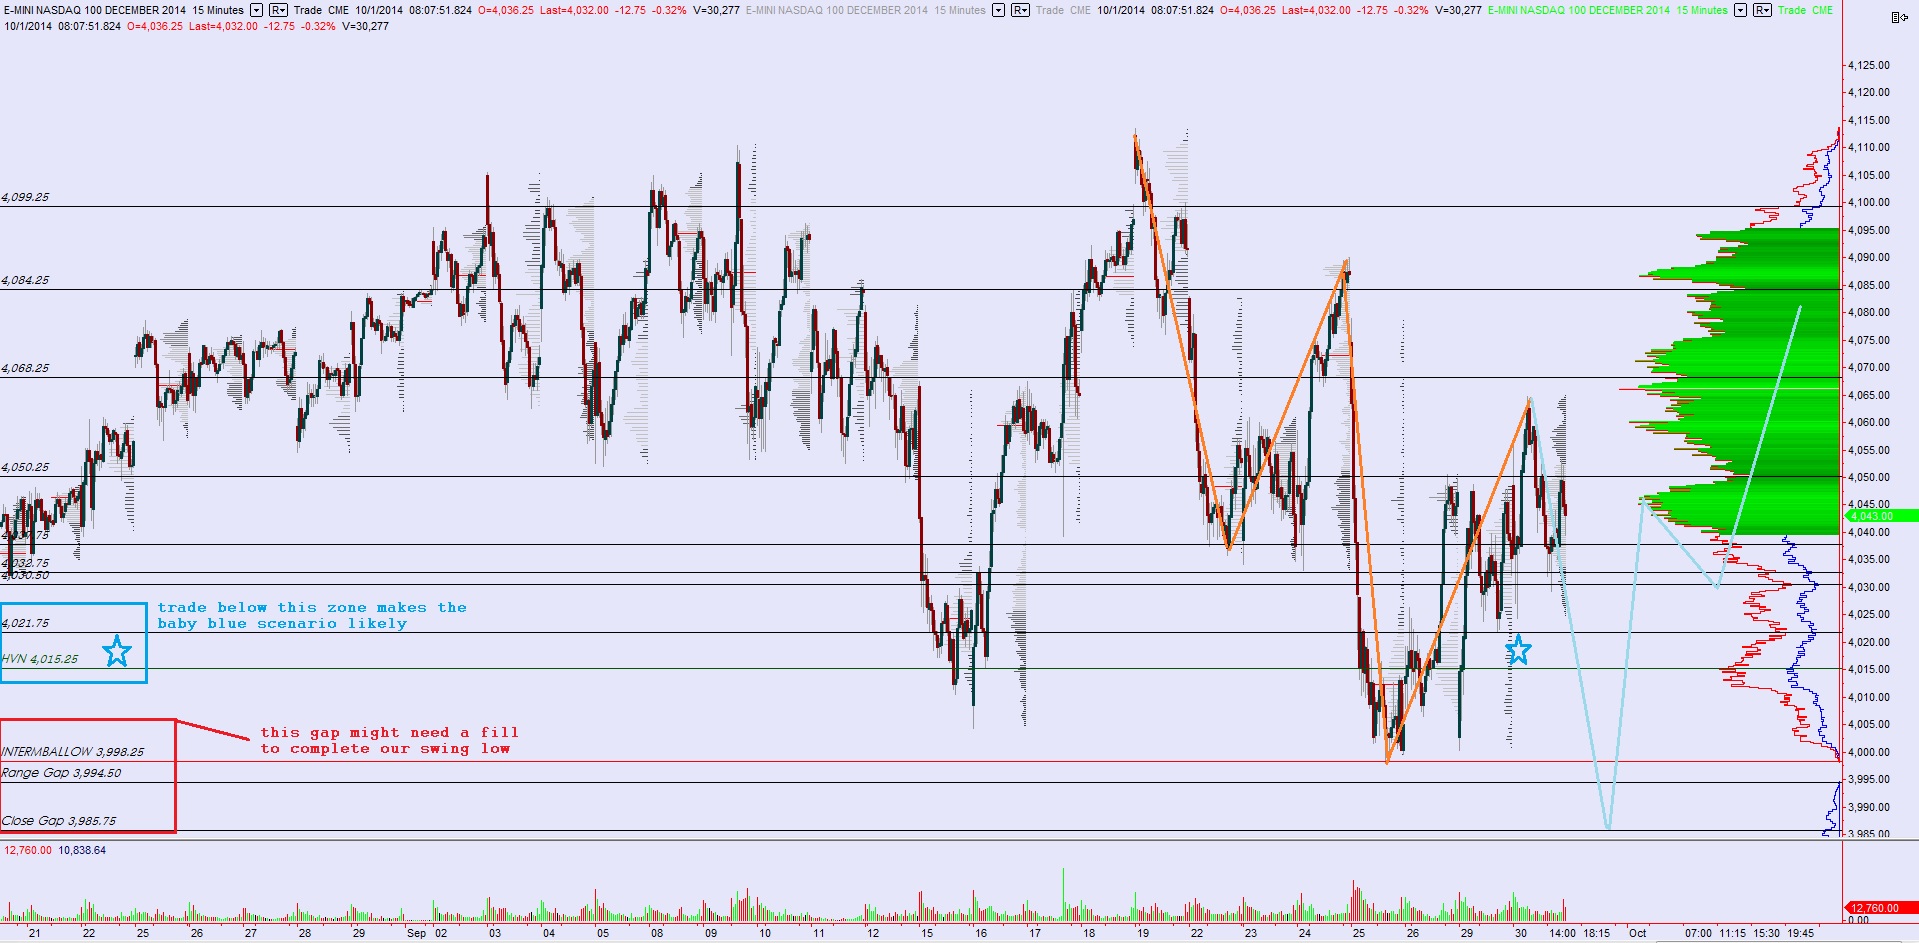
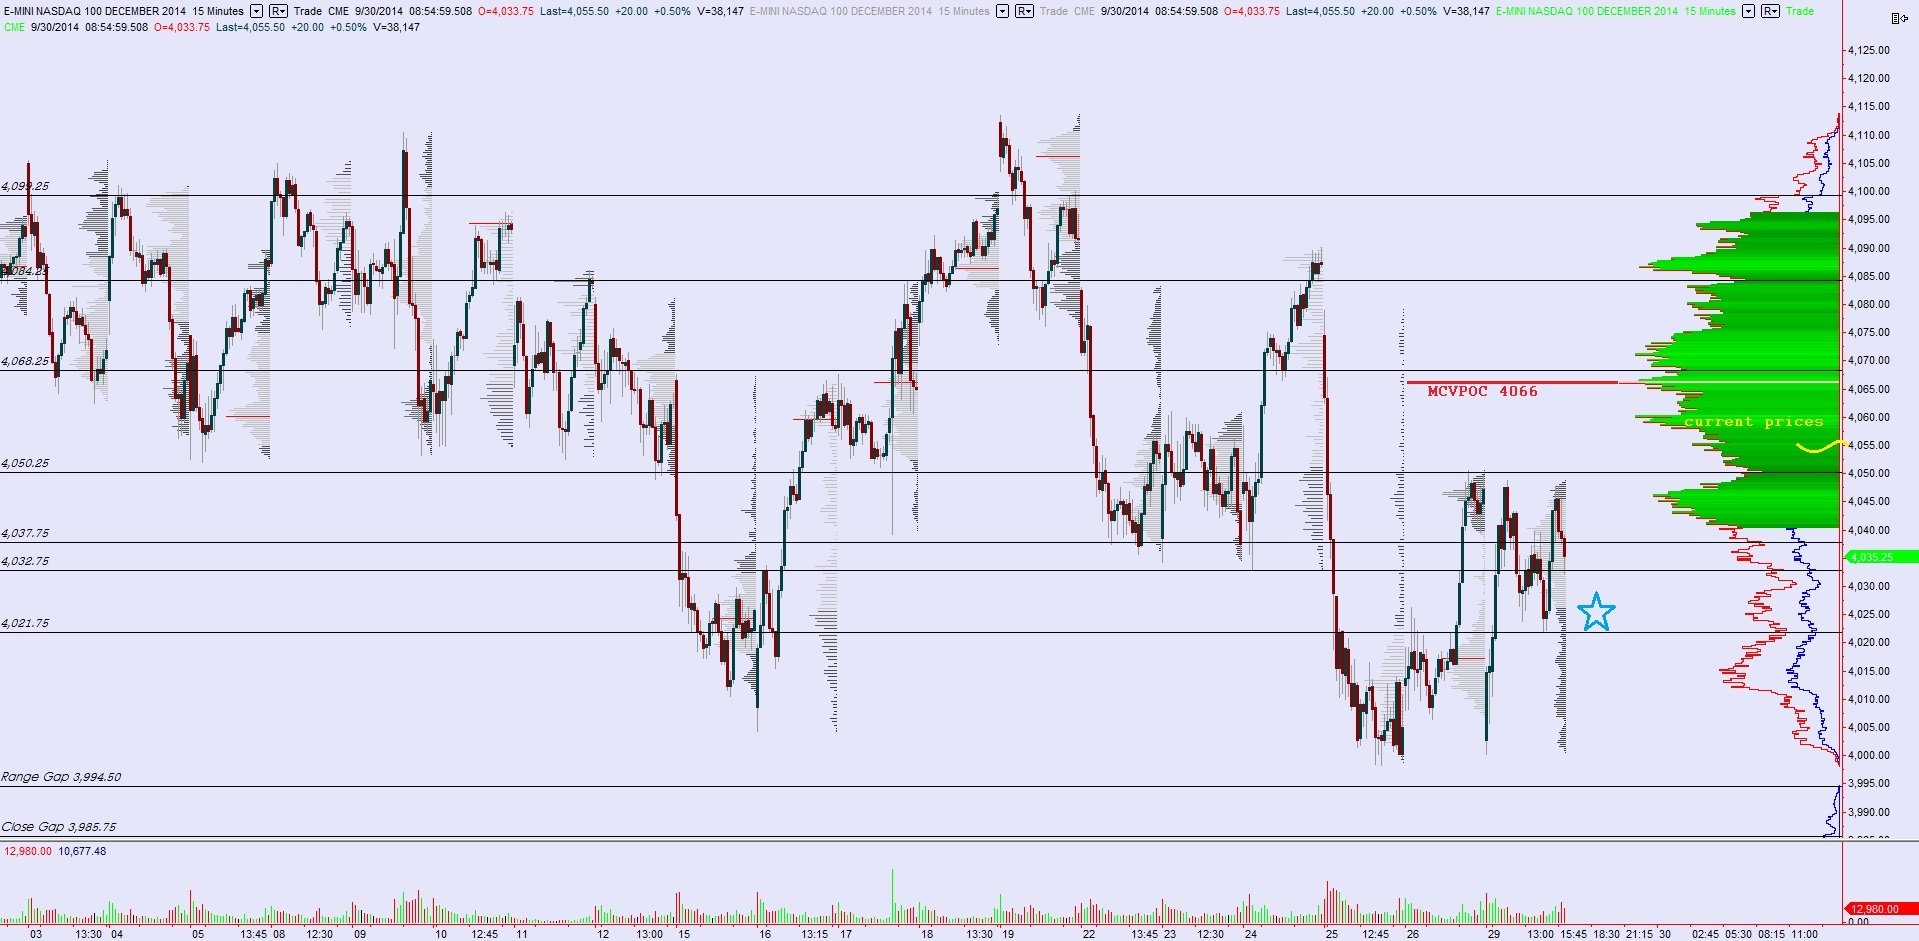
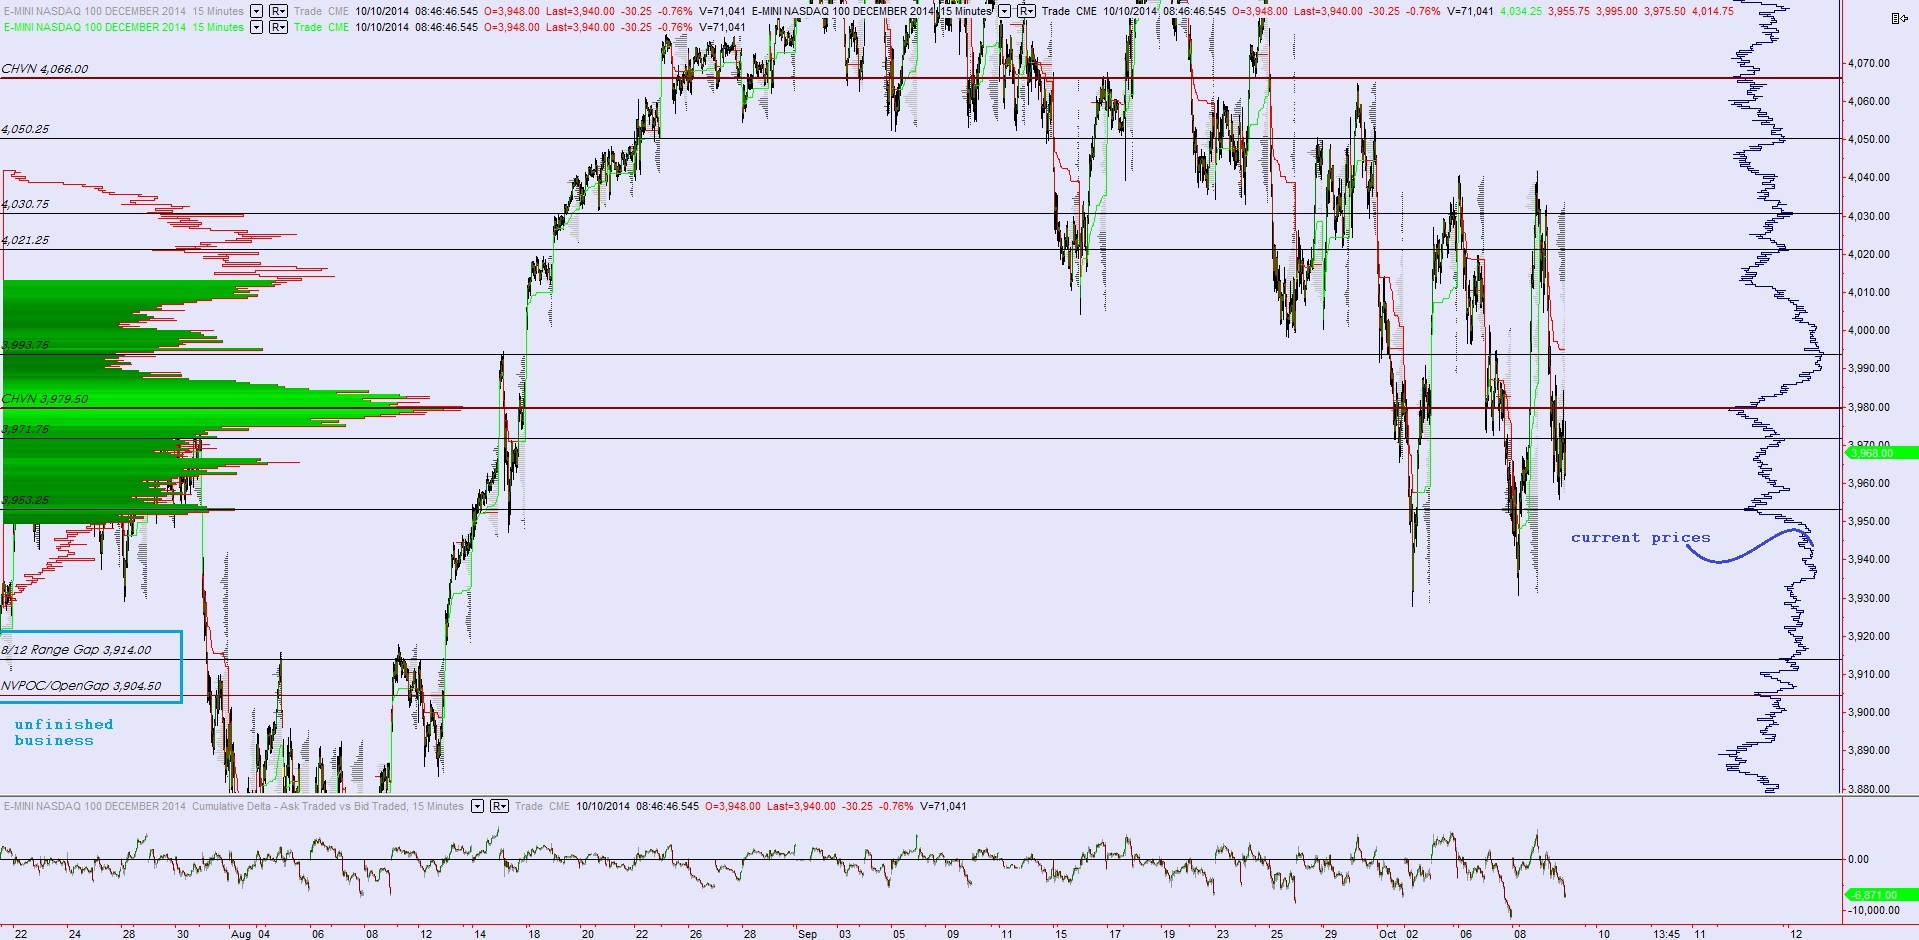
Turning to our state map, the intermediate term timeframe, we can see that the last time we traded down at these levels was back in early August and when we did, the region just below our current swing low was traversed rapidly. The initial surge out of August swing low left a gap behind. The gap-and-go was strong support when it happened. We had conviction in the long at the time because of it. Now we are back here, and the area becomes a candidate for retest. This does not mean it must happen, however we have an expectation it will and if instead the market cannot then we can see the other side, or buyers, emerging. I have highlighted this gap and other key price levels on the following volume profile chart:
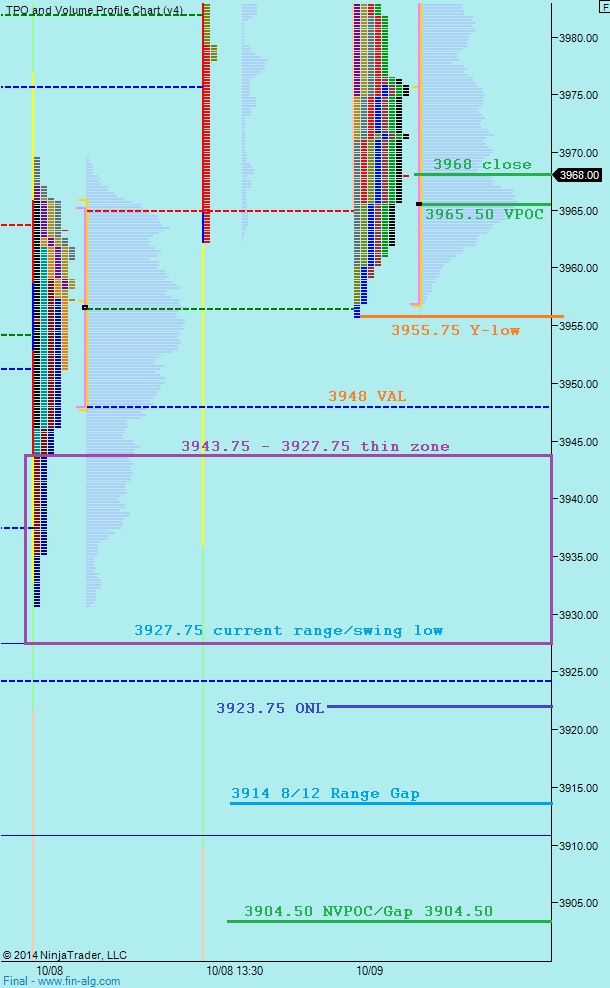
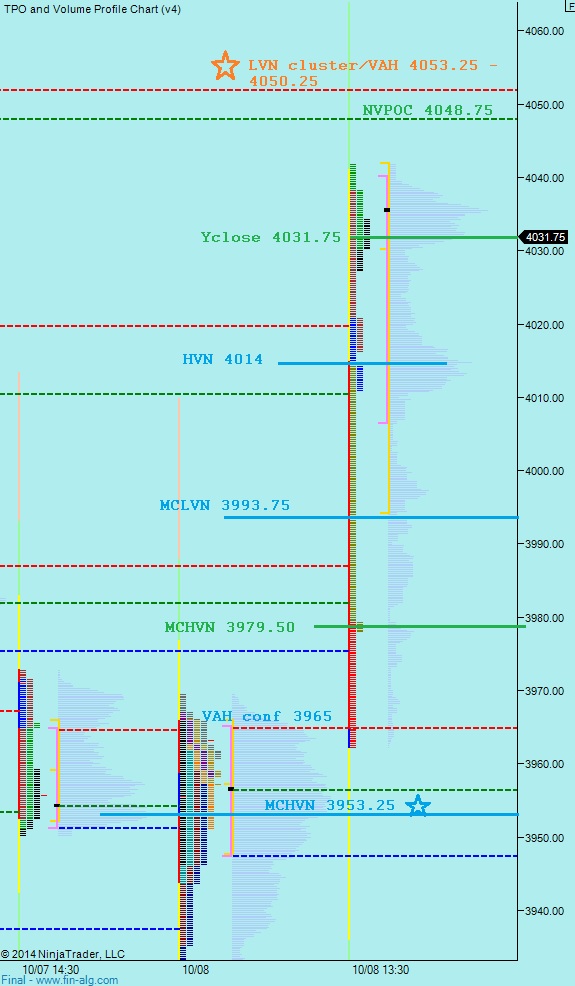
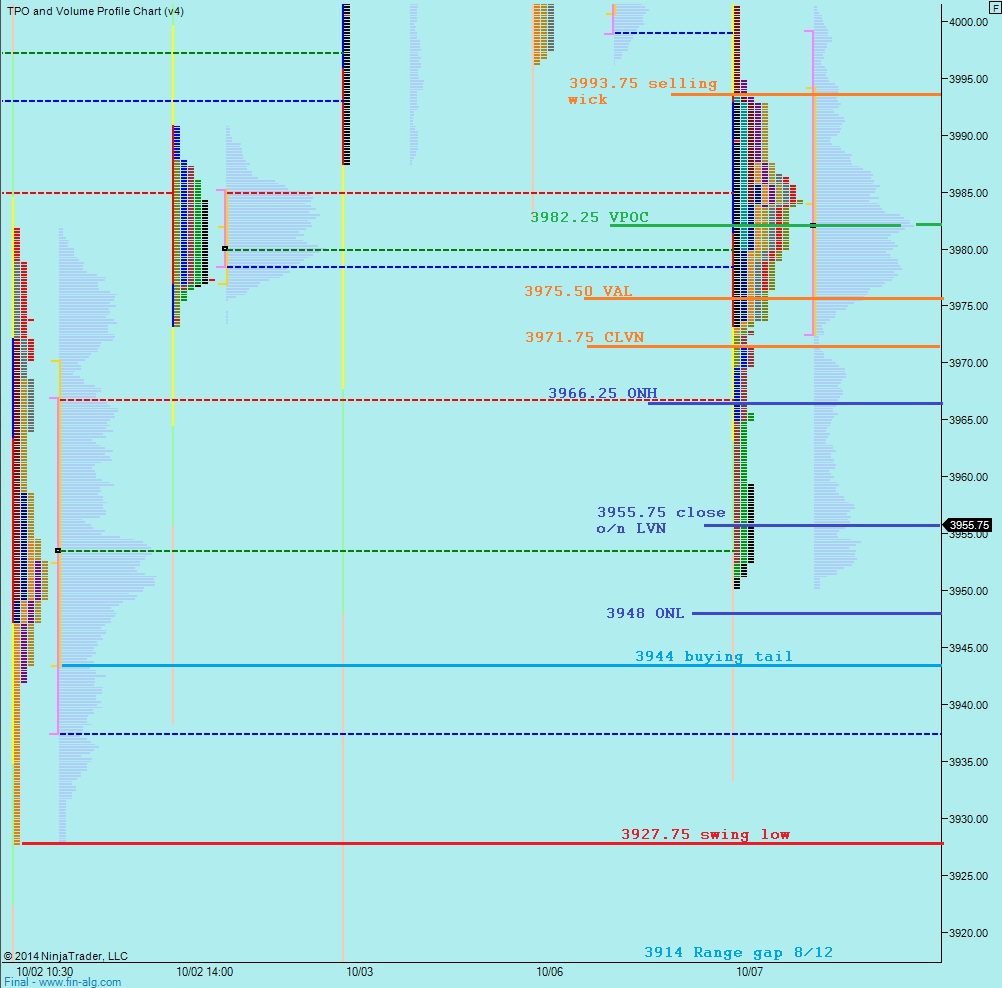
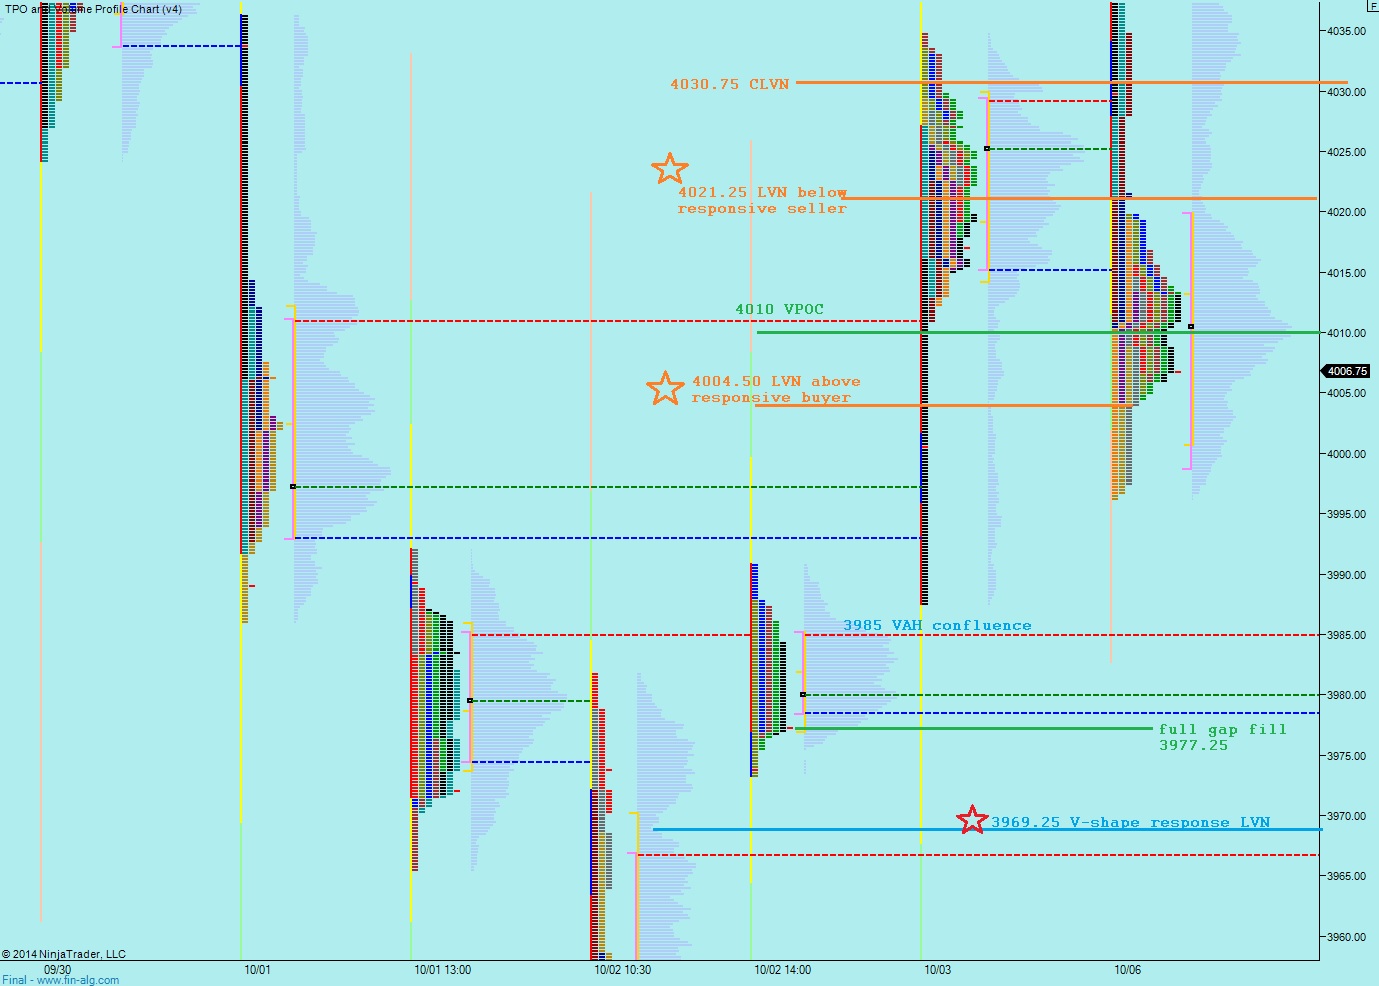
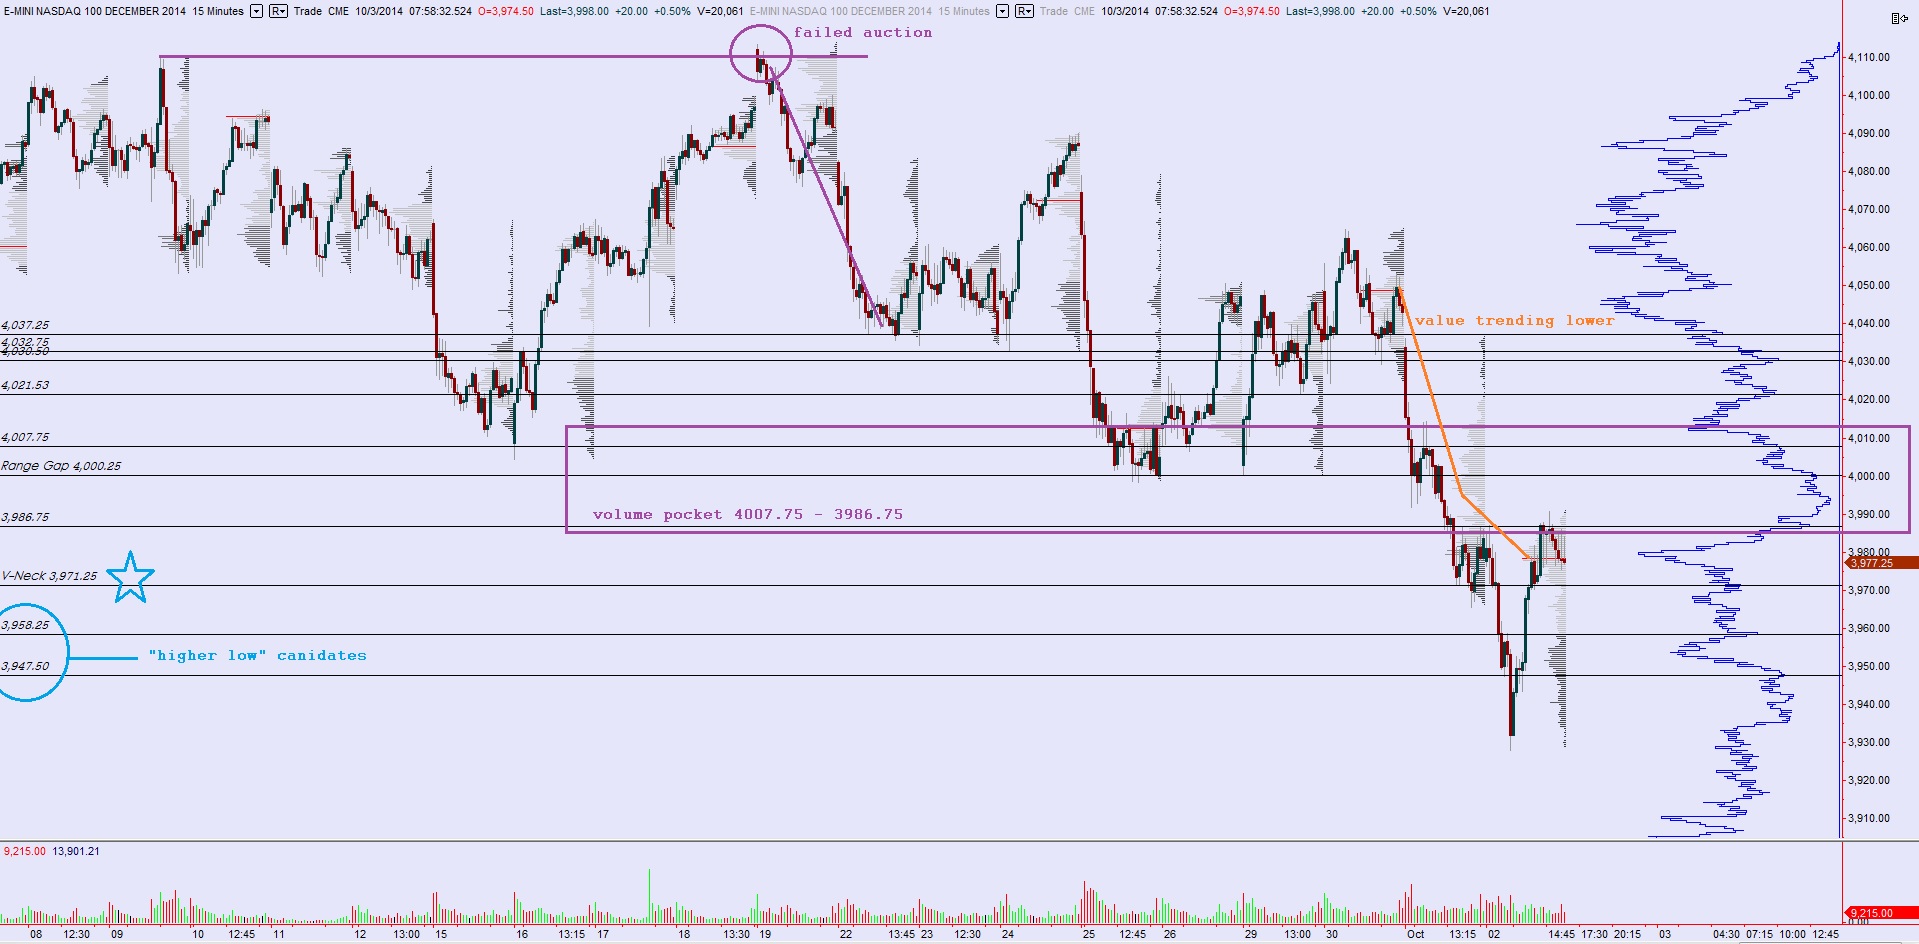
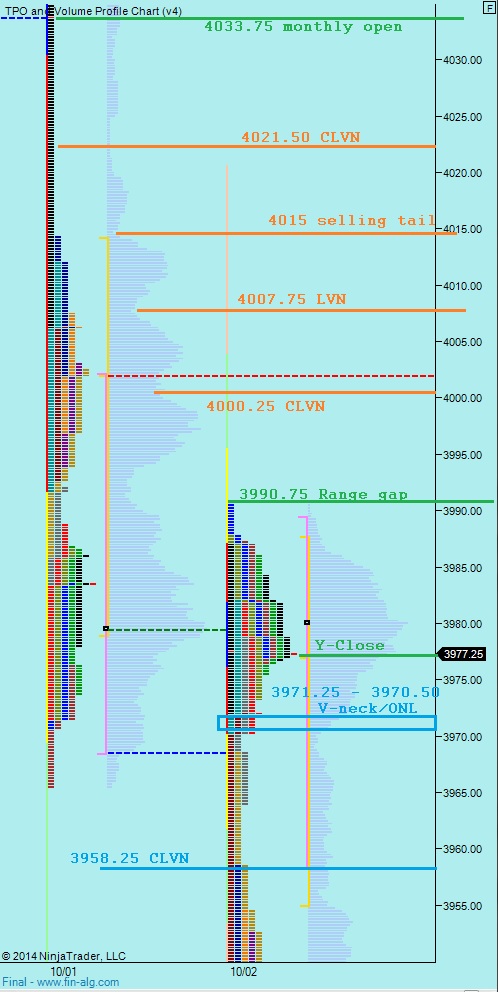
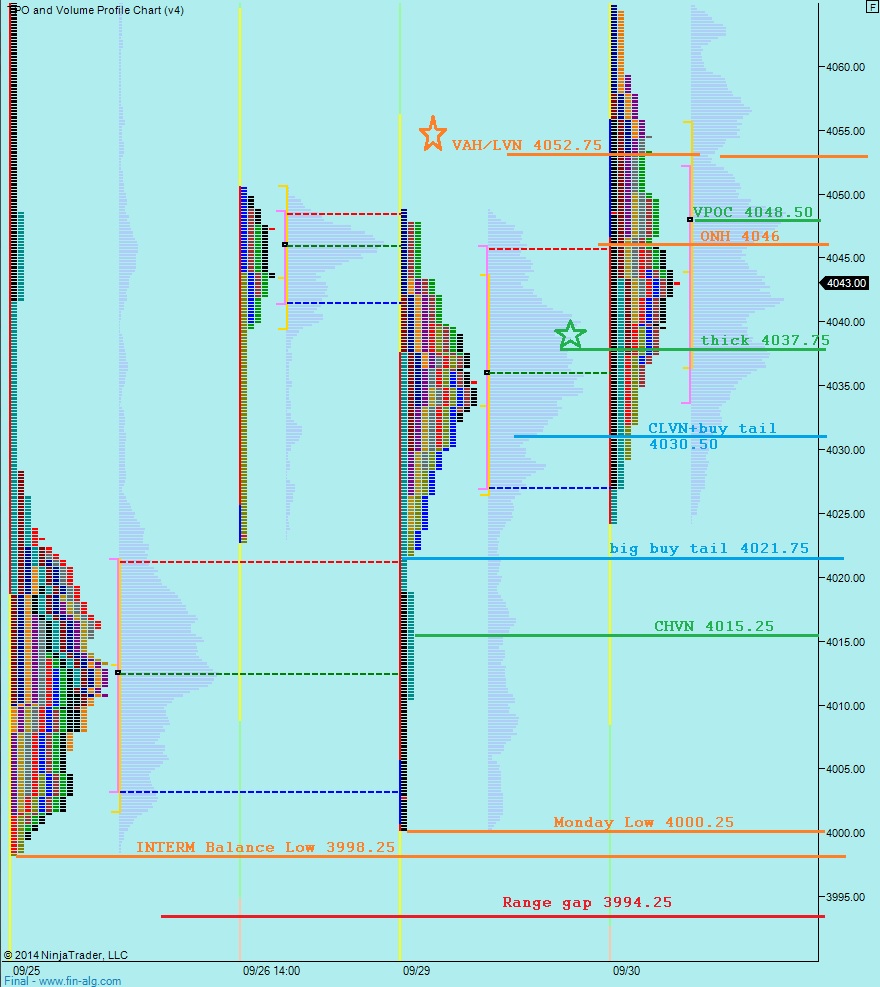
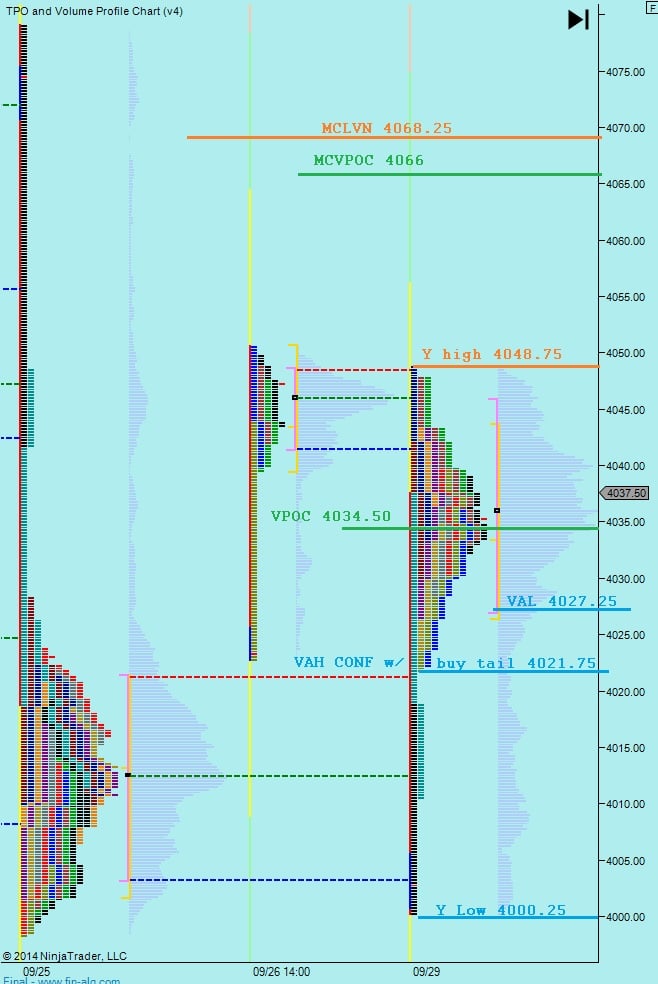
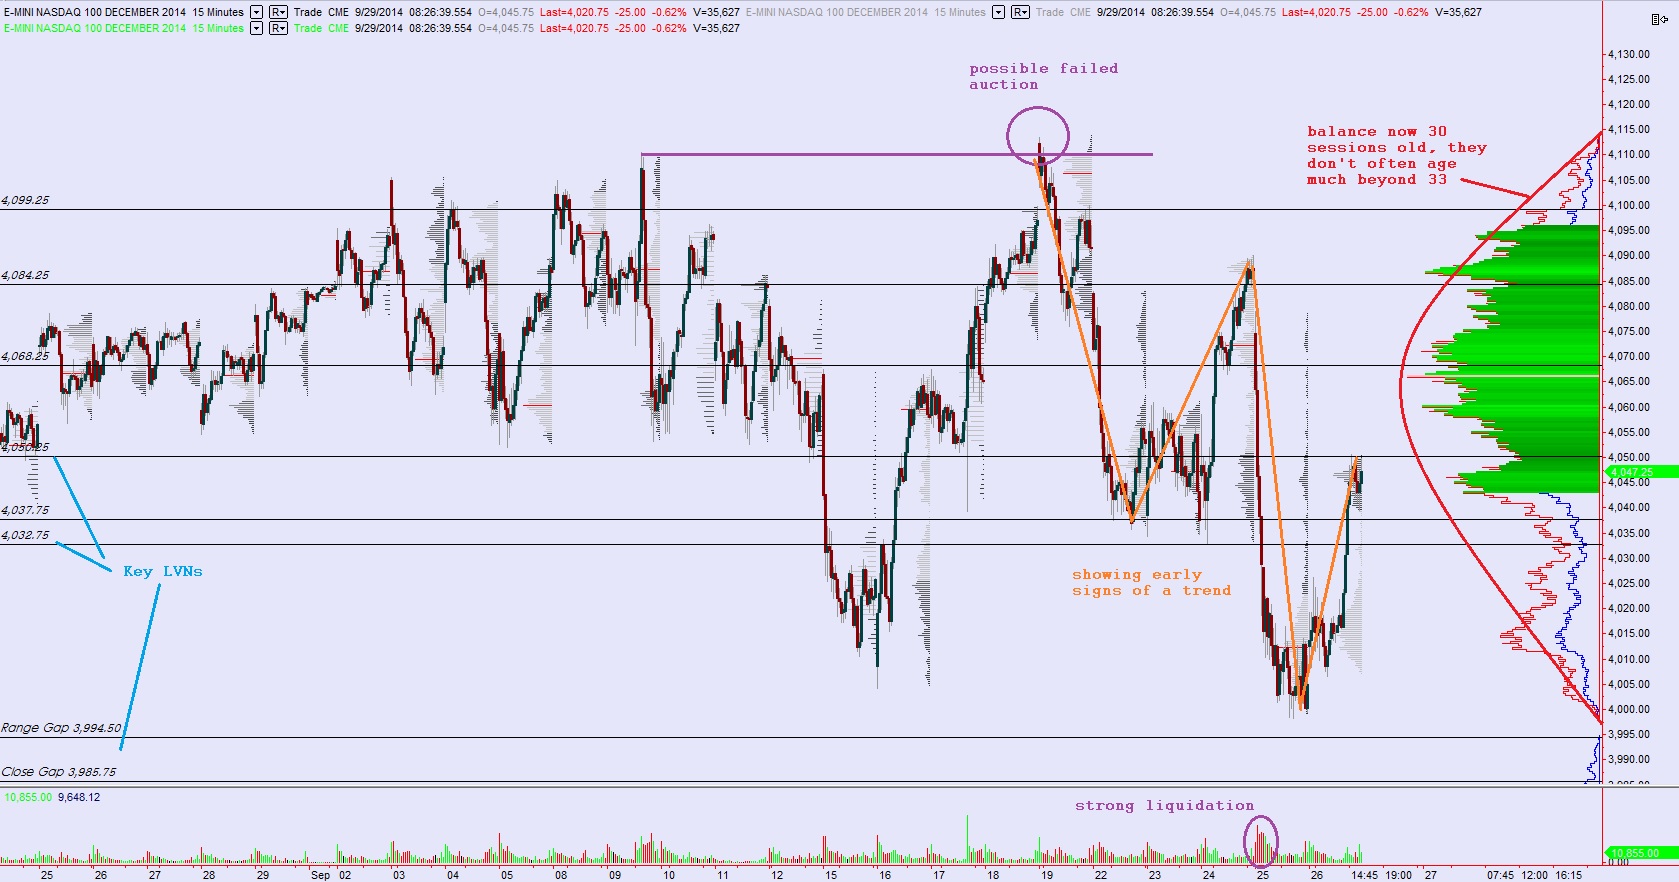
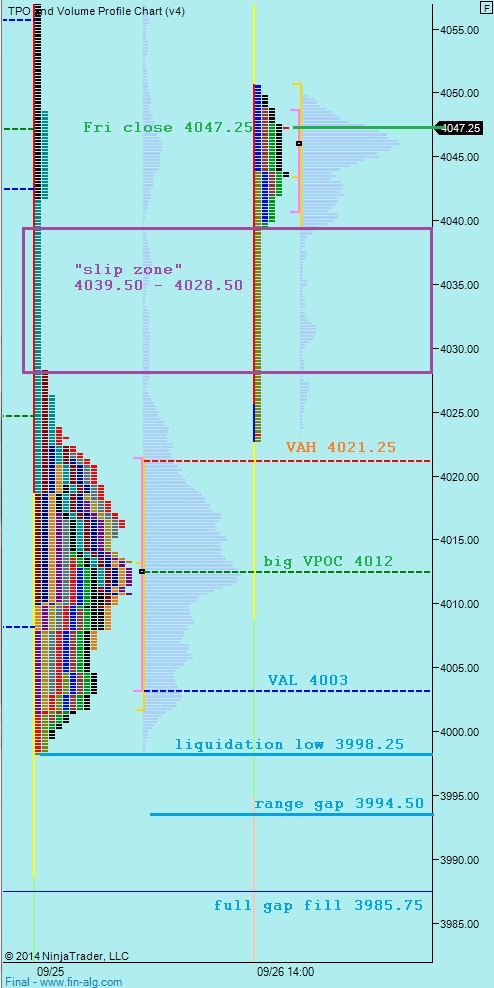
We are currently priced to gap below yesterday’s range. Any time the market opens outside of the prior day’s range we know prices are out of balance. For a moment yesterday we thought balance may be forming however this open suggests we are still discovering value. Pulling up the city map, I have highlighted the short term levels I will be observing on the following market profile chart: