Nasdaq futures started to drift lower overnight shortly after we heard data on German unemployment early this morning. The resulting range on the entire session is still within the 1st standard deviation of normal although volume picked up to levels we have not seen since the fast down markets of a few weeks ago. At 8:30am the US quarterly GDP stats were released along with jobless claims and personal consumption. GDP was better than expected in the third quarter and the other data were worse than expected and the net reaction was an aggressive responsive buy taking us nearly to the midpoint of the overnight session (4064).
The overnight session managed to press into Monday’s range before finding responsive buyers. It will be interesting to see in the cash trade hours whether a retest of this overnight low occurs and how it is treated. Since the gap higher Tuesday morning I have noted that we are provided with a unique opportunity to gauge demand. How the market trades relative to this gap, mainly if buyers sharply reject us from Monday’s clean balance, will be a clear clue of short term sentiment.
I present only the volume profile mashup chart today. Notice how well recent action has adhered to the price levels noted on the chart. This is a clue that the intermediate term and short term time frame participants are the primary drivers of market rotation. If instead we begin seeing large moves which ignore or steamroll these levels, then we know an even higher time frame is participating and it makes sense to step out of their way. I made no adjustments to these levels from yesterday, they are still key reference points as we go about trade:
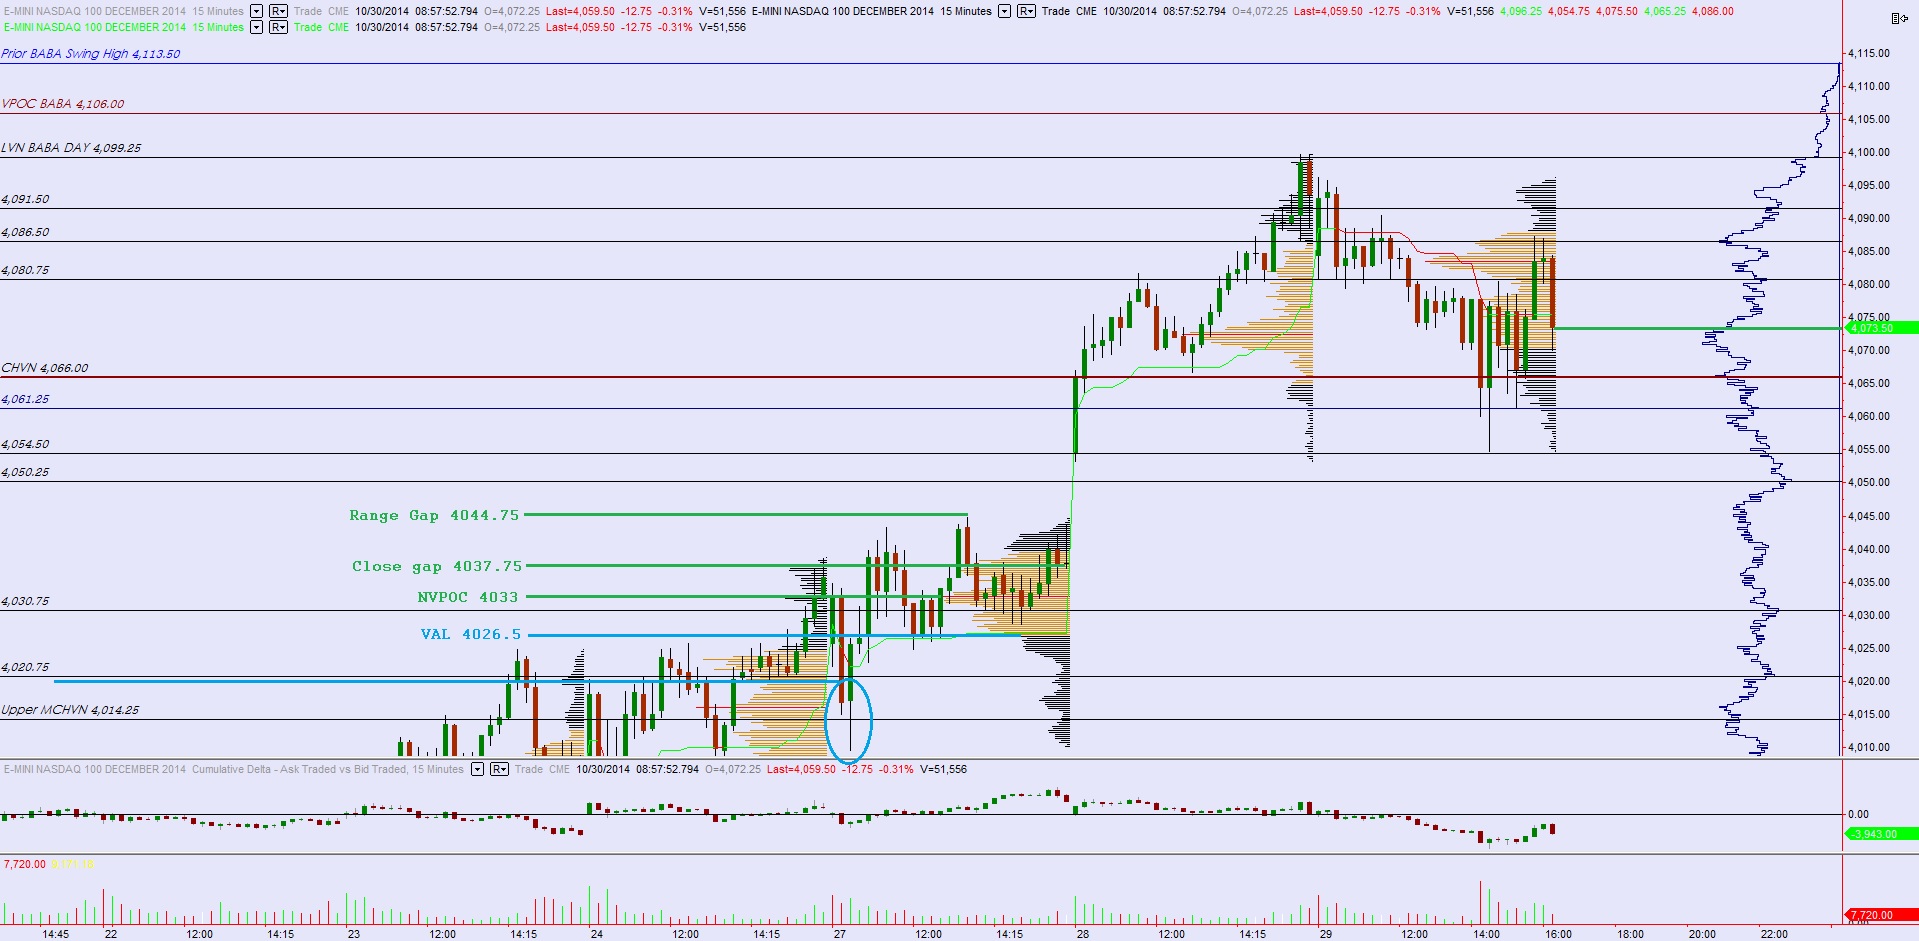


Primary Hypo – responsive buyers chip at overnight inventory and test through 4066 to 4069.25 and if no sign of sellers then continue higher to close overnight gap to 4073.50. Upside targets at 4080.75 then 4083.50 VPOC
Hypo 2 – buyers struggle to close overnight gap to 4073.50 and initiative sellers relative to yesterday press lower and take out overnight low 4043 to test Monday’s range out (see key levels in above chart)
Hey Raul.Is $NDX the same as the numbers you quote?
only on the weekly composite chart I post. $NDX (on most chart packages) is the actual index, like the SPX or DJIA, these do not actually trade.
What actually trades are the underlying futures contract, 95% of the time I am quoting the front month future contract for the NDX which, at the current time, is the December contract. It becomes a bit harry 4x/year around contract rollover (Mar/Jun/Sept/Dec)
So would the futures usually be a little higher than index? right now i show 4085.9. not a futures guy, but i do get contango etc.
The composite index value is about 480 points higher than where the front month future trades