It is quite difficult to call out futures day trades in real time in a product like the Nasdaq. Even on slow days the product is fast. It trades thin and slips around like it is running on marbles. These characteristics lend themselves well to order flow scalping, especially if you are not attempting to work too much size.
The trades are 80% preparation and 20% execution/management. All of the statistical studies allow probabilities to emerge intraday. The risk management rules allows trading to occur without the distraction of focusing on your money. The morning context reports define areas of opportunity and expectation. The opening swing gives us a sense of the dominant timeframe and how they are likely to behave.
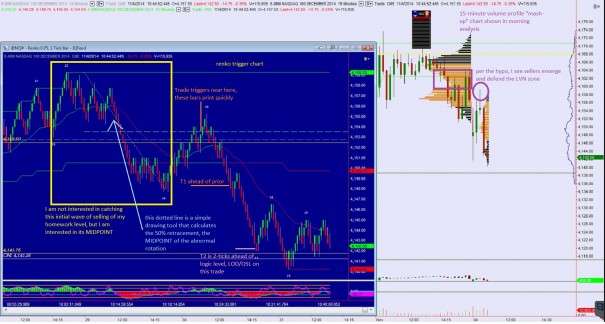
You cannot simply step in front of the market and place a limit entry at a price level from your homework. At least, I have found it unsuccessful. Instead I wait for a bit of information. Information is expensive in this business, but let me show you my favorite way to trigger on a level. This was the morning’s primary expectation/hypothesis:
“With the market set to open inside of Friday’s range my primary expectation is for buyer to attempt to test higher and close the overnight gap up to 4156.75 before finding responsive sellers who defend the LVN zone from 4161.25 – 4160.75.”
We never traded up to 4160.75 but there was still a simple way to manage an entry into the trade. In fact, it was the only futures trade I took today as I have been a bit hands off this week. I call it the mid trade. I do not need to call tops or bottoms to the tick to make a career in trading. The money is in the middle.
The market has a certain harmony to its movements. For instance, the most common rotation in Nasdaq futures is 4.25 points. Anything larger than 4.25 points draws my attention because it suggests actual activity, not just noise. It can be difficult to see rotation size on a time-based chart which is why my trigger chart prints renko bars.
Below is a picture one of my most common trade-types. It is a no frills way of assessing and trading the secondary wave after a rotation greater than 4.25 points. See below:
This post is not intended to make trading appear easy. I insist it is not, however it needs to be simple. The midpoint is simple to calculate, simple to run studies upon, and simple to identify and execute upon real time. I use it across many timeframes and asset classes. You should too.
Homework level, context, abnormal rotation supporting homework level, trade management. Eventually a third unit will be added to this trade and could have been a rider to take out the “weak low” I have been highlighting these last two mornings aka a hot little context piece.
If you enjoy the content at iBankCoin, please follow us on Twitter


just noticed the pic I used on this morning’s post, I had that little smirk on my face this morning when the market was right in my wheelhouse