This morning’s 30 minute TPOs are yet to make any progress to the downside. No new lows in the TPOs not only rhymes but it suggests buyers are not reacting to fire sale discounts but instead pushing their initiative by buying into higher prices:
Comments »In The Dip Zone
We’re starting the week in my favorite area to do business, the dip zone. More specifically, we’re above my favorite EMAs after making a new swing high.
I’m looking to buy strength today, should the market remain constructive. As of 8am, the S&P futures are priced to open slightly higher, near Friday’s value area high. Critical support for a constructive session is the confluence of interesting profile action at Friday’s lows. We don’t want to see trade sustained below these levels as longs because it’s likely to preclude another flush lower.
Overhead resistance at Thursday’s volume price of control at 1414.25 and above there it could be a quick ride to last Wednesday’s lows which share confluence with Thursday’s value area high. I expect we could see sellers at that level too. E-mini S&P profile below:
Also, the light sweet contract continues to be on slippery footing, after gapping higher on its Sunday evening open it has been smacked lower. The session has stabilized since the USA started coming online, but be on the watch for continued weakness which could bode well for Rhino’s refinery thesis and the airliners:
Comments »TPO Verses P&F Charts
After casting his vote for me, one of my favorite all time reads and radio/television sensation Scott Bleier told me to cut out the point and figure crap. This was in reference to the TPO and volume profile charts I have been posting for the S&P futures. Seeing as Scott is arguably one of the most seasoned pros on this site, it’s easy to assume a few others are unfamiliar with TPO charts and how they can be interpreted to glean understanding of a contract’s price action.
First let me very quickly cover the P&F chart. If you desire more background on the charting method, I’ve linked to two detailed sources at the end of this post.
P&F differentiates from most chart styles by not plotting price against time. Instead it uses Xs and Os to delineate upward and downward movement respectively. One goal is spotting breakouts and breakdowns. Below I’ve marked up the SPY chart. Notice all of 2012 is contained within five strands of Xs and Os. Writing about this chart every morning would be grounds for banishment, no doubt:
TPO charts, and more importantly the volume profile, give us much more actionable data. TPO stand for time price opportunity and each letter (usually) represents 30 minutes of trading. As the session progresses, the TPOs build up and take shape. Remember bell curves? They show up all the time in a balanced market. My write ups cover the e-mini S&P future contract. It’s the most traded financial instrument in the world and is derived from the price of the S&P 500 index.
The more time we spend trading at a specific level, the more TPOs build up, and it tells us the market has “accepted” a price as reasonable and buyers and sellers both find the price as reasonable, balanced. Balance is good, but imbalance and price discovery are where the opportunity to bank coin reside. Last Thursday was an example of price discovery which led to the gap fill. You can see the before and after in my posts here and here.
As volume data became more raw, more pure, we began plotting the volume at price to build similar imagery as the TPOs had in the past. Most current users of this type of charting consider tracking the volume to be more relevant and actionable. I agree. If we know where the most volume has traded, we can watch that level and see how the market reacts when we reach it. If we blow through the level, something has changed and the participants no longer agree the price is fair.
I could continue on, but let’s instead look at Friday’s auction and what it tells us. First, I very clearly see from the tight range that there wasn’t much action on Friday and the market found balance. The purple box I plot is the range where 70% of the transactions occurred for the day, using volume at price. It’s called the value area and people make a living trading around these levels alone. We closed right near the middle of the value area, but not before the bears attempted an afternoon push lower. Buyers showed up and price quickly returned to the midpoint. Overall Friday was a balanced day of market stabilization:
In my next post I’ll cover price areas of interest going into Monday’s trade. Levels where we could expect the market to pause or explore.
PnF Links:
http://stockcharts.com/school/doku.php?id=chart_school:chart_analysis:pnf_charts
http://en.wikipedia.org/wiki/Point_and_figure_chart
Comments »Rolling On
How apropos my dear readers that the day of my interim trial blogger status we roll into the March contract. The contract will exist as long as my trial-by-fire period. Let us hope both appreciate in value, although the contract’s road is much more rocky and unsure.
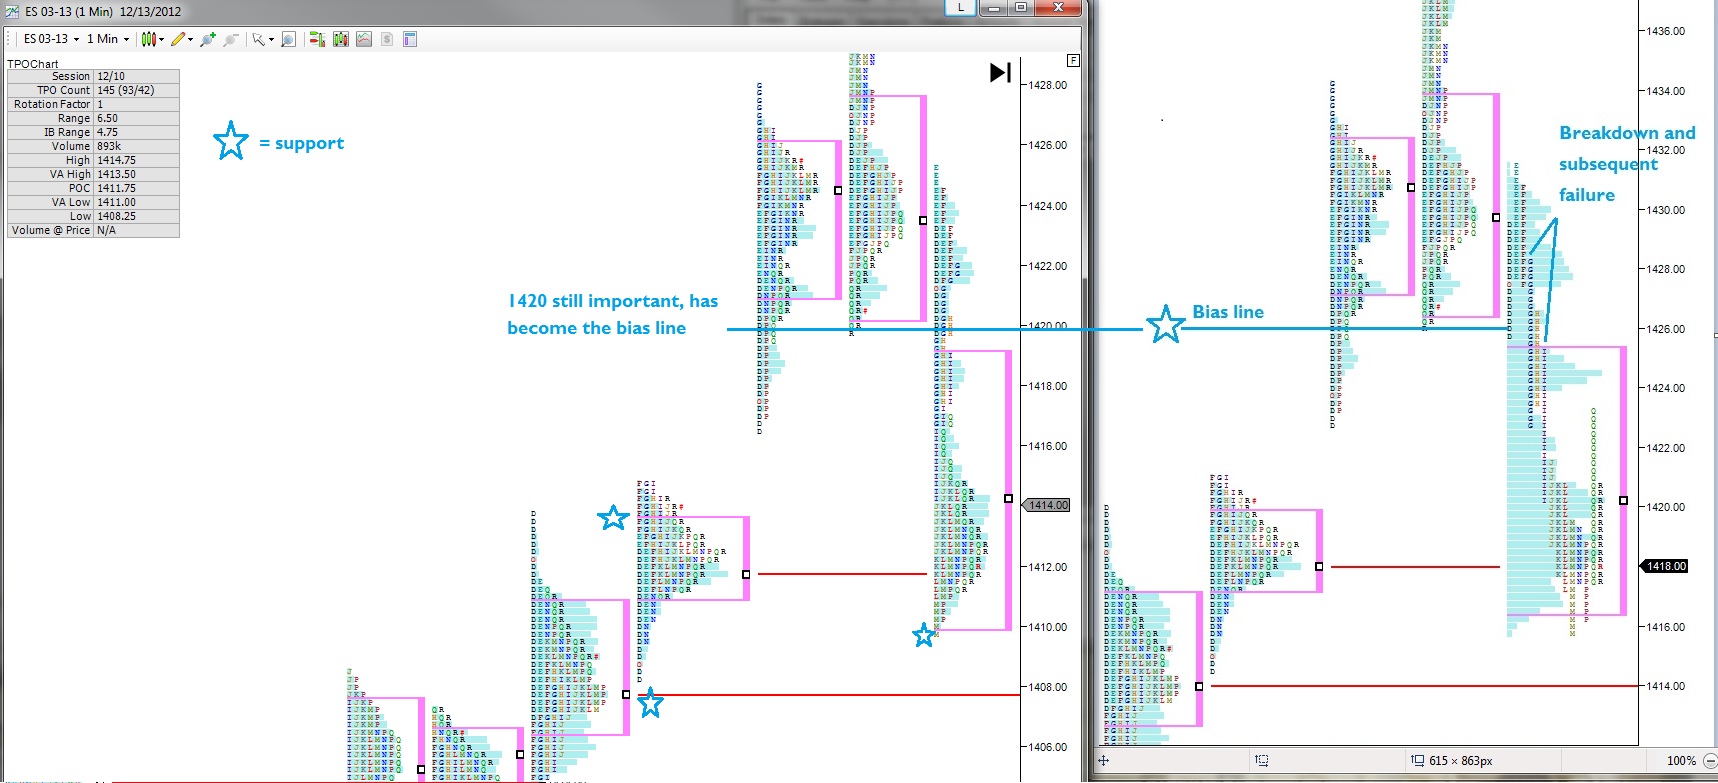
Going forward all price levels quoted will be from the March contract. First and foremost the infamous 1420 level—its 1414 now. That’s an important level to keep in mind today as trade sustained below that level could result in a short trip to 1407.75 the untested (or naked) volume price of control from last Friday. I’ve placed the two contracts side-by-side below to give your eye an understanding of the levels. March-13 is on your left:
Comments »I Drew The Line Here
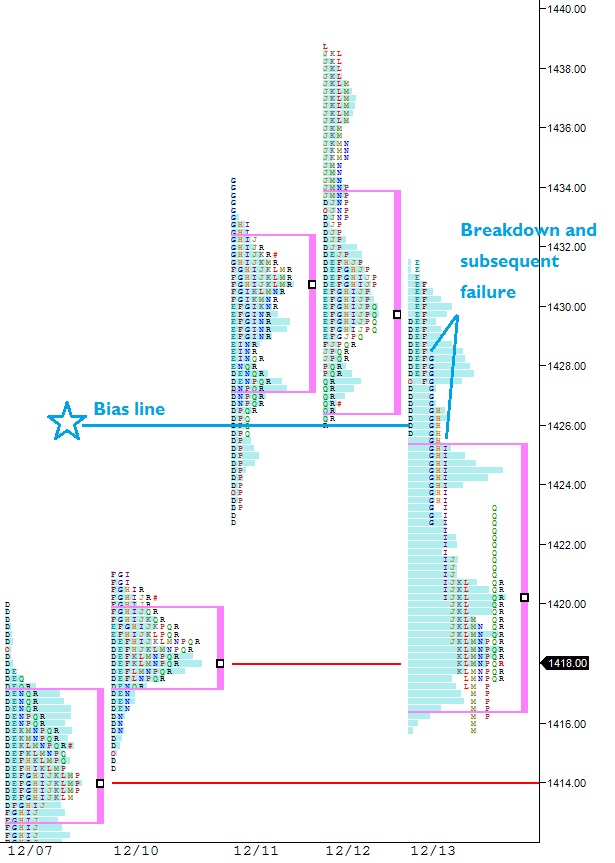
This morning I highlighted my bias line and suggested you cut your weakling positions early. Yesterday demonstrated indecision and the gap below offered a tantalizing target for shorts. Heading into lunch the market began selling off and the market cut through the bias line. It’s understandable if you didn’t cut weak names at that point, but when the market failed to reclaim the price it was my sign to clear out weak names:
The action in the S&P was still constructive for the bulls and we found support in the afternoon and reclaimed the important 1420 level. It wouldn’t surprise me to see bulls testing the sellers’ conviction into the weekend by pressing longs into the weekend.
These elections are too close to watch—I have much respect for all the candidates and their hard work up unto this point, but MAN do I want to win. VOTE FOR RAUL3! 150th blog post HEY-O!
Comments »Have Fun With It
Futures are set to gap higher again this morning, and value has gone exploring higher. Last night I was tired and expressing my disdain for the barrel of monkeys my portfolio has become. Today I love said monkeys and wish to harbor them into the day.
One of the biggest mistakes swing traders make is over thinking a trend and bailing on it too soon only to look back mouth agape at the profits they left on the table. I didn’t do that with The March of The Chickens (PPC) and it made my year. Now I intend to do the same for any degenerate position who wants to continue to run.
The market is going to have to really force me out, either by definitively breaking the 9EMA or by closing below it. Otherwise, we’re going on a gorilla raid of the shorts.
TAKING TO THE PROFILE…I’m so glad people enjoy this. As you can see, the S&P 500 has gone exploring for sellers, and price will continue higher until a stronger force of selling is met, because most short term resistance has been cleared. We want to see buyers hold their ground at yesterday’s high first and foremost, but that could be wishful thinking an excessively bullish. Next level is 1432.25 value area high, if this areas breached we have to be on the lookout for a rotation down to the point of control (highest volume traded at price yesterday) at 1430.75 then things get slippery down to 1427. It would be clear the sellers have stepped in hard if they can sustain trade below 1427 and could be your cue to raise cash if you’re very long.
Otherwise, if we continue higher have some fun, pop into RaginCajun’s bomb and squeeze screens and find something that fits you for inflicting pain on short sellers. These are simple market times, simple but never easy. Stay nimble because we have The Fed speaking today too.
Comments »Santa Weather Forecast – 70% Chance for Blue Skies
As of 8am, ES Futures are priced to gap above last week’s high at 1423. The question now is whether bulls will step in and make a big thrust higher, or if we’ll see another tepid afternoon of mixed trade. One item of note from the profile that I’ve continued to emphasize in this tight price range is the ability of the auction to take value higher every day since the slap the p fade that occurred on the first trading day of December.
Essentially, anyone who bought the hype going into December is now whole, and beyond that has watched value creep higher each successive day. Value looks ready to go exploring higher. There are too many buyers at these levels. At least that is my interpretation of the current value shift.
When I refer to value “shifting” I’m referring to volume at price. The price that trades at the highest volume is the most accepted price traded in any given day. The value area represents ~ 70% of the trading volume. Note its march higher:
Watch for bears to capture 1418 then yesterday’s low which closely corresponds last Friday’s volume point of control at 1414. Caution if either level is recaptured. Otherwise, blue skis for Santa’s sleigh.
Aside: I’m building my next multi-quarter thesis. I’ll give you a hint: it involves yesterday’s purchase of MLNX.
http://youtu.be/Zde6APNQiV8
Comments »Buyers Reacting: Will They Push The Initiative Into The Bell?
This afternoon’s dip was quickly bought up by the bulls, now it’s their opportunity to initiate new longs and position for higher prices. The balls in their court going into the close:
Note: I’m yet to be able to part ways with any of my degenerate postitions, they all still look good.

My Portfolio Became a Pile of Degeneracy Last Week – You Love a Good Degenerate
Late last week, I started seeing several charts setting up in a manner I prefer, and with the docile behavior of the S&P I began buying up shares in names like ZIP, F, ATML, FB, and DDD. These stocks were added to my other wiry positions: VHC, PPC, and TSLA. Having a portfolio of these types of names can be more fun than a barrel of monkeys. But anyone who’s ever kept a pet monkey will attest to the fact that at some point the monkey will challenge you. You’ll come home, and that cuddly pet will have grown into a fucking gorilla, perched on your china cabinet with a fucked up look in its eyes.
Last week’s buys took my cash levels down to 25% and I intend to rebuild that cash level at the slightest sign of weakness. Top of my list to sell include: DDD, TSLA, FB, and ZIP. If their behavior demonstrates weakness they will be cut.
Should the ground the market stands on (profile) begin to look shaky, I want to be back to my core holdings (GS and AWK) with a much smaller portion of degeneracy. However, should said degenerate stocks continue to hold their respective nine day exponential moving averages I’ll ride.
Looking back at the profile from last Friday, we can see the early NFP numbers had us opening above all respective value areas for the week. Again the sellers stepped in and smacked the penis lower, recapturing much of Thursday’s value area before we found buyers and spent the rest of the day methodically auctioning higher; a slow grind if you will. The resulting auction succeeded in pushing value higher for a third day, but failed to place value above the important 1415.50 level (142.15 SPY).
We’re set to open right on this key level again this morning. Bulls want to see 1414 hold, otherwise 1412.75 value area low.
Upside targets include Friday’s high, 1420, then last Monday’s above 1422.
Comments »Fetch My Looking Glass and Let’s Examine This SPYder
When the daily price bars start to tighten up on the SPY ETF, I like to take out my magnifying glass and take a closer look at the auction activity. Looking at a chart of the cash trading hours (9:30am-4:00pm EST) shown in market profile accomplishes this task.
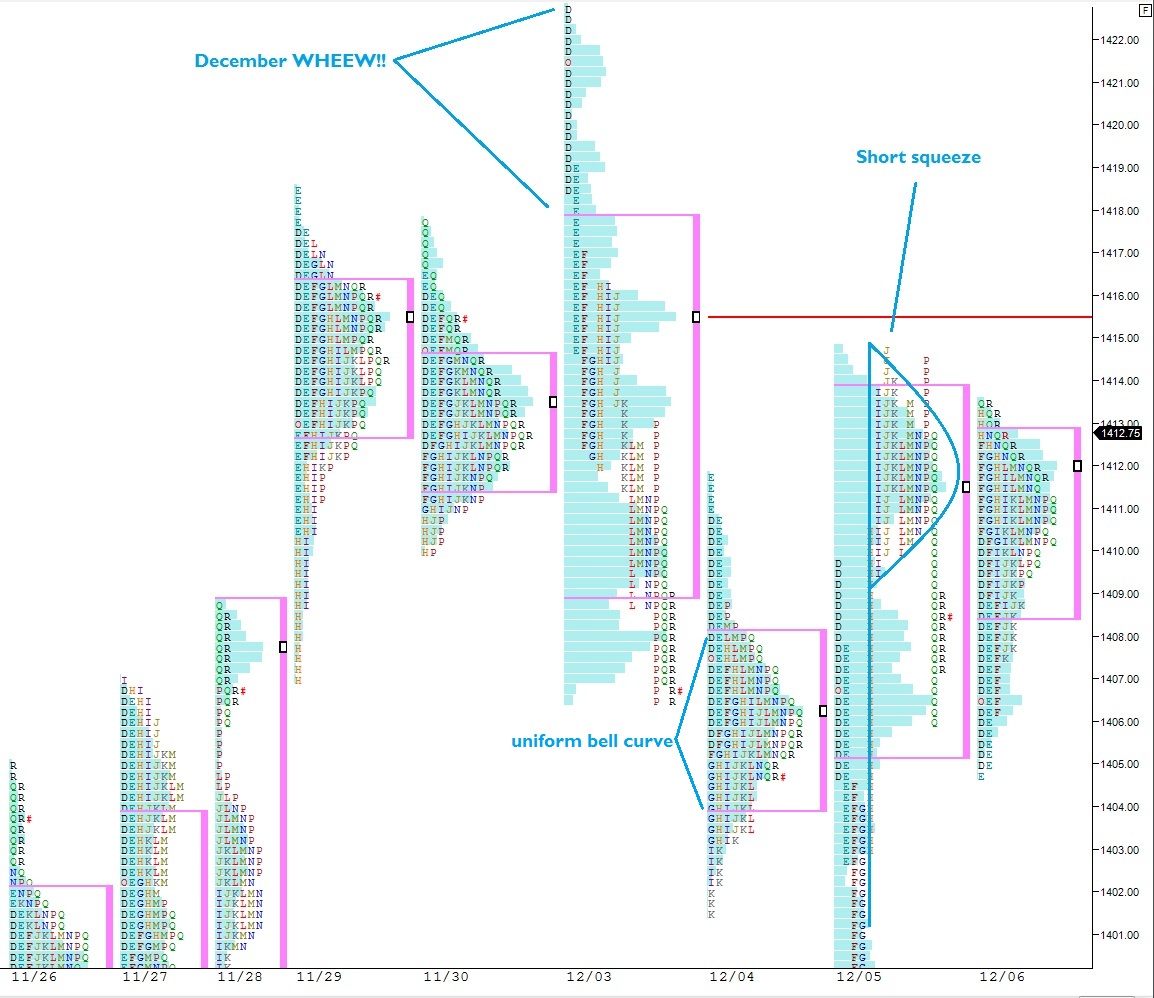
We started the month this Monday with a euphoric gap higher and price was quickly knocked down and with enough steam to blast price below the value established at the end of last week. Price gapped too high, and the sellers reacted by smacking the penis or whatever it is Rhino likes to do.
Tuesday formed a very balanced, Gaussian curve of activity. Look at the shape of the profile, a very uniform bell curve. Balance was reestablished after the bears controlled price Monday. The buyers were back. Then yesterday morning (Wednesday) the bears showed some aggression and tested lower. Shortly after a vicious short squeeze ensued, giving us the familiar “P” shaped profile.
A short squeeze profile during a downtrend usually indicates a temporary market imbalance, and a continuation in the trend lower is likely to resume. However, during this indecision, after a V-shaped recovery, it can be the spark to get a rally started. Today’s action was tight and contained mostly within Wednesday’s value area. It sat put, while the euro dollar went off a cliff.
I glean bullishness from this closer examination. What firms my stance? Key levels above need to be captured ASAP by the bulls:
Wednesday’s high: 142.16 SPY
Monday’s VPOC: 1415.50 ES_F (right near Wed. high)
Sustaining trade above these levels gets the bears on their heels.
Watch for a flush if we spend too much time below today’s value area 1408-1405.


