Seasonality data is still new to me, but given the volume of the data available it’s interesting to analyze the distribution to understand what is normal. If we can define February performance that is normal we can hone in on stocks and industries whose behavior isn’t normal in the wonderful quest to extract money from our markets.
When you put all of the average monthly returns available in The PPT seasonality into a frequency histogram you see a normal distribution which forms the familiar bell-shaped curve. Most readers of this site made their way through the school system by being massaged into the lower 1/3 of the bell curve. Good for you. I know a few of us were up in the 99th percentile, let us continue.
Once I have the data set I can make some observations which can direct my eye to potential opportunities. My first observation is the slight upward bias of the distribution. The highest frequency occurs above the zero line. This could be attributed to the upward bias of the market during the month of February. Next I use my eyes to single out where roughly 70% if the data is, much like the value area on a daily volume profile auction. I’ve noted the range of normal February returns in orange on the following chart:
Much like the value areas from my profile charts, the opportunity lies at the edges of value. This is where we can focus our attention and do business. The extremes of the tails are interesting, but they could be erratic, event-driven performance. If an industry’s stocks moderately outperform a massive dataset, there is a proclivity for repeat performance.
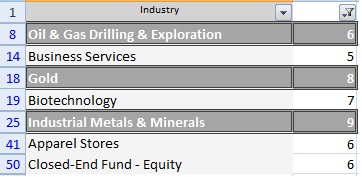
Thus I filtered the data down to stocks that reside in the fat tail of the upper distribution, with performance in the range of six-to-ten percent. The data returns 187 (buck, buck, buck) stocks. Finally I see which industry has the most stocks from this sample. The winner is Industrial Metals & Minerals then gold:
Given Fly’s take on the data and mine [sic] I would say it’s going to be a shiny February. It’s nice to see Senator Gint rejoining the ranks today. You should read his post today and run through his entire archive and consider yourself lucky to have that knowledge free at your disposal.
http://youtu.be/oxpcZrQQM-4
If you enjoy the content at iBankCoin, please follow us on Twitter


LOL at the 187 BUCK BUCK BUCK
Yes it appears the stock gods intend to commit homicide on the metal shorts.