April marks 1 year since we started working on Exodus 2.0, an exponentially massive project that I thought could never get done. IT estimates were anywhere from 1yr to 2yr the annual revenues of the platform and the MILLION lines of code, more than the total beachfront of the coast of California, seemed like a task that was insurmountable. Like aways, fate reached out to me and made it happen.
I was updated today on the progress and have been micro-managing the project from day 1, presently using the services of some trustworthy people in Germany, I found a new partner to help me take Exodus into the next phase of its evolution.
All data will stream, this includes our overbought/oversold algorithms, industry data, valuation data etc. We’ll have tangible price target estimates based on historical valuation data and future sales/earnings running in real time. The Pelican Room, which is probably the most important feature to upgrade, will be slack-like, giving users the ability to upload images etc. User profile pages will come with alert settings, users to follow, baskets to follow, screens to follow — and an array of things one would expect from a project Le Fly put his heart and soul into.
Presently, and due to the stock market refugees coming to iBankCoin and Exodus, I am overloaded with beta trial requests, which can be requested at Stocklabs — presently being graced with our newswire. I suspect completion by mid-May and beta trials around the same time with a full blown lunch by Summer.
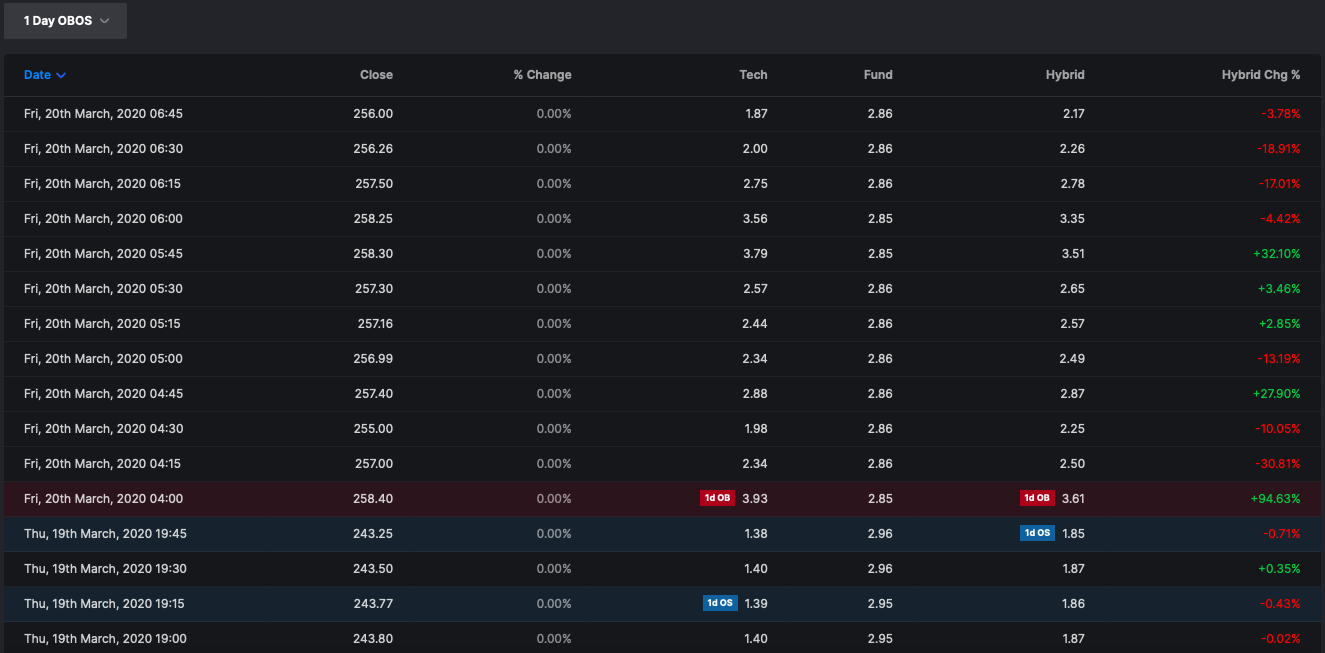
Here are some pics of the new features. My favorite new feature is the OBOS for intra-day, which uses my mean reversion algorithms, but modified for day trading. So far, so good.
New Market overview page will look something like this. We have our own indices now (LC =large cap, MC= midcap)
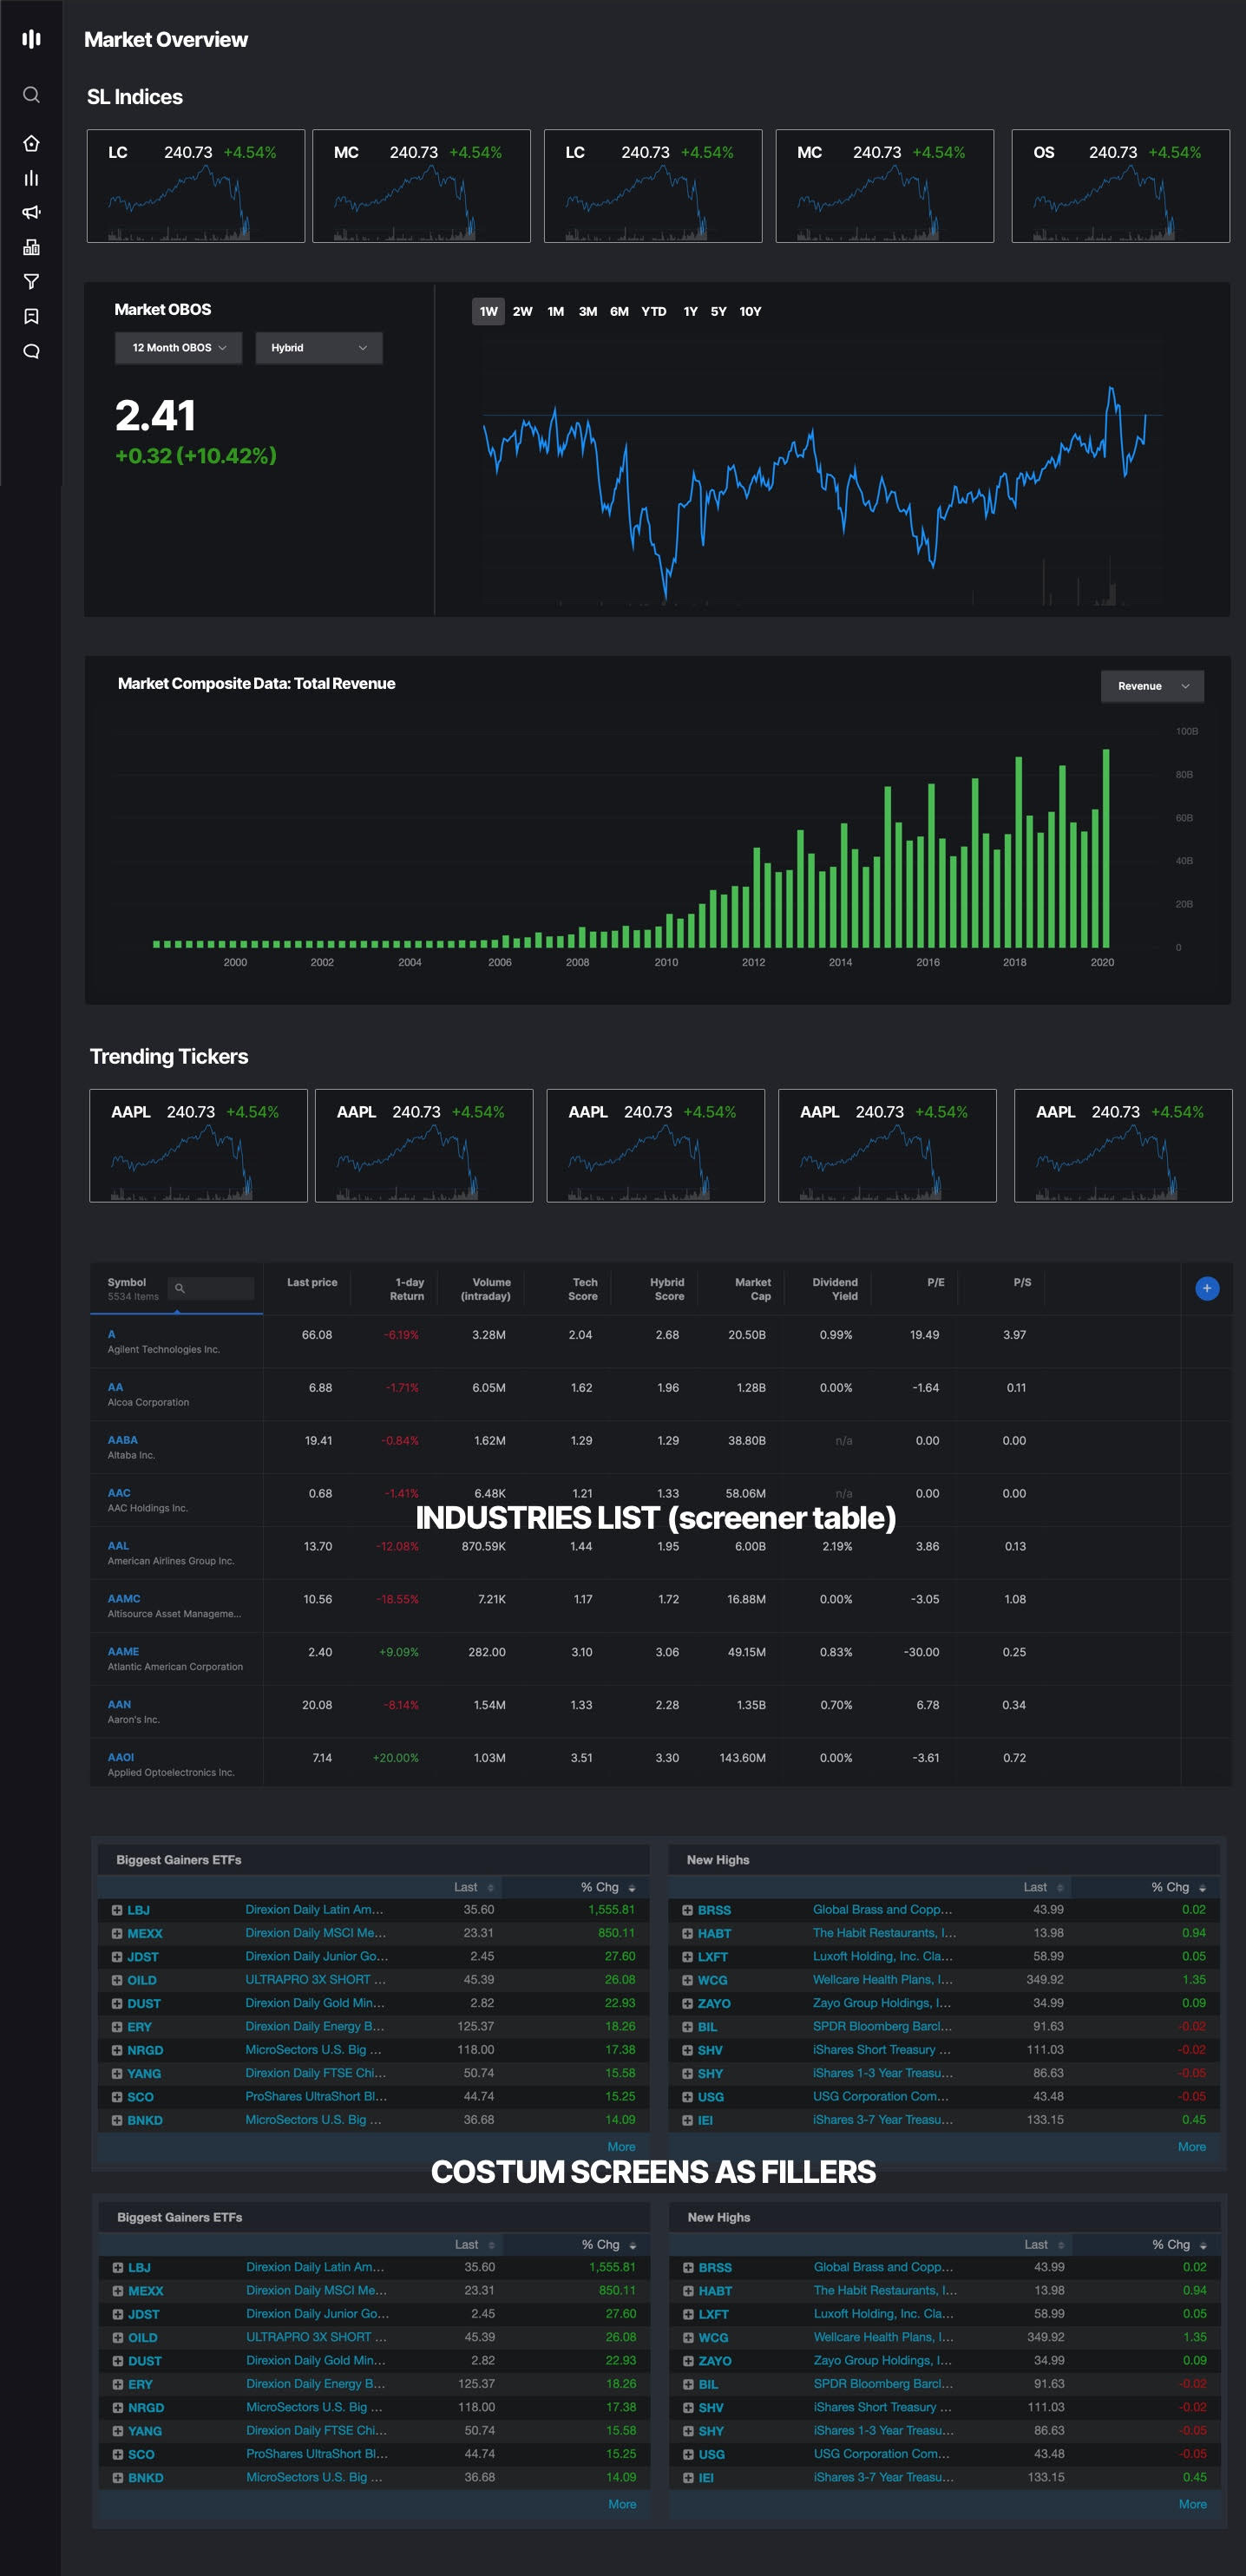

Share buybacks now measured, along with innumerable data points — revs, eps, FCF, EBITDA etc.

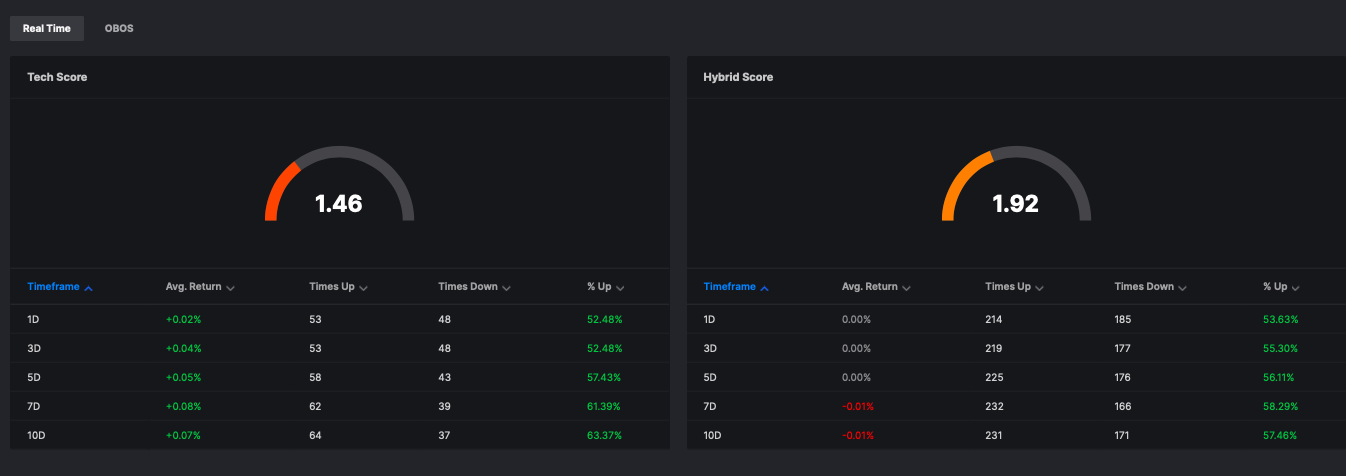
Real time algos provides RT insights into stock performance, based on the history of a stock, over a determined time frame. For example, AAPL has an algorithmic score of 3.45 out of 5 and in its history this has translated into a 1.6% return within 5 days over 300 data points.
This is our upgraded seasonality tool, which now measures months, days of the week, and hours. This is AAPL from 3/1/20 thru now. You can see the best times to buy and sell AAPL, or any stock, industry, sector, market, using this tool.

The OBOS (overbought/oversold) algorithm applied using 15min tick data, attempts to provide mean reversion, actionable, trades on an intra day scale. This is actual data for AAPL. We will upgrade this to have better user interface to clearly define the data and also make it screenable.
Things on the front burner include an Advanced Algorithm which will score stocks on a longer time frame so you can see what has been strong on say a monthly scale. Also, we have a volume alert tool that takes volume of a stock and pro-rates it by the minutes to provide alerts. If volume spikes on a 1min, 5min, 15min, 30min scale, you’ll know about. We can couple keyword searches, such as “COVID-19” with the volume tool in order to be a degenerate.
Comments »