iBankCoin
Joined Mar 24, 2016
17 Blog Posts

Will the Semiconductors rotate back to Biotech?

Last May (2016) I wrote an article here on IBankCoin about how the Semi Conductor (a major risk on sector) could lead the market out of the muck and off to all time highs. That trade has worked out well….but now that this sector is fast approaching it’s technical target (see chart below), the question becomes, what’s next? Where will money flow?
Could it be Biotech? I think the case can be made because it looks very similar to the Semi’s way back when. 

(Bullish Range Target on $SMH is 76.73 so expect some profit taking soon)

The Biotech sector both IBB and XBI have been trapped in a very nasty trading range for the better part of a year now as many other sectors approach or make all time highs. However, there are many similarities that can be drawn here as the Semi’s approach a technical target and the Bio’s coil above major moving averages. We could be coiling up for a potential move higher and the stars are aligned. Here is my thought process. 

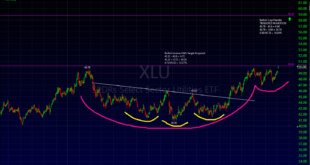
Examining the risk is always where I start….and to me the real risk is very clear on the weekly chart. While it is currently holding above the upward sloping  200 Week moving average, it continues to make lower highs and could be forming a topping pattern. However, until we see a confirmed break of that 200 week area, I’m going to give the sector the benefit of the doubt on the long side and see this area as very well defined risk. That 200 Week is an area that has continued to hold up despite this correction so it’s going to take a very firm break of that to really roll this sector over. This right now looks like more of a 2 year correction than a major top as we take everything into account, but we’ll be watching that moving average closely to see if it continues to support as it has so far. (See chart below) 

Based on that weekly, I am holding a bullish to neutral bias at least until we can see evidence of a break.

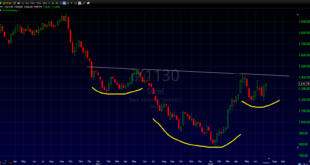
As I reduce the time frame to the daily chart, we can observe that it’s currently also holding above a rising 200 period moving average (much like the weekly above).
Additionally, it could be trying to form a bullish reversal pattern as it coils in the low to mid 60s. This has my attention.

As a final data point, I like to look within the sector for some cleaner reads, so here are a few names that I’ll be watching.

$BLUE -> Kind of a double bottom, with a cup/handle. Would like to see this one hold above the range box of ~$65 for the lowest risk. Looking for it to fill the gap up at 82 as a first point of reference. 

$AQXP  -> Interesting setup after a year and a half of consolidation. As long as it’s above 15 it’s fine. 21.50 would  is my first target

RTRX -> A nice coil right at the 200 DMA. Watching to see if this one can break above the immediate term down trend line and hold 18. 

ONVO

Not necessarily Biotech, but healthcare none the less.  Holding that Rising 200 Day for dear life with a bullish reversal pattern. Worth having on the watchlist for a break out of this choppy mess it is currently in. 

The bottom line for me is this.
1) A major risk on sector (Semi Conductors) is approaching a major technical target, with momentum drying up suggesting the possibility of some rotation.
2) Biotech, another risk on sector that may get some rotation is showing a few signs that it wants to make a move.

With the information and thoughts above, I’m leaning to the long side for now and have a watchlist of names to play in case it moves in a favorable direction.

Something worth watching in the days and weeks ahead.

What do you think?  

Comments »

Retail can not get out of it’s own way!

One sector that keeps catching my eye as a risk is retail, which technically remains a complete and utter disaster.

A quick look at the daily chart and we find a choppy down trend, with 3 lower highs low that 47 level.

The biggest problem I have here is that this sector really has not participated in much of the rally to all time highs, but rather just been choppy and appears to be forming a major top on the Weekly chart. In order for me to really feel otherwise, we must see a HigherLow and a move up and hold above 47, but until that happens this is a sector I personally am staying away from or looking for shorts within.

As we drill in most of the names in the sector are giving the same message. Down Trend.
Take Netflix for example.  While it has been able to hold the 85 level, it is continually setting lower highs. That needs to change in order for me to think it could possibly be a long idea for anything more than a potential day trade.

This topping theme is prevalent in many places within the sector, which is something I don’t want to be a part of on the long side. While there are a few names that look healthier, these types of setups, like the one below are quite dominant, which tells me to stay away.

If you are one that loves to short, this sector smells like a place to be doing some hunting. I would very likely consider this thesis wrong when 47 area becomes support rather than resistance, but to this point there is no evidence of that happening. Take a walk through the retail sector names and tell me what you think.

Comments »

Coincidental MY ASS! Biotech Tweets should land HRC where she belongs.

If only we all got to play with the same rule book as HRC.  Had the SEC raided Steve Cohen’s SAC and found out he was running a private email server out of his basement in North Greenwich, so that he could communicate privately with his PMs; not only would the luscious Real Estate on Cummings Point Road  be put up for sale and 1200 employees out of work with the closing Point72 (formally SAC).  But Good Ol’ Stevie could book a one way ticket to Colorado for a lifetime stay in ADX Florence and the SEC could finally put their lifetime, tax dollar draining witch-hunt  to rest and we all could live happily ever after.

Only if they would pay attention to the evidence right beneath their noses and take down HRC. But not in election year.

I’m not being political here one bit. Just fair. Calling a spade a spade. And if she wants to prove me wrong, go ahead and release the list of hedge fund exposure so we can all review the 13F filings and see just how much short BioTech exposure the Clinton Estate has on the books.

But it will all be forgotten and instead the former first lady will get a one way ticket to the White House, no questions asked.

If one thing has become clear to me over the last year….it’s that if somehow Mr. Trump pulls off a miracle, HRC certainly has a future as a biotech trader. She certainly can one up Andrew Left if her and her puppeteers were to decide to launch their own version of Citron Research. I must say for someone who’s only awake 5 hours day, she sure knows how to trade a Head and Shoulders topping pattern….That is unless it’s just pure coincidence. Which I’m sure it is.

EVIDENCE or COINCIDENCE….I will let you decide.

Exhibit A.

September 2015.  Biotech’s form right shoulder and the future POTUS tweets about her plan to take on the Bios. Yep….sheer coincide….Got it! For the record I was tweeting heavily on Stocktwits over this weekend, calling for a short entry. Little did I know the gift HRC was about to give.


Exhibit B.

August 2016.   FOOL me twice…Shame on You!


Comments »

Technically the future still looks bright

This Week’s Price Action


Weekly Summary:


  • S&P Market continues to Grind Higher into inverse H&S Target of 2225
  • DJIA Forms Cup/Handle Above Range breakout. Still targeting 18941
  • RUSSEL 2K acquires it’s Inverse H&S target 

In my last post (Bulls on the Goal Line)here at iBankCoin we identified the inverse H&S breakout and we were sitting just below the 2134 all time high. Wanted to update on where I see things today based on current price action. 
At this point both the NASDAQ and the Russell 2k have acquired their minor upside trading targets we discussed in that report and the DJIA and the S&P still grinding into them. It is very hard in my mind to be bearish in any way shape or form when both the NASDAQ and Russell are are acquiring major upside technical targets while the DJIA and S&P 500 sitting at all time highs with bullish technicals still as a tailwind. As you will see in the rest of this report, you really have to stretch to make a case for the bears. As always that is a know your time frame thing, as it doesn’t mean we can’t see a 1% down day here and there, but the technical picture as we stand today remains quite bright. 

Let’s get started looking at the price action.


S&P: 
Swing Time Frame (30 min) :  Bullish Cup/Handle targeting 2225 remains in motion. While it appears we will capture that target, I have drawn in pink the riskiest scenario that I can see playing out. That is some sort of topping pattern forming here using last weeks highs as a head. At this point the market continues to just slow grind into the target, but we always keep an open mind as to what is actually occurring. 


Big Picture:
Big picture the trading range remains broken as the we grind into our first target of 2225. We have a 300 point cup/handle in motion as well as the smaller 30 min cup/handle. While 2225 is our first priority the measured move on the cup/handle is 2412. I have drawn out a few scenarios where we could dip back to as low as 2100 and still be thinking bullish. So from a big picture, there is very little to worry about until we see price action that wants to attack 2100 and below.

DJIA
Swing Time Frame (30 min) : 
DJIA, cup/handle still in motion. Target 18941. Possible 2nd cup/handle forming out of this recent consolidation. No bearish price action to speak of and even hard to invent any here like I did above with the S&P.

Big Picture: 
2 Cup/Handle setups in motion and a 3rd under construction. Our first target is 18941. However the larger cup/handle targets 20884. Very little to be bearish about with the price data we have in front of us today.

Russell:
Swing Time Frame (30 min) :
Bullish Inverse H&S acquires upside target at 1235.60

Big Picture:
Bullish Inverse H&S in motion targeting all time highs. After acquiring the minor target it is reasonable to expect some kind of profit taking type pullback, so don’t be surprised completely if we see a test of the 1180 area.
However as long as we are above this neckline drawn below, the benefit of the doubt goes to the bulls from a big picture perspective. The target here is just north of 1400 about 15% higher from here.

NASDAQ
Swing Time Frame (30 min) :  Bullish Inverse H&S acquired it’s target.

Big Picture:
While it needs to still take out and hold above 5231, the all time high. We have a much larger bullish pattern in motion targeting 5728. That is Plus another 10% or so.

Breadth

Not great over the last month and starting to see some divergence as market move higher without participation, but it is hardly falling apart. Still only mid range so not really overbought or oversold.
Bulls would like to see this pick up, but it may take until after labor day when people come back from vacation.


The Bottom Line:
Let’s break down the evidence.

  • Of the 4 major US Indexes that we reviewed 2 (NASDAQ and RUSSELL) have acquired their upside targets on the 30 minute time frame with the DJIA and S&P still grinding into their targets. 
  • All 4 have larger technical breakout patterns in motion targeting between +10 and 15% moves higher. 
  • It is a stretch at this point to find a bearish technical setup in the major indexes.

With the charts we reviewed and these 3 bullet points it looks like the market wants to continue higher. If and when we see price action develop that puts the market at higher risk, we will identify it in the nightly reports. However until then, there is very little evidence of anything other than consolidation for a move into the upside targets particularly in the DJIA and S&P which are yet to acquire their smaller targets. 

This Week’s Chart’s in Focus:

Let’s review a few charts that I consider worthy of your attention:

Transports (IYT): Sure would be nice to see an upside resolution in this one.

Retail (XRT): Same holds true here. Would be much more bullish for the markets overall to see further rotation into retail and for this inverse H&S to resolve higher above the neckline. 

Utilities (XLU): Continue to hold the trend and the Cup/Handle breakout targeting 58.75. The risk we want to watch for is what I have drawn below.

XDN.X : Japanese Yen

Cup/Handle targeting 106 remains in motion. Interesting that what is supposed to be a risk off asset keeps going higher. Certainly has my attention despite the bullish price action in the US Indexes

XOP: The oil related sector etfs all look quite similar. It will be important for this sector to breakout above the recent highs trigger this bullish inverse H&S. Target would be ~54 if it does. Keep an eye on the names within the sector as well. I have several on my watchlist.

AMZN: 

This is how a Cup/handle is supposed to work. Still 30 points form acquiring it’s target, expect that to happen, then we re-evaluate. 

AAPL-> Last but not least America’s darling.  Using Trend lines, AAPL has broken the down trend, but in my mind this is still a lower high. It has a double bottom in motion targeting 114.31. Acquiring that target sets a higher swing high, something the stock has not done Since Feb of 2015, the beginning of it’s current top. I will be more comfortable with this one if and when it acquires the target. (i.e I will watch the 2nd pattern to form and become a buyer. It is possible the trend is changing here, but it still needs to prove itself.


All of the charts and commentary below are provided as information only and do not constitute a trade recommendation nor investment or trading advice. Any investments, trades, and/or speculations made in light of the ideas, opinions, and/or forecasts, expressed or implied herein, are committed at your own risk, financial or otherwise

Comments »

Bulls are on the Goal Line

This Week’s Price Action


Weekly Summary:


  • All Major US Indexes trigger swing time frame bullish patterns targeting higher. 
  • Markets Hovering just below all time highs, still in the range but have price action to take us out.
  • Remain on Bull Trap alert at least until all time highs can become support.

Much like the bears back in February, the bulls are on the goal line, but still need the final push to break us out of the 300 point SPX trading range.

This week we saw some early weakness bought and the markets used the reaction to the Jobs report to trigger bullish patterns across the board. Technically speaking, if last weeks lows can hold we have target 5-6% higher from here, which is all time highs and then some. There is no bearish price action on the horizon and rather the only leg left for the bears to stand on is the All time high resistance in the SPX and DJIA. The SPX came 3 points from the All Time High on Friday. That level must continue to be respected as it means we are still in the 300 point trading range that we have been in since the end of QE3. This market has enjoyed both bull and bear trapping these patterns, so the range highs remain important.  I for one will not be long if the neckline is not defended next week on any retest. In the SPX that neckline in 2110. Below that we go in neutral territory again. However above it, super bullish. It is very likely that level (2108ish) is tested at some point so it will be important for the bulls to defend it and take us higher,  above the 2134 All time high. With this in mind, let’s review the indexes.

S&P: 
Swing Time Frame (30 min) :  Bullish inverse H&S triggered with a cup/handle in the right shoulder. You can see how close we came to All Time High on Friday. Target 2225.74 as long as last week’s lows hold. 


Big Picture:
Completing this smaller pattern would break the range to the upside giving us much larger targets. For now, let’s focus on the first pattern targeting 2225. Important that the bulls can complete it. 

DJIA
Swing Time Frame (30 min) : 
Same as SPX. Triggered pattern. Just below All Time Highs, target 5% move.

Big Picture: 
Still in the larger range. So respect that a bull trap still very possible. Use the swing time frame (30 min above) neckline to protect capital.

Russell:
Swing Time Frame (30 min) :  Inverse H&S Triggered. 1236 target

Big Picture:
Much larger Inverse H&S to watch if swing time frame pattern can complete.

NASDAQ
Swing Time Frame (30 min) :  Inverse H&S targeting a test off All Time Highs.

Big Picture:
You can see where the target would take us. 

Breadth

Strong Breadth this week. Never went oversold in the pullback and consolidation since March. That is a bullish sign.


The Bottom Line:
There is no good reason to not just focus on the current patterns in place and now in motion. As long as those necklines hold, the market wants higher. The risk is well defined to be long here. As I have said above, it is critical that we can close outside of all time highs on the SPX and DJIA because until we do, we must be on high alert for a bull trap. Traps (i.e pattern failures after breakout or breakdown) have been this market’s favorite trade of late and we must continue to keep our eyes peeled. That being said, we are seeing triggered patterns across all indexes which tells us the stars are aligned. Over the past few months, we were seeing setups in 1 or 2 of the indexes and the other 2 would be so so. Here we have clear buying taking place in all indexes leaving the bulls in the drivers seat. They have the benefit of the doubt above the neckline and last weeks lows. We will use those areas and the price action that develops on a move back below the neckline to re-evaluate, but until then, no reason at all to be trying to short. 


This Week’s Chart’s in Focus:

Let’s review a few charts that I consider worthy of your attention:

Latin America (ILF): Bullish inverse H&S setup. Need a close above 27.40 to trigger, but keep on watch list. 

Healthcare (XLV): Triggered bullish Inverse H&S. Should retest highs then re-evaluate. Full measured move is $82.

IAI: Aerospace and Defense.

Big Cup/Handle pattern near the highs. If it takes out recent highs that would trigger pattern. Target near 150.

IYZ: Industrials
Cup/Handle in motion as people chase for yield. Looks much like the chart of the Utilities I have been highlighting since early June. This one still has meat on it 38.95 target.


MOO (Agricultural Business)  -> Inverse H&S under construction here. Something to watch.


All of the charts and commentary below are provided as information only and do not constitute a trade recommendation nor investment or trading advice. Any investments, trades, and/or speculations made in light of the ideas, opinions, and/or forecasts, expressed or implied herein, are committed at your own risk, financial or otherwise

Comments »

Is anyone else watching the Steel Sector? $X $AKS

Back on February 13, 2016 I did a big write on my blog regarding the bullish patterns within the XME sector and that it looked like it was bottoming. On March 6th of 2016 I updated the post saying that XME had acquired it’s upside target and that I took my profits and would wait for the next bullish setup to arrive. (i.e I would rotate out and into something else that was moving).

On February 20th, I did similar analysis by looking withing XME and noticing that the Steel Sector was showing signs of life. I did a quick post “Is it crazy to think Steel is bottoming?”

In last week’s journal, I had 7 things that struck me as I review the post Brexit charts.

#2 was
“Many of the sectors that broke bottomed first in Feb and led us higher, are now seeing continuation price action patterns (cup/handle breakouts)”

It is that theme that has me long the XME ETF and looking within it now for some beta. In doing so I can’t help but to look at the steel names once again. All poised for their next move potentially higher.

Here are a few charts worth watching in the metals and steel space.

First the SECTOR CHART

SECTOR Relative Strength appears to be bottoming as well.

US STEEL

AKS

PKX


WOR

FCX (Copper not steel) but a setup to watch none the less.


Don’t forget to check me out on twitter @higherlowz


Comments »

Be Aware of the Double Top


This Week’s Price Action

Weekly Summary:

  • Inverse H&S from last week, acquires target and then Brexit dump
  • Potential bearish range breaks on the radar
  • QQQ triggers bearish double top.

This week was all about Br-Exit. Last Sunday night while Dustin Johnson was bailing out the despicable USGA by winning the US Open handily and we quietly tuned in to watch a tremendous NBA final game 7, futures were ripping due to a poll of 800 people that had Bremain in the lead. Technically speaking, this gaped us out of an inverse H&S which acquired it’s target on Thursday afternoon after a choppy week of trading. 

If you follow me daily, during the morning PEP Talks and Nightly Recaps,  I basically said, I plan to do nothing most of the week. I followed that plan until Thursday when I traded the inverse H&S breakout on the QQQ. However, my rule was and always is I don’t hold into events or earnings, and Friday morning we found out why. The bag holder gamblers got stuck long, betting on an unknown event outcome.

If you were long, take it as a lesson in life and move on. We have no edge in predicting outcomes of major market catalytic events, so we don’t hold positions into them. 

Let’s now begin the weekly review and figure out what the technicals are saying. 


S&P: 
Swing Time Frame (1 hour) :  In order to turn the tables bullish, we would need to clear this band of resistance. Otherwise looks like a lower swing high being set here in a swing down trend. We don’t have a clean pattern to work from but with markets in a trading range, appears a 2040 test is likely. Other indexes will back up this thesis. 

I

Big Picture: 
If the range breaks, you can see how the pattern has played out in the past. Very possible we have our right shoulder now. This could take us to 1600. This current range is our number 1 priority for now. 

DJIA
Swing Time Frame (30 min) : 
Testing the lower end of the 832 point range. A break below it would target 16499, which is also the 61.8 Fib retrace from the Feb low to the April High. Buckle Up.

Big Picture: 
Similar to the S&P, range break lower could test the lows. 

Russell: 
Swing Time Frame (30 min) :  Looking at the 161.8 Fib around 1100 to see if it can become support. Major support at 1088. 
Inverted cup/handle or H-Setup target 1076.03

Big Picture: 
IF market unwinds, very possible we test the lower trend line. 

NASDAQ
Swing Time Frame (30 min) : Bearish Double top. Has not triggered yet, but target is 6.5% lower at 4377

Big Picture: 
H&S top formation is there. Triggering double top  (shown above) would test the neckline. 

Breadth

Basically weakened last week by quite a bit. We went from 51% to 40% of stocks above 40DMA


The Bottom Line:  
What is the Catalyst to take us higher? Is there a catalyst to now take us lower? Those are the questions you must ponder as a BTFDer. While markets are all still holding major support, a break of that support has major negative implications with target at least 4-5% lower and potentially far worse if the larger multi-year topping patterns do indeed play out. The catalyst is now in place and the technicals are aligned here for a potential perfect storm. With risk off assets like the Yen, and the shiny metals ripping higher, volatility catching a bid and bearish technicals setups in the major indexes, this is no the time to be blindly buying the dip. If the dust is going to settle and Brexit is no big deal, a bullish pattern will find it’s way into the tape, but it’s not there yet. Friday may have been day 1 of another big sell off. 

This Week’s Chart’s in Focus:

Let’s review a few charts that I consider worthy of your attention:

Japanese Yen : This risk off asset saw follow through on it’s  

Utilities (XLU): Continue to hold above the cup/handle breakout. As log as it stays above, this continues to be a very good chart to own. Risk is well defined. 

XLY : Consumer Discrectionary 

Doesn’t look all that healthy, so if you are looking for shorts, inside this sector is a good place to start. A lower high on the longer term time frame (pink), with a small H&S top in the right shoulder (yellow). This sector is on the verge of a late bull market breakdown. 

XLI: Industrials 
Forming another potential double top. Another sector that looks vulnerable over the longer term. 


GDX->A few of you asked me about these this week. This has a cup/handle pattern in motion with a target of 30.10, so continues to be fine. 

All of the charts and commentary below are provided as information only and do not constitute a trade recommendation nor investment or trading advice. Any investments, trades, and/or speculations made in light of the ideas, opinions, and/or forecasts, expressed or implied herein, are committed at your own risk, financial or otherwise


Comments »

Should We Expect Another Turbulent Week Ahead?

This Week’s Price Action


Weekly Summary:


  • Pre-Br-exit panic continues. 
  • Very little super compelling price action as it appears the markets are in a trading range

First and foremost, Happy Father’s Day to all the Father’s out there. 

Market was weak but choppy this week as the players prepare for Brexit and had to deal with the ever annoying Fed, who continues to do nothing and say nothing as they leave people more confused after each meeting. Part of the reason the price action has been so choppy requiring very tactical trading as there is no trend to follow.


S&P: 
Swing Time Frame (30 min) :  In order to turn the tables bullish, we would need to clear this band of resistance. Otherwise looks like a lower swing high being set here in a swing down trend. We don’t have a clean pattern to work from but with markets in a trading range, appears a 2040 test is likely. Other indexes will back up this thesis. 

I know many (including myself) are looking at the potential of this inverse H&S. Two reasons, I am skeptical.
1) The amount of price memory in the left shoulder creation. (typically it will peak and roll over) this was all the gamblers loading the boat into the fed. Suggesting underwater buyers there that need to be capitulated first.
2) The other indexes are suggesting otherwise.

It can happen, but for me to like it, I need to see the fed high taken out, not just the down trend.

Big Picture:
Looks like another trading range being developed. Over the last month we have had a failed breakdown and a failed breakout creating another 100 point box. Within a larger 300 point box (1850 to 2130).
The break of the box and follow though will be the big trade so be prepared for that most importantly.

DJIA
Swing Time Frame (30 min) : 
DJIA, it continues to be the easiest of the indexes to read in my opinion. This looks like a H&S top targeting 17313. I will look to be short as long as this is below 17700 with a target of 17313.

Big Picture: 
However, let’s keep the big picture in mind as well. We are just making another large annoying trading range. Until we break above or below with conviction and follow through, we must trade it like a range. That is look to be a buyer near or just below the bottom of the range (or on a failed breakdown), and a seller as we approach the top. Then we use the lower time frames to find price action that confirms or denies the thesis. This 800 point range will eventually break one way or another for good and we will trade in the direction, but until then we must expect very choppy range bound trading with many little scalp trade setups and failed moves. Use this chart below to study what you want to look for in a confirmed range break.

Russell:
Swing Time Frame (30 min) :  H&S Top targeting 111.36

Big Picture:
Last week we talked about 115 being important. We are now back below 115 on a weekly close which basically confirms a failed breakout. We have the 61.8 fib at 112 (measured move target 111.36)
and then below that support is at 108.

NASDAQ
Swing Time Frame (30 min) :  Not much to like here at all. Pretty much the worst of the indexes and has been.  Very nice downward channel, would need to see a higher low above the channel to change the picture. Looks like filling those two lower gaps is on the radar. 

Big Picture:
Potential double top or H&S top forming. Expect that lower support to be tested  at some point in the near future. Based on swing time frame, no reason to think otherwise at this point.

Breadth

Basically unchanged, but weakening overall.


The Bottom Line:
The weight of the evidence is suggesting some further weakness ahead. However we are still are seeing trading ranges that must be broken first and foremost to be overly bearish. Until then we will trade the swing targets (noted above) and look to potentially flip long down near the bottom of the range. A pattern will eventually form to take us out of the range either up or down so we will continue to watch for that.  These ranges have tended to last 3-6 months so this can continue for a while still. All we can do is continue to monitor the price action and ignore the noise. Brexit has nothing to do with how I am trading. I could care less. It is the reaction to Brexit that will be important. Gun to my head, it will be a buy the news event, so will be very well prepared by looking for an inverse H&S setup near the bottom of these ranges. If they do exit, the ranges can break and we will use the size of the range as our target. That is all you need to know or care about to be prepared for this event. Don’t spend your time thinking about what it means, nobody knows what will actually happen if they stay or go. However the market will have a trade setup to take advantage of. We want to be aligned with the move whichever way it goes. To sum it up, price action will determine how I am positioned (Long, Short or Cash into and around the event) not what any moron pundit economist (aka astrologist or palm reader) is saying on CNBC. $STUDY.


This Week’s Chart’s in Focus:

Let’s review a few charts that I consider worthy of your attention:


Utilities (XLU): Continue to hold above the cup/handle breakout. As log as it stays above, this continues to be a very good chart to own. Risk is well defined.

XLY : Consumer Discrectionary 

Doesn’t look all that healthy, so if you are looking for shorts, inside this sector is a good place to start. A lower high on the longer term time frame (pink), with a small H&S top in the right shoulder (yellow). This sector is on the verge of a late bull market breakdown.

XLI: Industrials
Forming another potential double top. Another sector that looks vulnerable over the longer term.


GDX->A few of you asked me about these this week. This has a cup/handle pattern in motion with a target of 30.10, so continues to be fine.


All of the charts and commentary below are provided as information only and do not constitute a trade recommendation nor investment or trading advice. Any investments, trades, and/or speculations made in light of the ideas, opinions, and/or forecasts, expressed or implied herein, are committed at your own risk, financial or otherwise

Comments »

Markets Return to a State of Confusion. WEEKEND JOURNAL : Saturday June 11, 2016

THIS WEEK’S PRICE ACTION


Weekly Summary:


  • Early strength is sold as H&S top triggers Bull Trap reversals back below breakout level.


This we started out looking at a cup/handle formation. (shown in pink below). We thought that triggering it and taking out the April highs would be a significant development do to the fact that the S&P had struggled to do that in past rallies. In other words, retests of previous highs were never successfully made a new high, but the retests rallies were sold instead. This time was different. We took out the prior swing high, but then immediately rolled over leaving both sides scratching their heads this weekend for sure. 

As we look at the hourly time frame below, we can see this very confusion. The breakout to this point has failed, however, we have not officially killed off the Cup/Handle as the handle low held.
That being said we can see the development of a tiny H&S top (blue) that threatens this bullish pattern. If Friday’s low is to be take out this week, this puts us at best in a range bound environment.

In a range bound environment, the way I typically trade is by looking for patterns on the lower time frames (5 min) and also keep a close eye on the unfilled gaps, and use them as trade to targets. Ranges are much more of a day trader environment than a swing trade environment, so for a swing trader trading the indexes Cash is King.

I’m far more neutral here. If you asked me today what my plan is. I would say I am very likely to be a seller of strength below last weeks high, and give the benefit of the doubt to the bulls above it. In other-words, further strength Monday that gives me indication of failure to take out last weeks highs is a place I will look to get short.

That being said, looking at the 5 minute chart I will watch to see the development of this potential inverse H&S which would target a gap fill from Friday’s gap down.

Looking at the DJIA this is clearly just becoming a range than giving any type of edge to bulls or bears. We had a failed H&S top, and now potentially failing an inverse H&S. This is about a 900 point range so the break and follow through above or below the range is what will become important. I will not be surprised to see this range last well into the summer at this point, but we shall see. It is starting to feel alot like last year, where we were range bound for several months, before a huge move lower.

Here was the 2nd and 3rd Qtr trading range from last year and shaping up to be much of the same this year.

On daily chart, it appears as though we are currently holding above the down trend line for now, but below this week’s low would change that quickly.

Looking at the Russell: That sure is one nasty looking weekly candle, not one that is typically followed by strength. This is not a bullish sign at all, but bears need to confirm it by taking down next week.

On the 30 minute Russel, looks like my S&P plan. Sell strength to start the week.

NASDAQ – Same thing. Looks like a sell strength setup to me.

Breadth

Breadth was flat overall for the week, but deteriorated into week end, just like the price action.


The Bottom Line:
After a good start to the week, bulls failed to take advantage of the technical wind at their back and now things are lining up  to be far more range bound at best. As always, we know how price action can change quickly, particularly in this large 300 point trading range on the S&P, so we just have to be unbiased and try to adapt with the price action. I will keep you up via the daily recap, the morning pep-talk and the mid-day refresher.


If you like what you read, remember to check out our daily newsletter


Video Journal:

Here is a video recap of what you just read.

Don’t forget to set the resolution to HD so it is easy to see the charts.


This Week’s Chart’s in Focus:

Consumer Discretionary (XLY): Keep an eye on this one. Huge topping pattern on the larger time frame with a smaller top in the right shoulder. This is a sector I will be looking in for short setups.

XME:  Metals continue to look great. This was a sector I wrote up early this year when it was forming an inverse H&S formation. Now it appear so be forming a nice size cup/handle. Keep a nice eye on this one particularly above 25.

EUNF -> European banking sector -> Negative interest rates are really taking their toll on these guys. After triggering a H&S top back in December, they consolidated in a bearish flag. They are now breaking down with a 13.53 target. This is a great short setup.

GLD -> Nice inverse H&S. The way I would trade it is buy above 124 or buy dips into the green trendline. This one may need some more time to turn the 200 week MA flat before breaking out. Not necessary, but just the way I’m thinking. I would not chase it into 124 until breaks above. 

SLV -> Similar to gold Started with a nice inverse H&S, and held the neckline retest, now looking to acquire first target and trigger 2nd bullish pattern (cup/handle)

IBB-> We talked about this one last week. I left last week’s chart in place for you to compare. My thoughts last week were that this was setting up to be a repeat of what we saw in Nov/Dec into the start of this year.

Last week’s chart. 

This week’s chart

If you like what you read, remember to check out our daily newsletter

All of the charts and commentary below are provided as information only and do not constitute a trade recommendation nor investment or trading advice. Any investments, trades, and/or speculations made in light of the ideas, opinions, and/or forecasts, expressed or implied herein, are committed at your own risk, financial or otherwise

Comments »

Utilities Technically Positioned for Nearly 20% of Upside Ahead

It appears the market is telling us the likelihood of a Rate Hike is not very high. Off of the wonderful Jobs Report Friday the Utilities sector broke out to new 52 Week highs.
Don’t worry the margin of Error on the jobs report is 100K so maybe things aren’t as bad as they seem.
This sector has about 18% of upside from here based on a technical measured move.
Add that to 3-3 1/2% yields and can be a nice return going forward.

We can see below that Friday the Utes acquired their inverse H&S target at 50.24 and are now triggering a bullish cup/handle with a target of 58.
I really only want to be long these above 49.75 and would rather be above 50.25 to more or less confirm the breakout, but I think these look great.
(The reason for this is that usually we see profit taking after a major target is acquired. However that profit taking took place starting in early April, forming the handle of the cup/handle)

I expect this to see follow through pretty quickly, but above 50.25 is the safest way to play it from a technical perspective. Fundamentally, if you are already in love with the sector, the Technicals Agree!

Below are several charts I hand picked to to the pattern and the relative performance to the SPY. We can get a bit of Beta to the ETF, but not much, so the ETF is the most conservative way to play it.

PNW below is probably the best chart, yield and return bang for the buck. It has a 3.37% yield with a 23% upside target.

There are plenty of other great setups in the Utes, I just hand picked a few.

Bottom Line: Keep an eye on this sector.

Comments »