iBankCoin
Joined Mar 28, 2014
35 Blog Posts

$AAPL Retesting the Line in the Sand

Apple Inc. is once again trading at it’s proverbial line in the sand, refer to my previous article here: $AAPL Line in the Sand.  The large top forming on this company is intriguing from a short perspective.

If the Brexit fears produce a global slowdown, $AAPL could be a primary instrument in which to get short.  It’s one of the most liquid trading securities, options included, and it provides exposure to a tech earnings downturn.  Here’s my updated long term chart:

aapl_06282016

My initial pattern did not play out as buyers came in and provided a stick save at the last moment.  However, the way $AAPL is trading lately is indicative of sellers supplying the market with shares.  Even today, during this nice bounce in equities, $AAPL is a serious under performer.

Here’s a short term chart:

aapl_06282016_st

As you can see I’ve been playing it pretty well; but the big move will come once it breaks down through the Line in the Sand at around 92.50ish.

Bottom Line: if you’re looking for short exposure, AAPL is an ideal candidate.

Follow me on Twitter at @dyer440.

Comments »

$XLE Update

In a previous post, Sweet $XLE Setup, I provided a potential setup that was developing on the $XLE (SPDRs Select Sector Energy ETF).  This post is a follow-up which I think you may find intriguing.

Please refer to the chart below (which has only been updated with price bars – original notes remain):

xle_06022016

As you can see, the retest of the recent high around $69 has failed (so far), and it appears it may easily roll over from here.

I will be entering a short position on $XLE if it trades below $66, and I will use a stop loss in the $67.6-ish area.  You can see from the chart my price target is the somewhere in the $57’s by the end of July.

Food for thought…

Follow me on Twitter @dyer440.

Comments »

Natural Gas Picks

As mentioned in my Natural Gas Outlook, I am forecasting natural gas prices to rise and possibly double in the next 12 months.  If you haven’t read that post, please do.  It contains a number of slides from a recent presentation I gave on the topic.

The problem with betting on commodities is the extremely high carry cost for holding futures that far out.  So you can either swing trade natural gas with a long bias, or use equities as your trading/investment vehicle.

So Here’s The Trade:

Let’s start with the US Nat Gas ETF, $UNG.  Full warning here – this is a terrible long term ETF to buy and hold – it’s design will cause it to underperform natural gas spot prices over time.  Therefore, only use it as a swing trading vehicle; I’m talking time-frames of days to, at most, a couple weeks.

I’d like to see $UNG consolidate above $7.00 for a few days before taking a stab at the long side.  It’s very volatile so use stops and trade it very tight:

ung_06012016


A better approach for a longer time-frame investment would be equities.  In this respect I have 3 companies that I think could be useful for upside natural gas exposure:

Long: $EQT (EQT Corporation) – at 25% of position

Long: $CNX (Consol Energy Inc) – at 25% of position

Short: $LNG (Cheniere Energy Inc) – at 50% of position

As you can see with the relative position sizes above, I think a three-way trade with 50% long and 50% short equity exposure will keep you relatively net neutral the overall market.

In addition, I think you should only pull the trigger on each leg of this trade when each individual stock actually breaks out.  So far, I am only in the $LNG portion, as I’m waiting for $CNX and $EQT to consolidate and show some further strength.

Refer to the charts and levels below:

lng_06012016

eqt_06012016

cnx_06012016


I may give a follow-up on the fundamental reasons behind these 3 picks, if interested?

Be sure to follow me on Twitter @dyer440.


Comments »

Natural Gas Outlook

I recently gave a presentation on the Natural Gas market at work and I think it could be beneficial to iBankCoin readers.  The following is a summary of the talk and I’ve used some of the graphs/charts from my slides in this article.

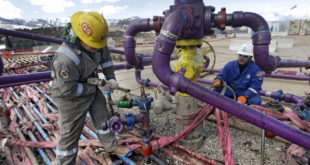
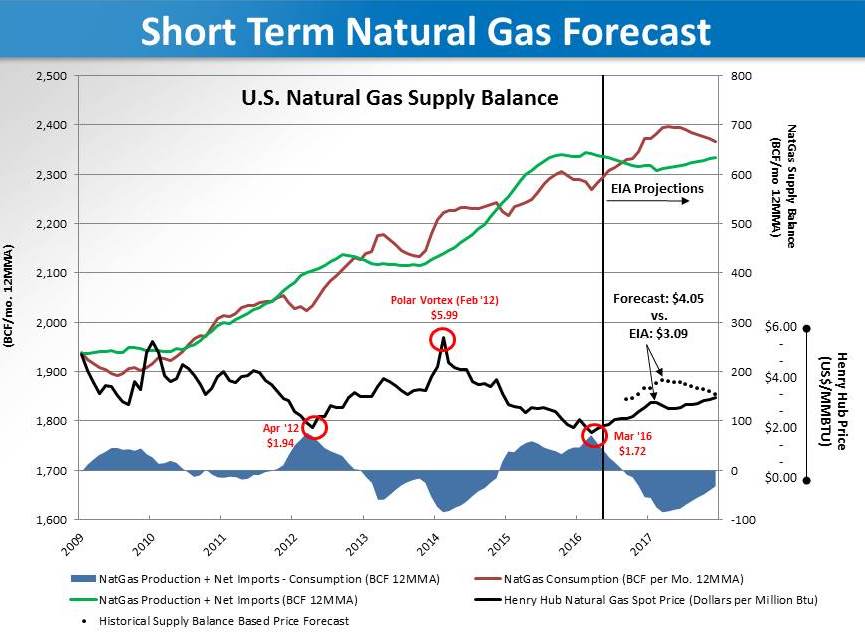
Natural Gas prices are currently at historical lows mostly due to the shale fracking boom.  The low prices are driving a number of factors that are leading to increased consumption, mainly LNG exports and Coal to Gas power fuel switching derived from new environmental regulations on coal fired power plants.  The net result has been increased production and also increased consumption.  We are in an era of seemingly cheap fossil fuels and the utilization of cheap natural gas has been dramatic:

SupplyDemand_LT

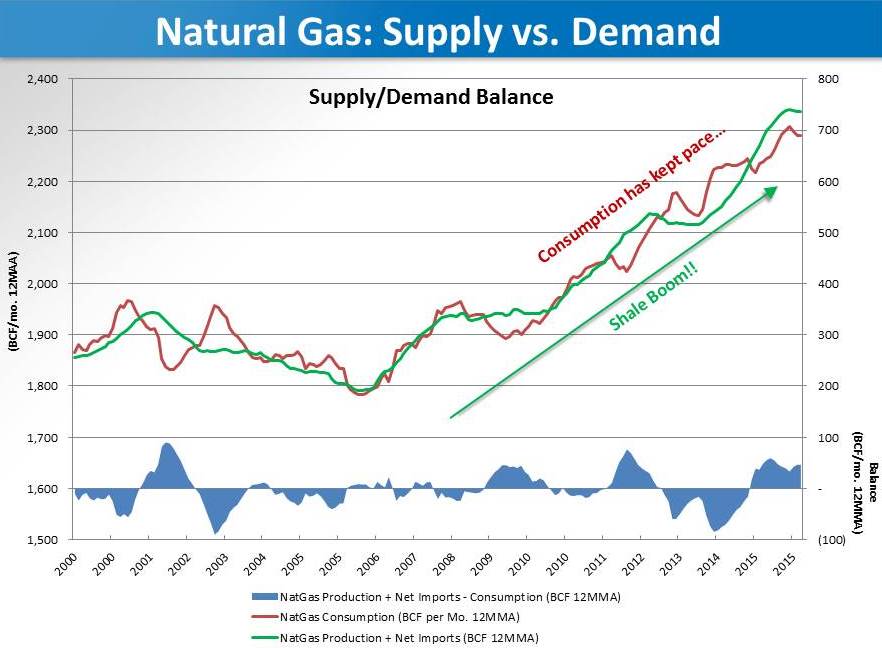
The supply/demand balance is very well correlated to prices and I’ve used the relationship between the two time series to establish a forecast for prices through 2017, refer to the chart below.  As you can see from the chart, the EIA has projected demand to outpace supply for most of 2017 which should lead to higher prices:

ST_forecast

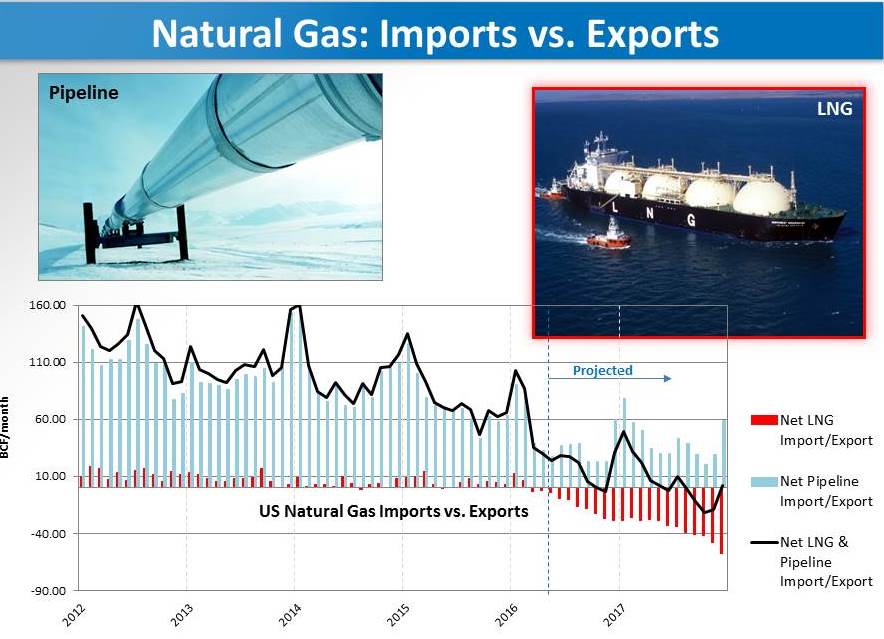
The U.S. is historically a net importer of natural gas from Mexico and Canada however, the situation is changing due to the abundance of production from the shale boom.  The net affect on the natural gas supply/demand balance moving forward will be impacted by increased LNG exports and pipeline exports.  It’s often overlooked that pipeline flows in certain areas have actually reversed.

By the end of 2017, the import/export volumes should be about even; by 2018 the EIA has projected the U.S. to be a net exporter of natural gas, see below:

importexport

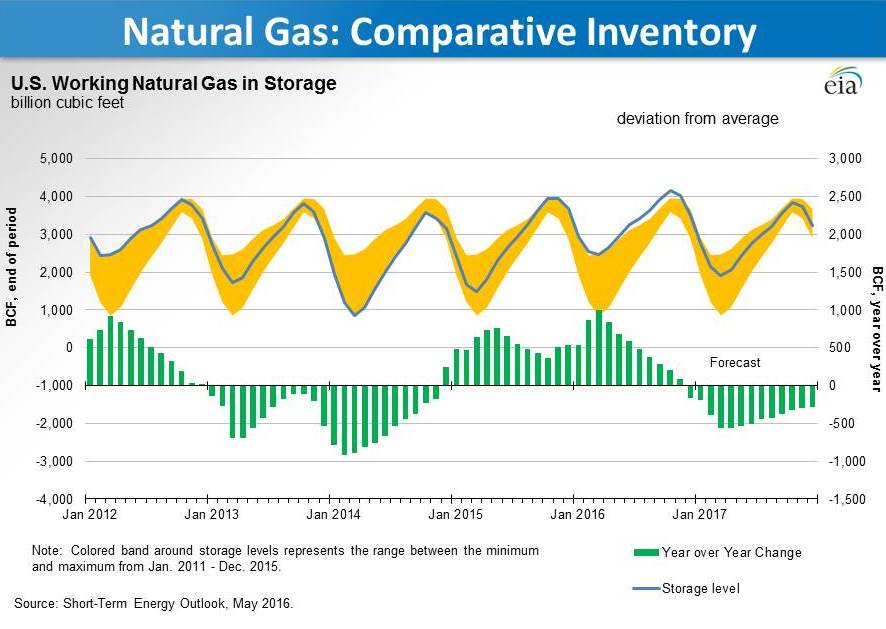
Another way of looking at future natural gas prices is to use the year over year inventory levels.  As you can see from the EIA’s chart below (which I modified), the natural gas inventory levels are drawn down each winter predominately due to home heating usage; once spring comes around the inventories are built back up.  Inventory levels are currently above their 5 year averages due to the very mild 2015-2016 winter. It appears the EIA used an average winter next year and estimated average draws on natural gas storage.

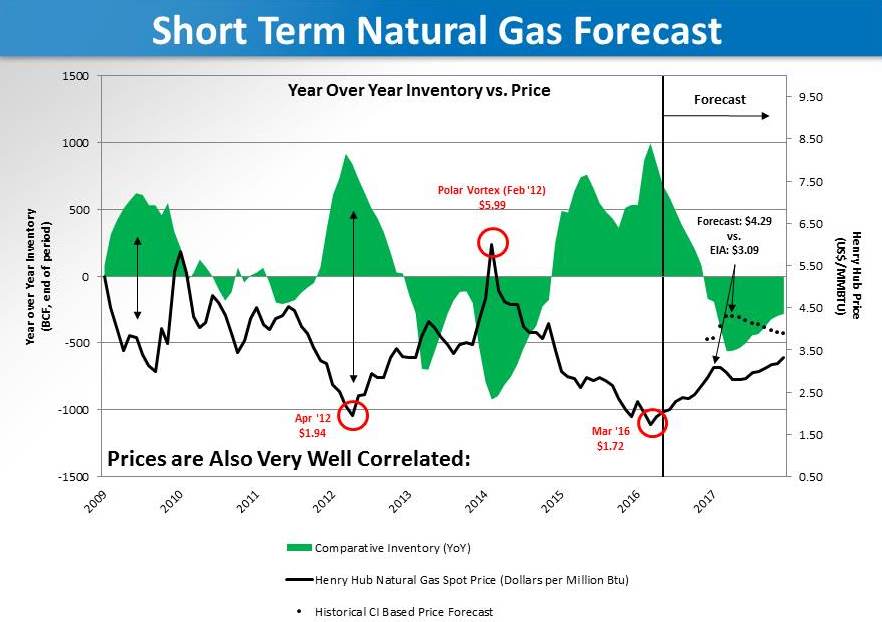
Similar to the supply/demand balance shown above, we can use the year over year inventory levels to project future natural gas prices (albeit with different inputs).   As you can see below, inventory projections suggest prices well above $4 (MMBTU):

inventory

YoY_inventory

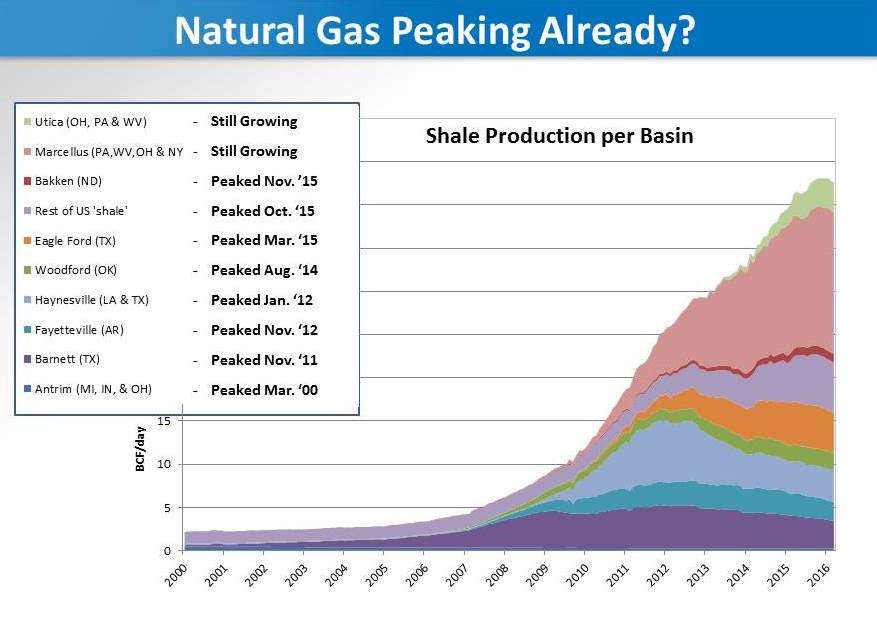
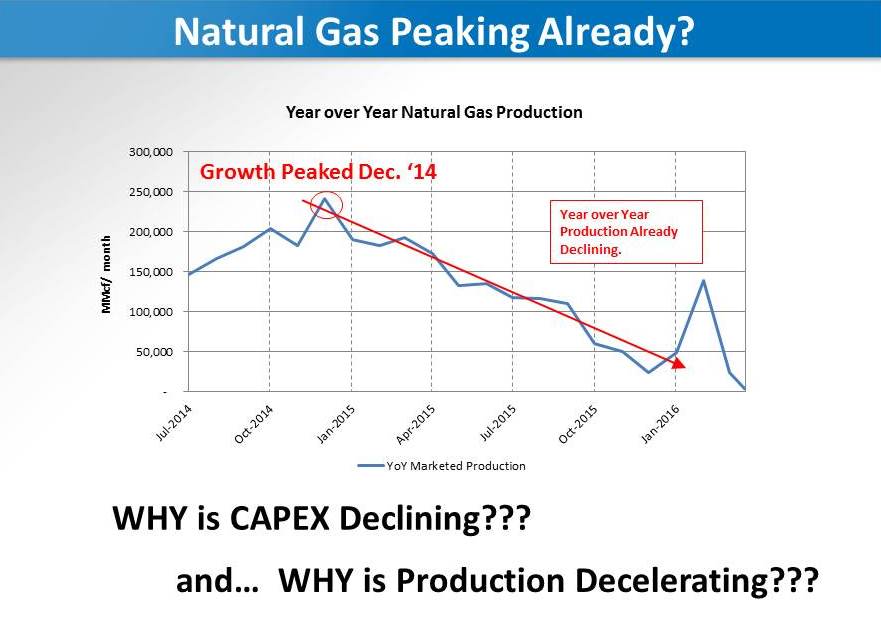
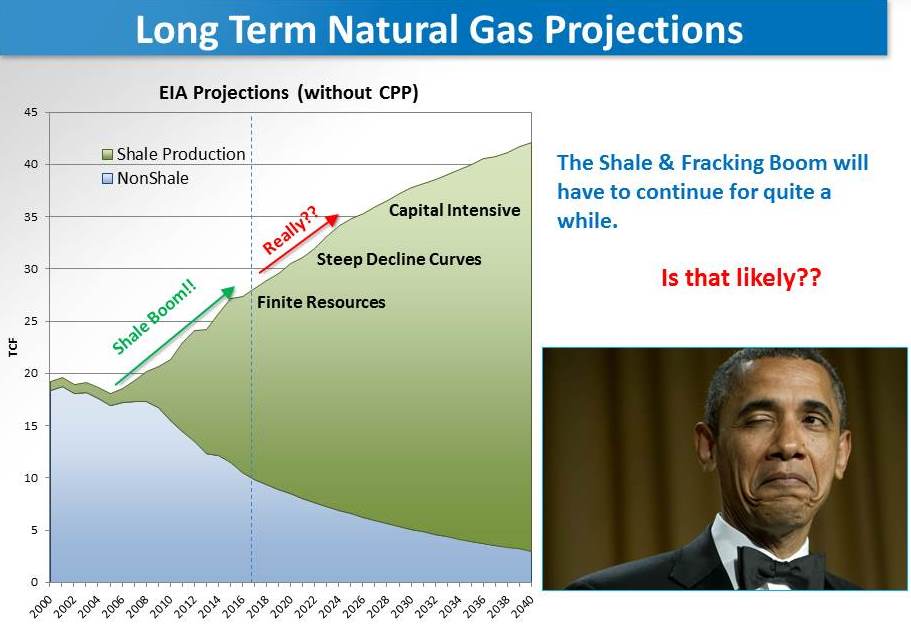
Although the technological advancements in the shale fracking space have led to cost savings, the practice is still very capital intensive.  Steep decline curves result in a hamster wheel effect of spending CAPEX on drilling and stimulating well fields, followed by more spending in order to keep production growing.  Once the CAPEX is cutoff, it’s only a matter of time until production levels decelerate year over year and eventually decline.

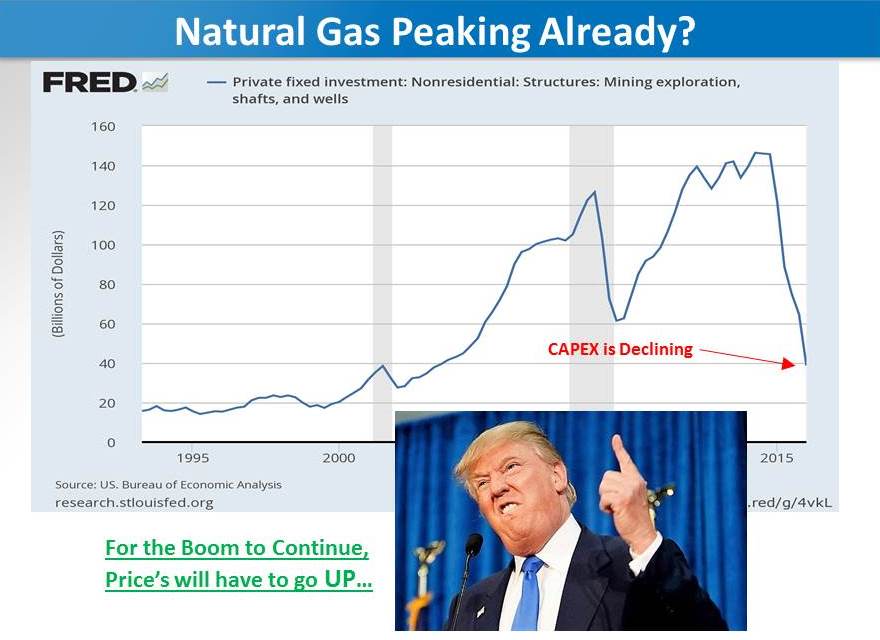
I believe we are currently in the deceleration phase and the natural gas production figures will soon begin to decline.  Most of the shale basins have already witnessed peak production.  I don’t think they are in terminal decline per se, only that additional capital will have to be spent in order for production levels to rebound.  Overall, CAPEX in the energy sector has fallen dramatically and it appears the period of easy money is over.

basins

natgas_CAPEX

YoY_natgas

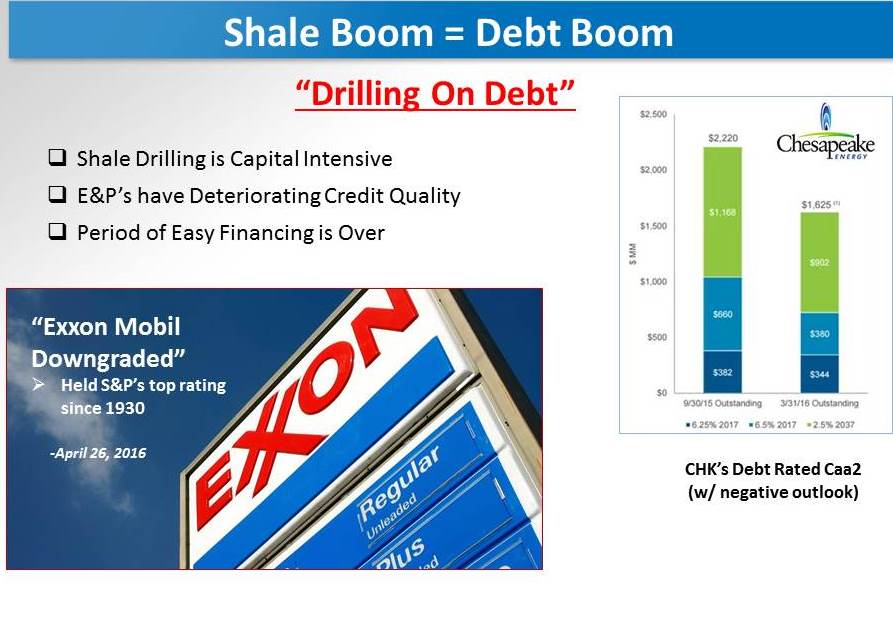
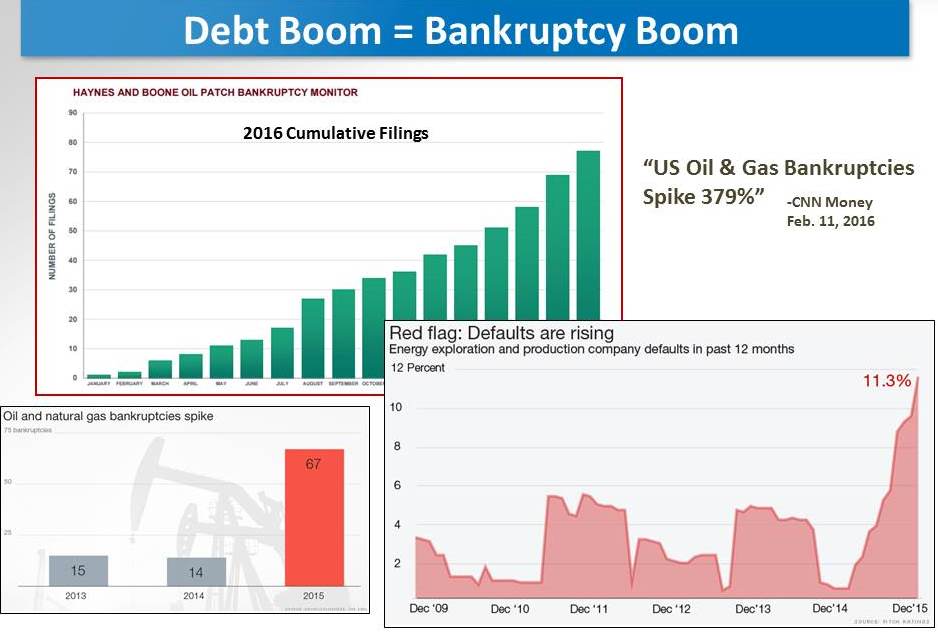
The Shale Boom was built on the back of a Debt Boom.  Easy money from the Fed’s multiple rounds of QE combined with increases in fracking technology led companies to believe a real energy revolution was taking place.  E&P companies levered-up their balance sheets and boom towns were created form south Texas to North Dakota.  This story has played out many times historically… the Debt Boom turns into a Bankruptcy Boom as prices fall dramatically due to oversupplied markets.

Energy companies across the board are seeing debt downgrades and deteriorating credit quality.  The period of easy financing is over.  In order for additional capital to be allocated to new energy investments, prices for these commodities will have to be higher than they are today; ROI’s will demand it.

drillingondebt

bx_boom

As you can see, without additional spending the shale boom may be over.  The problem is, most project continued growth through 2040 with prices below $5 (MMBTU) for the entire period!  I think these estimates are absurd, refer below for the EIA’s natural gas production projections without the Clean Power Plan:

LT_natgas

In summary, the EIA projects prices will rise above $3 per MMBTU sometime next winter.  My own work suggests natural gas prices will reach the $4.00-4.30 range.

Whether in the E&P space or even in the coal sector, there will be opportunities to profit from a rise in natural gas prices.  I will do a follow-up article on potential investments stemming from this idea, so stay tuned.

Please feel free to share your thoughts in the comments below and follow me on Twitter @dyer440.

Comments »

$AAPL Line In The Sand

I’ve been watching Apple Inc. ($AAPL) for a while now, and frankly, hoping for a shortable bounce.  Unfortunately, I was away from the computer all day today (at a conference) and only just now noticed the line in the sand breach by Apple.

See below:

aapl_05122016

This chart technically displays a funky looking head and shoulders pattern with an extra “lower high” as noted above.  There is a very long term trendline rising up all the way back from 2009 that is converging on this area as well.  That trendline will probably attract some value buyers into the stock.  Whether it will be enough to recover the $93 level is yet to be seen.

I believe this is a critical moment for Apple, and for that matter the stock market as a whole.  Since this picture is so well defined I’d suggest using this company as a guidebook for the entire market.

Apple is like this century’s GMas goes GM so goes the nation”.

Bottom line: if $AAPL cannot recover the line in the sand at approx. $93, then I’d surmise that not only is $AAPL heading lower, but the big bull market itself is dead.

I may buy some short term puts on this in the morning although I hate the fact I missed the break earlier today.  Stay tuned and keep your eye on $AAPL as an overall indicator.  Finally, be sure to follow me on Twitter @dyer440.

Comments »

Sweet $XLE Short Setup

Senior Fly has allowed me to grace these hallowed halls once again, and for that I’m grateful.  Last time I was posting on iBankCoin I had one of my most profitable runs ever.  This time around I’d like to do the same, but it’d be a mistake to not have learned a few blogging lessons from the last go ’round.  Therefore I’m going to try to develop a “less talk & more action” approach in an attempt to post more.  The goal is to deliver more actionable trading ideas to the readers without all of them having to fit into some well developed macro puzzle.  Sometimes the big picture is unknown and you simply have to trade what’s in front of you… if you keep your discipline (using stops, money management, etc.) you will eventually catch the big move.  And once that happens you’ll find the big picture becomes clearer and you’re already positioned perfectly.

That being said, there is a sweet short setup developing on $XLE (the SPDRs Select Sector Energy ETF).  Crude Oil has been crushing shorts lately, and that’s all well and good.  The thing is, crude and energy stocks cannot stay correlated forever.  Why?  Because crude is NOT going back to 2014 levels and these energy companies are still in loads of trouble.  It’s simple really, the earnings are terrible and the resulting price/earnings are absurd.

Take Schlumberger ($SLB) for example: only the most dimwitted oil bull would buy this stock today trading at a 45 P/E (ttm)!!  Look at the rig count, these service company workers are all at home twiddling their thumbs (or working on their resumes).  The earnings will only get worse from here…  Fracking – psssh – if E&P’s had that kind of capital they’d probably pay down debt with it.

The bottom line is I believe the divergence is starting to play out.  For example, today Crude Oil futures were up 3.29% whereas the $XLE was up only 0.29% .  It’s time for the energy equities to underperform the commodity.  I think a reversal on the $XLE is forthcoming, and if I’m wrong so be it, but the risk/reward is setting up in the short sellers favor.

So Here’s the Trade:

The $XLE is trying to make a run at it’s recent highs in the 68.80 range; I don’t think it will get there.  Once it’s clear that the rally attempt will fail, enter it short (or buy puts).  Use the 68.80 level or the failed rally high as a stop loss.  Take a look at the chart below:

xle_05112016

I think the failure high will occur somewhere within the orange box.  The target is anywhere in the 57’s (green box) by the end of July.  This represents about a +12% setup; properly placed option bets could easily reward +100%.

Good luck and be sure to follow me on Twitter @dyer440.


Comments »

Monetary Divergence

The primary driver in today’s markets are the various Central Banks and their desperate attempts to stimulate inflation of any kind within their economies.  I believe we can view the markets through the lens of Central Bank policy and the associated market movements, and gain some insight into potential outcomes.  Hopefully this will provide some actionable trading and/or investing setups.

Issue #1: The elephant in the room in the Federal Reserve; they are in a tightening posture and I believe markets are underestimating the number (and possible dates) of future rate hikes.  On the other hand you have the rest of the world’s Central Banks, seemingly dead-set on doing whatever it takes to stimulate their economies.  This is despite the fact that each action becomes less and less effective.

Issue #2: We have the commodity markets, most of which are showing the characteristics of having potentially bottomed.  For example, crude oil is up something like 45% since it’s lows earlier this year.  It could simply be a short covering rally, but every bottom starts out that way.  I’ve said it before (here), in order for the commodity complex to demonstrate a sustained rally, one that perhaps leads to the next up-cycle, the U.S. Dollar needs to pull back against the rest of the worlds currencies.

Given that the above two issues are definitely related, what should we expect moving forward?   Let’s take a look at the currency trigger levels from my previous post:

USDJPY_03092016


Taken by itself, the USD/JPY cross trigger level of 115.50 was a good signal to buy commodities for a bounce; oil bottomed 2 days later.  However, I recommended waiting for the EUR/USD cross to confirm the move, and I suggested using a trigger level of 1.148.  See below:

EURUSD_03092016


To date, it’s not even close.  My recommendation is therefore NOT to play crude oil or any of the other growth (inflation) driven commodity on the long side, at least until both trigger levels are breached.

If the European Central Bank’s bazooka somehow disappoints, this situation could turn on a dime.  However, I think it’s more likely that Central Banks will continue with their current postures: the Fed tightening while everyone else eases.  Furthermore, I believe the U.S. economy is the proverbial last man standing, meaning we are stronger relative to the rest of world.

This is important, it implies that all of the Central Bank posturing is perhaps “correct” on a global scale (i.e. relative to everyone else).  For example, if the U.S. economy is stronger than the rest of the world, perhaps the Fed should be in a tightening posture.  Likewise, if the Japanese (or European) economy is struggling, they probably should be easing.

In summary, I expect the U.S. Dollar to outperform other currencies.  Why?  Because, if the Fed is raising rates and the U.S. economy is outperforming (on a relative basis), the U.S. Dollar will outperform.  Growth commodities should therefore either pull back from current levels or languish into a trading range.  Either way, they do not represent a good risk/reward long at this point in time.

So Here’s the Trade:

Short the banks – the risk is the Fed will guide to further tightening (or even raise rates in March).

Short the EUR/USD – divergent policies will continue and the performance of each economy will also continue to diverge (U.S. > Eurozone).

Short any of the insolvent Oil & Gas companies that are up over 30% in the past two weeks – research their bonds, find the ones that are due soon – these companies are at risk of default.

Follow me on Twitter @dyer440


Comments »

The Generational Trade

Since I had so much positive feedback on The Perfect Pair (which is still working, by the way), I figured I would hand the iBC readers another gem.

This one is a play on demographics and it’s a simple concept that can be summed up like this: the boomers are getting old and finally retiring, whereas the millennials are poor and hate the suburbs.

I’ve been reading a lot of Neil Howe’s work lately and he continues to make the case that healthcare will be 20% of the U.S. economy by 2020.  He made that prediction a decade ago, and we’re right on track.  He’s been getting more press lately and deservedly so – I think his generational research is next-level prediction making.

Anyway, old people have increasing health care costs (obvious); they won’t be moving out to the ‘burbs and into starter homes (obvious); and logic dictates they will likely sell their current McMansions and downsize – probably closer to medical care facilities.

On the other hand, young people have no money and they don’t want a McMansion and a long commute, regardless.  They prefer urban living – right on top of each other – and walking or Uber’ing to and fro, the so called “shared economy”.

So basically I’m selling the suburbs and buying the urban life – as are the Boomers and the Millennials.  Generation X’ers will continue to populate the burbs as their homes eventually wither and decay along with the American middle class.

I’m no financial adviser, but if you’re tired of watching daily stock market gyrations and want one investment idea to lock away a large chunk of your retirement portfolio, this is it…

Here’s the Trade:

Go Long the SPDR Select Sector Health Care ETF – XLV, and

Go Short the SPDR S&P Homebuilders ETF – XHB

This is a paired trade, so use an equal amount of capital on both positions.  By doing this you take the overall market out of the equation.  If the market crashes – who cares, you’re hedged and will likely outperform.  If the market rallies – fantastic, you’ll still outperform.  It’s all about the spread, so let’s take a look at recent performance – because it’s often indicative of future results (did I mention I’m not a financial adviser):

xlv_xhb_correlation

That’s it.  Now, put your entire life savings into this trade – in fact you should borrow for it – move to the beach, take up surfing, yoga, etc.  Whatever you do, simply forget about the stock market; I just removed your exposure to stocks.  Check on this spread annually over the next decade, and send me a Thank You! card every once in a while.

You’re Welcome.

@dyer440

Comments »

Railroads

I’m going to keep this short & sweet because we are all busy people.

We’ve tagged one of my counter trend targets (on the Russell 2000) and the downtrend is setup to at least test the lows.  If I’m wrong, stop levels are addressed in the trade described below; risk reward is in your favor.  I think it may be hunting season.

Tomorrow should confirm, see below:

RUT-X_02232016


So Here’s the Trade:

Short Union Pacific Corp ($UNP) and/or Kansas City Southern ($KSU).

Use their respective (approx.) highs as stop loss levels: $82.50 & $85.00.

Use their mid-January lows as price targets.

UNP_02232016

KSU_02232016


Follow me on Twitter @dyer440

Comments »

The Hunter

Dear Trading Diary,

You don’t have to be in the market all the time!  You’re not managing millions, much less billions of dollars.  Stop using large portfolio management strategies.  Small size offers you nimbleness, and THAT is your edge.

All trading ideas are not created equally.  Leverage the hell out of the high conviction ideas and simply dip your toes into the low conviction ideas; allow your confidence and position size to grow when your thesis begins to play out.

Learn to sit on the edge of the forest whilst overlooking the hunting grounds.  Wait for the moment when your high conviction setup whispers softly in your ear, “take me”, then ATTACK.  Chase the majestic metaphorical gazelle down and when you bite down into her flesh, go for the kill because being a bloodthirsty beast is in your nature.

Notice however, those sweet moments when you’re feasting on your prize, and your account magically swells in an almost alarming manner.  Notice those blissful moments when you become shocked by the amount of leverage in your positions, more so now that they’ve multiplied in size – since all your trades are working…

Those are the moments to take your prize out of the field, for other hunters are on the prowl and buzzards are now circling overhead.  Cash out in those extreme moments. Get used to your new account size.  Take a day (or week, or month) off while you regroup, rest your mind, reload, and get ready to hunt again.

Happy hunting,

@dyer440

Comments »