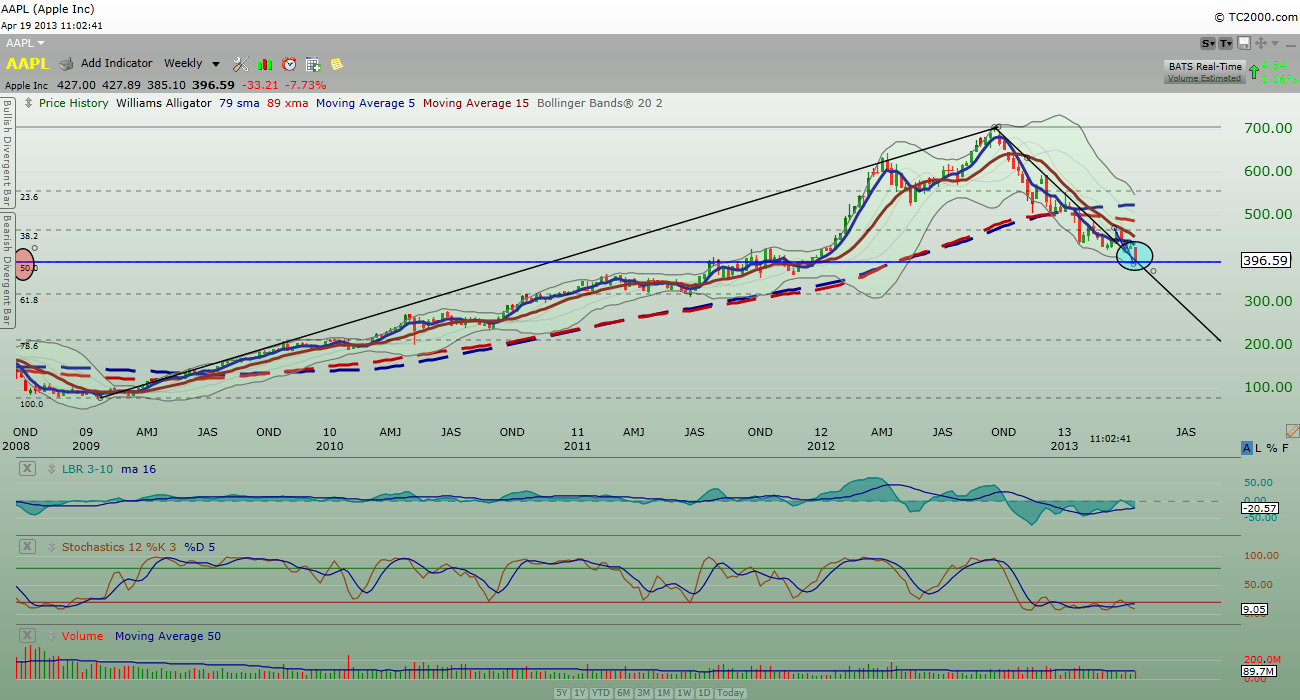
Reason number 1: We are at 50% retracement from the low of Jan 2009 and the high of Sep 2012. See the blue horizontal line below in the $AAPL weekly chart.
Reason number 2: The length of the drop from the high of 03/25 to the low of 04/5 is equal to the length of the drop from the high of 4/11 to the low of 4/19 (today). See the blue zig-zag line.
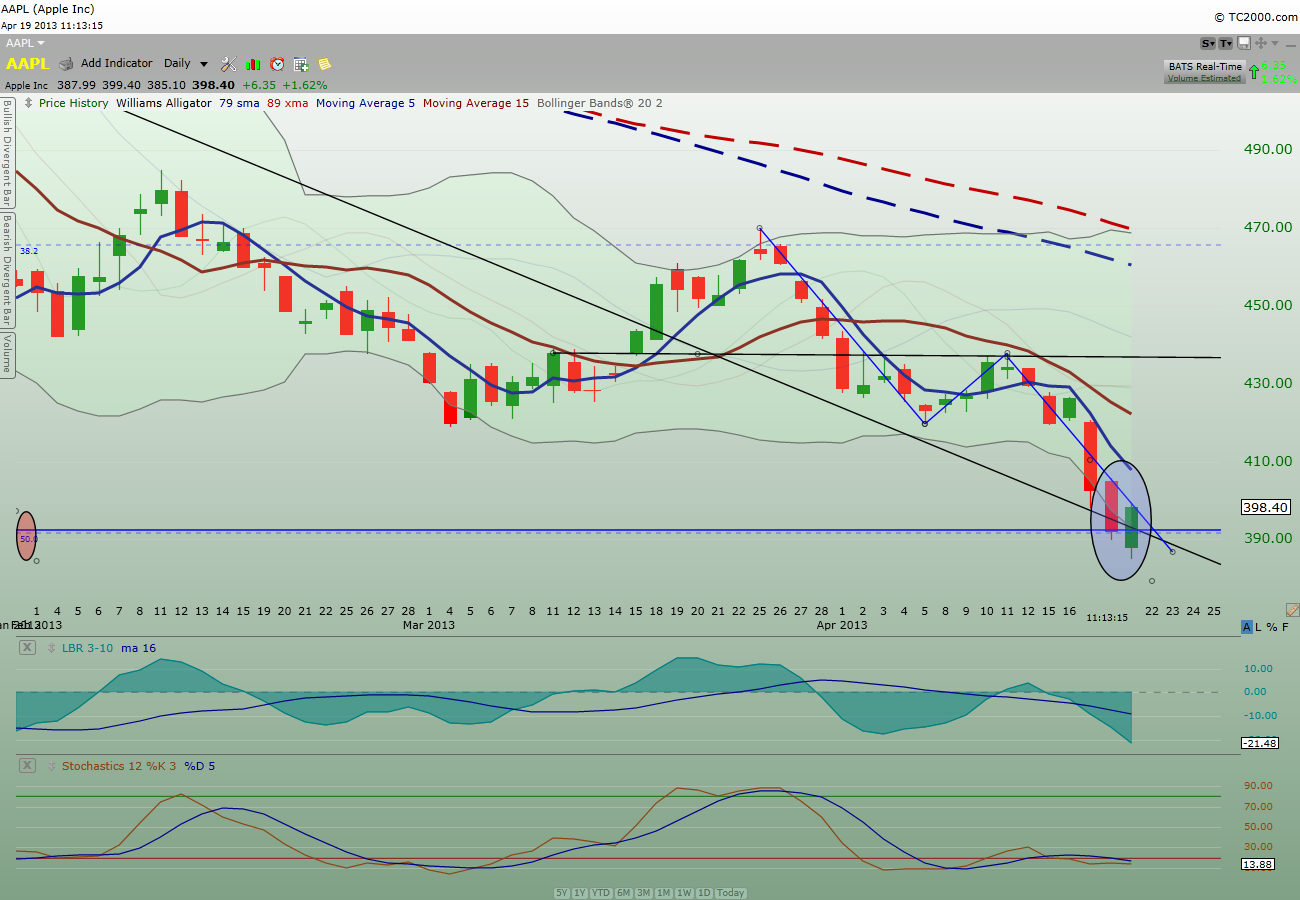
Reason number 3: We have a bullish piercing candlestick pattern in development today. See the two candlesticks inside the circle.
Below is the primer for bullish piercing candlestick pattern:
The piercing pattern is made up of two candlesticks, the first black and the second white. Both candlesticks should have fairly large bodies and the shadows are usually, but not necessarily, small or nonexistent. The white candlestick must open below the previous close and close above the midpoint of the black candlestick’s body. A close below the midpoint might qualify as a reversal, but would not be considered as bullish.
Just as with the bullish engulfing pattern, selling pressure forces the security to open below the previous close, indicating that sellers still have the upper hand on the open. However, buyers step in after the open to push the security higher and it closes above the midpoint of the previous black candlestick’s body. Further strength is required to provide bullish confirmation of this reversal pattern.
 Candlestick Piercing Pattern example chart from StockCharts.com")
In late March and early April 2000, Ciena (CIEN) declined from above 80 to around 40. The stock first touched 40 in early April with a long lower shadow. After a bounce, the stock tested support around 40 again in mid April and formed a piercing pattern. The piercing pattern was confirmed the very next day with a strong advance above 50. Even though there was a setback after confirmation, the stock remained above support and advanced above 70. Also notice the morning doji star in late May.
And for these three reasons, I’m comfortable to buy some $AAPL this morning.
My 2 cents.
Comments »


 Candlestick Harami example chart from StockCharts.com")
![[Muse]](http://stockcharts.com/images/minilink_sc.gif)