iBankCoin
Home / Bearish Candlestick Pattern

Bearish Candlestick Pattern

Hanging Man bearish confirmation alert!

It is my duty to inform you that today $SPY price action constitutes a confirmation of yesterday bearish hanging man candlestick pattern.

Take a look at the daily chart below.  Yesterday price action tried but could not take out the high of 04/11/2013 and a hanging man candlestick pattern was formed.  Today down day confirms the bearish sentimental.  Be wary of further downtrend this week.

SPY_Daily

Below is the primer on Hanging Man candlestick pattern:

hanging man candlestick pattern is a sign of potential reversal

Be safe!

My 2 cents.

Comments »

Is this Spinning Top going to fall?

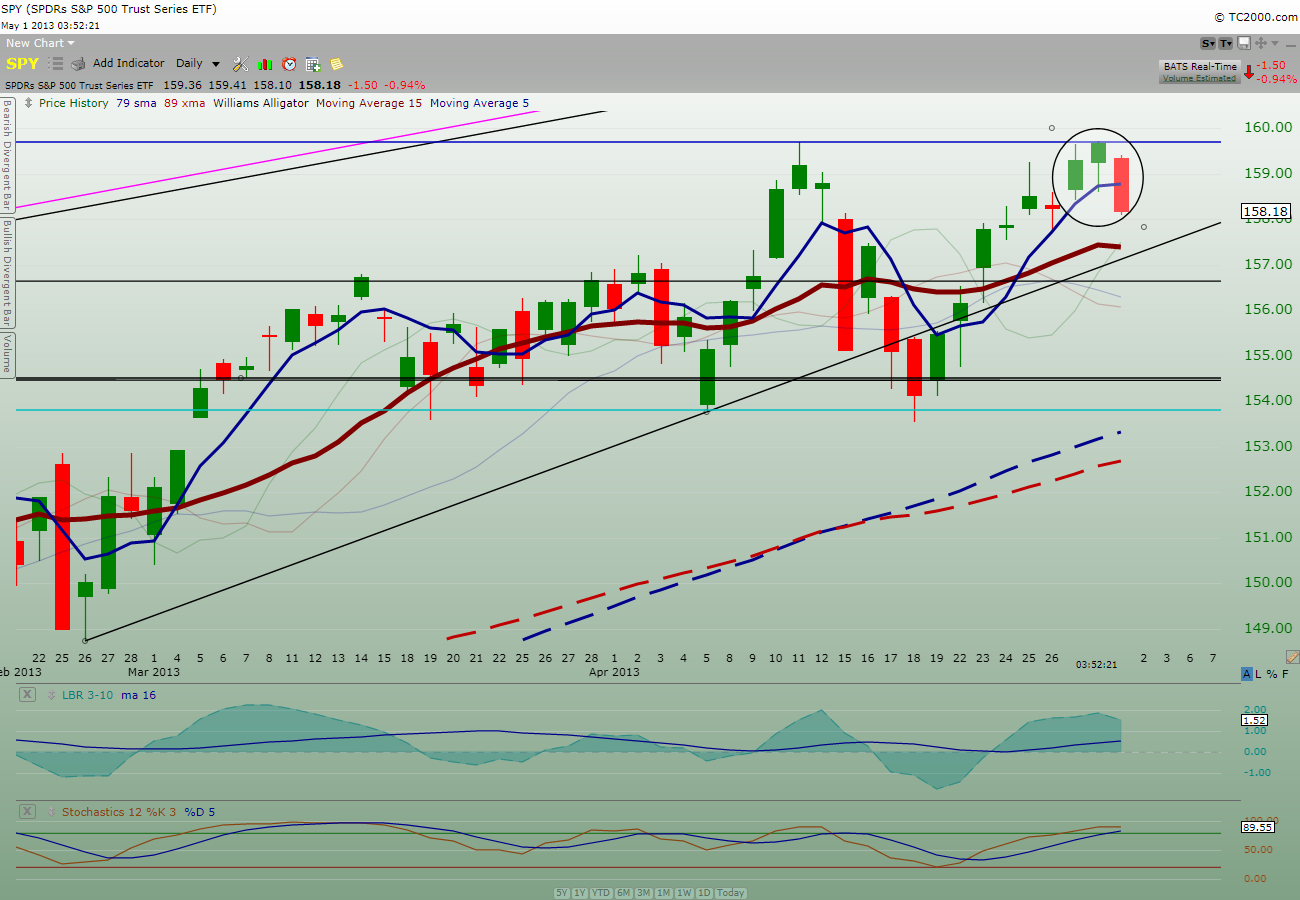
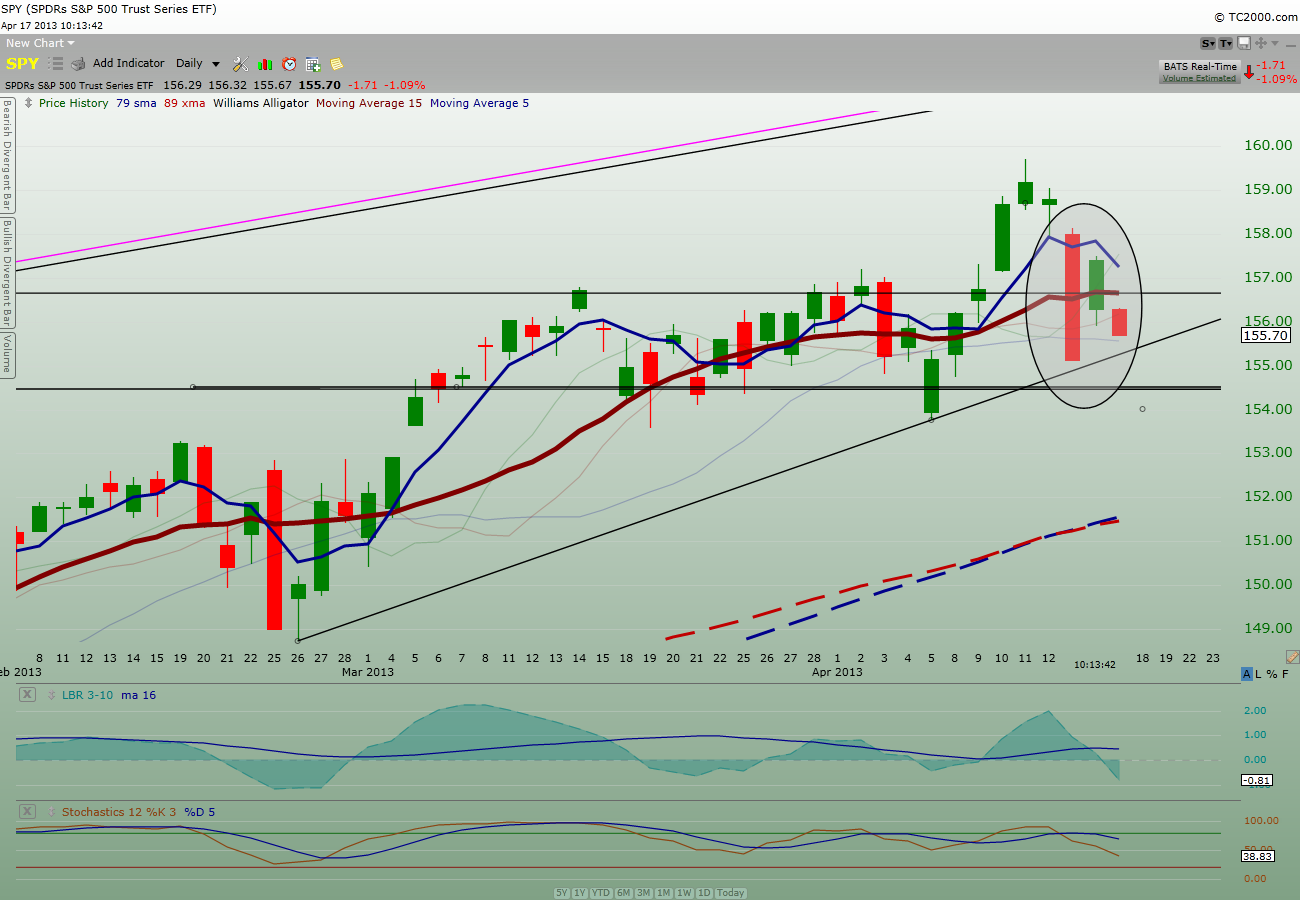
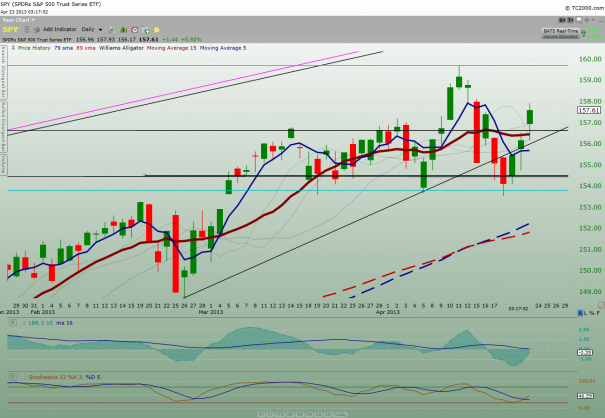
Today $SPY rally continues on and price action is now above the 2007 high once again.  On top of that, price action is now back over the up trendline that has started from 02/26 low.  However, I like to see price action takes out the previous high of 04/11 to be considered a full-on bull trend.

Take a look at the $SPY daily chart below:

SPY_Daily

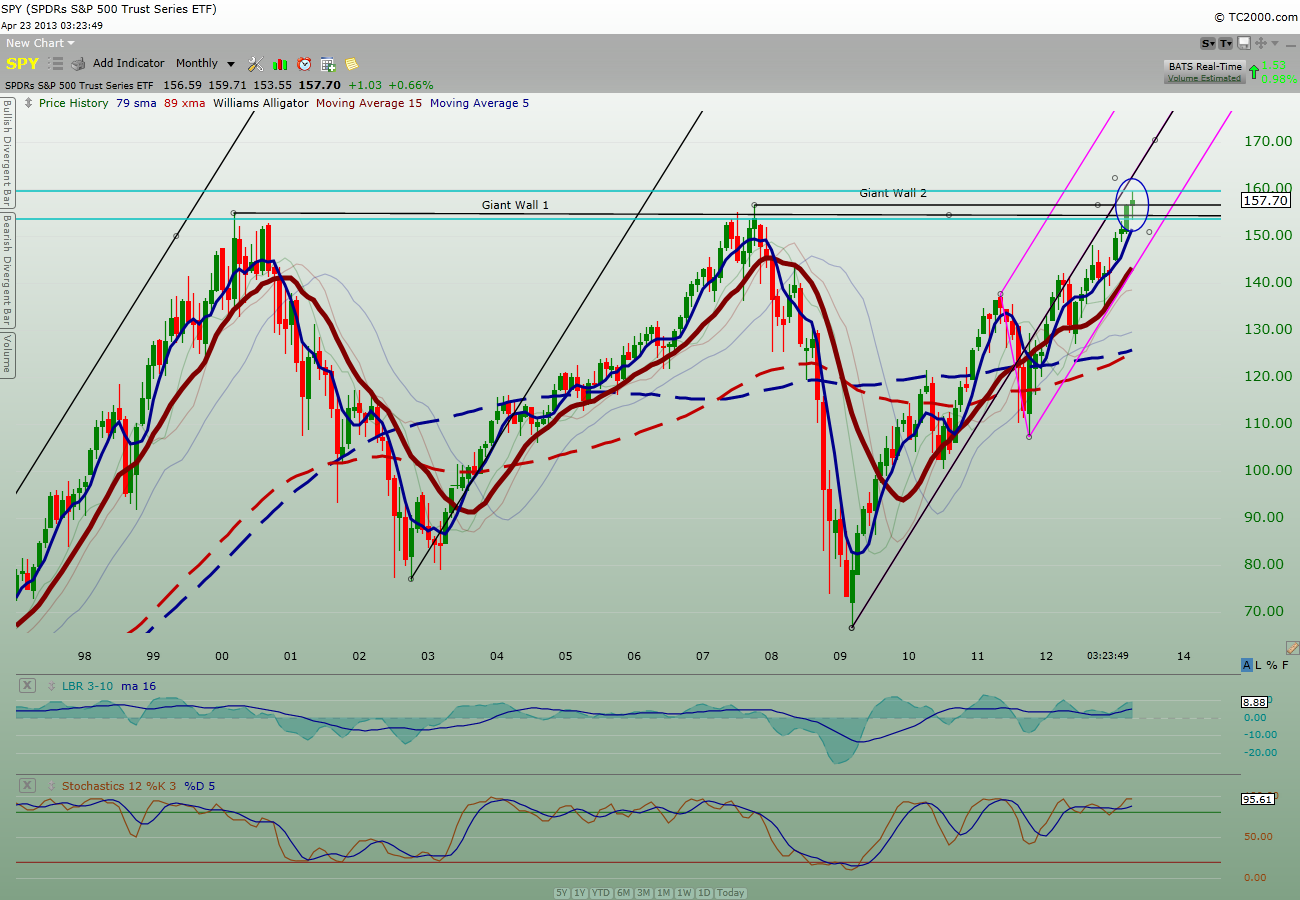
Now take a look at the monthly $SPY chart again below:

SPY_monthly

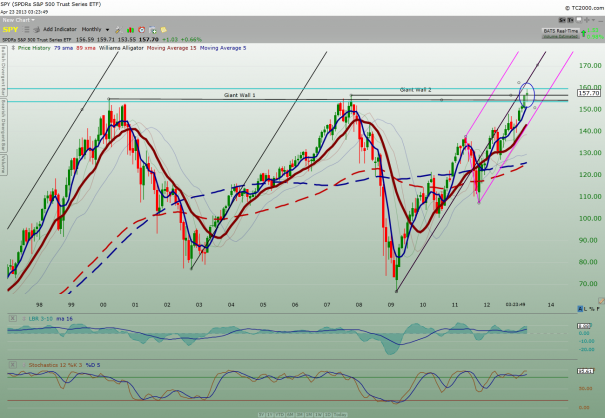
Did you see the forming of a spinning top candlestick for the month of April?

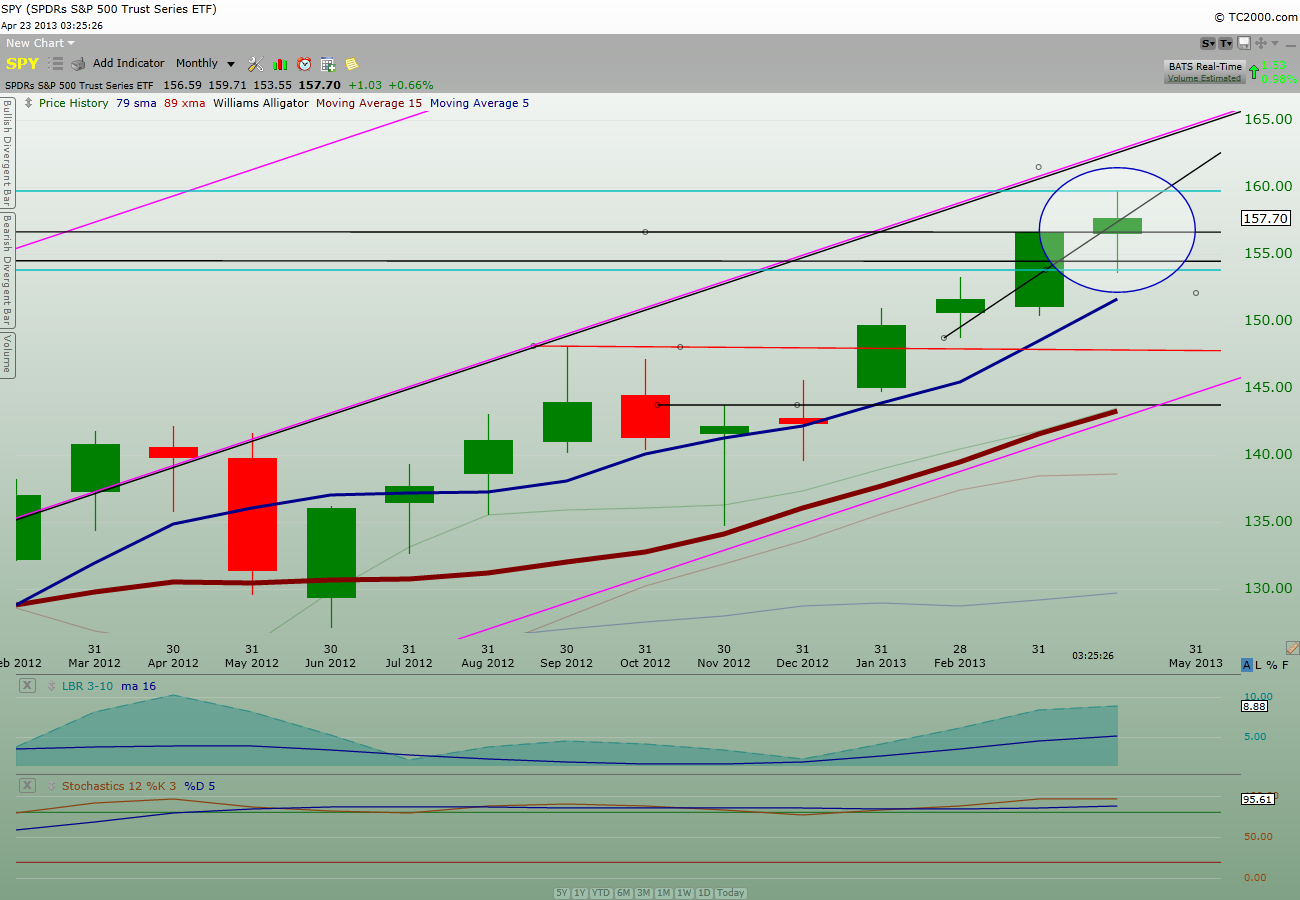
Let’s take a closer look.

SPY_monthly2

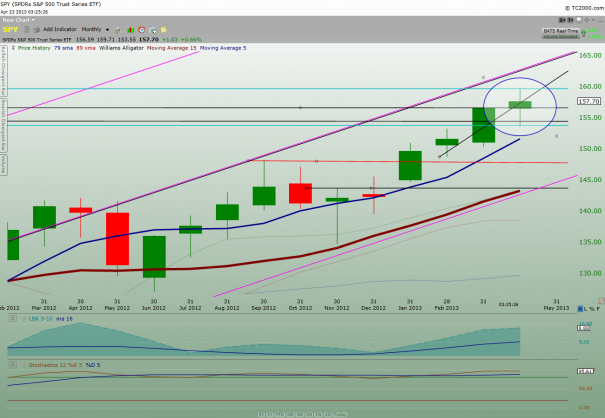
A spinning top at or near critical historical resistance such as 2007 high can be a significant tell-tale sign.  I will be more cautious going forward from here in light of May being the month of patterned down month.

Below is the primer for Spinning top candlestick pattern:

Definition of ‘Spinning Top’

A type of candlestick formation where the real body is small despite a wide range of price movement throughout the trading day. This candle is often regarded as neutral and used to signal indecision about the future direction of the underlying asset.

Investopedia explains ‘Spinning Top’

If a spinning top formation is found after a prolonged uptrend, it suggests that the bulls are losing interest in the stock and that a reversal may be in the cards. On the other hand, if this formation is found in an defined downtrend, it suggests that the sellers are losing conviction and that a bottom may be forming.

Cautiously optimistic is the way to perceive current rally.

My 2 cents.

Comments »

Three Inside Down = Play Defense

Today confirms that yesterday Bullish Harami is not so bullish after all; instead today is a day to play defense.  The Three Inside Down is a candlestick pattern that points to a possible bearish stance.

Take a look at the daily $SPY chart below:

SPY_Daily

Now take a look at the primer on Three Inside Down below:

Bearish Three Inside Down Pattern


BEARISH THREE INSIDE DOWN

Type: Reversal
Relevance: Bearish
Prior Trend: Bullish
Reliability: High
Confirmation: Suggested
No. of Sticks: 3


Definition:             Get the highest rated stock from Americanbulls for this pattern >>>The Bearish Three Inside Down Pattern is another name for the Confirmed Bearish Harami Pattern. The third day confirms the bearish trend reversal.Recognition Criteria:1. Market is characterized by uptrend.
2. We see a Bearish Harami Pattern in the first two days.
3. We then see a black candlestick on the third day with a lower close than the second day.
Explanation:The first two days of this three-day pattern is a Bearish Harami Pattern, and the third day confirms the reversal suggested by Bearish Harami Pattern since it is a black candlestick closing with a new low for the three days.Important Factors:The reliability of this pattern is very high, but still a confirmation in the form of a black candlestick with a lower close or a gap-down is suggested.

***

At this point, a more cautious and defensive stance is warranted for those who are heavily long.

I’m currently sitting on 47% cash.

Be safe!

My 2 cents.

Comments »