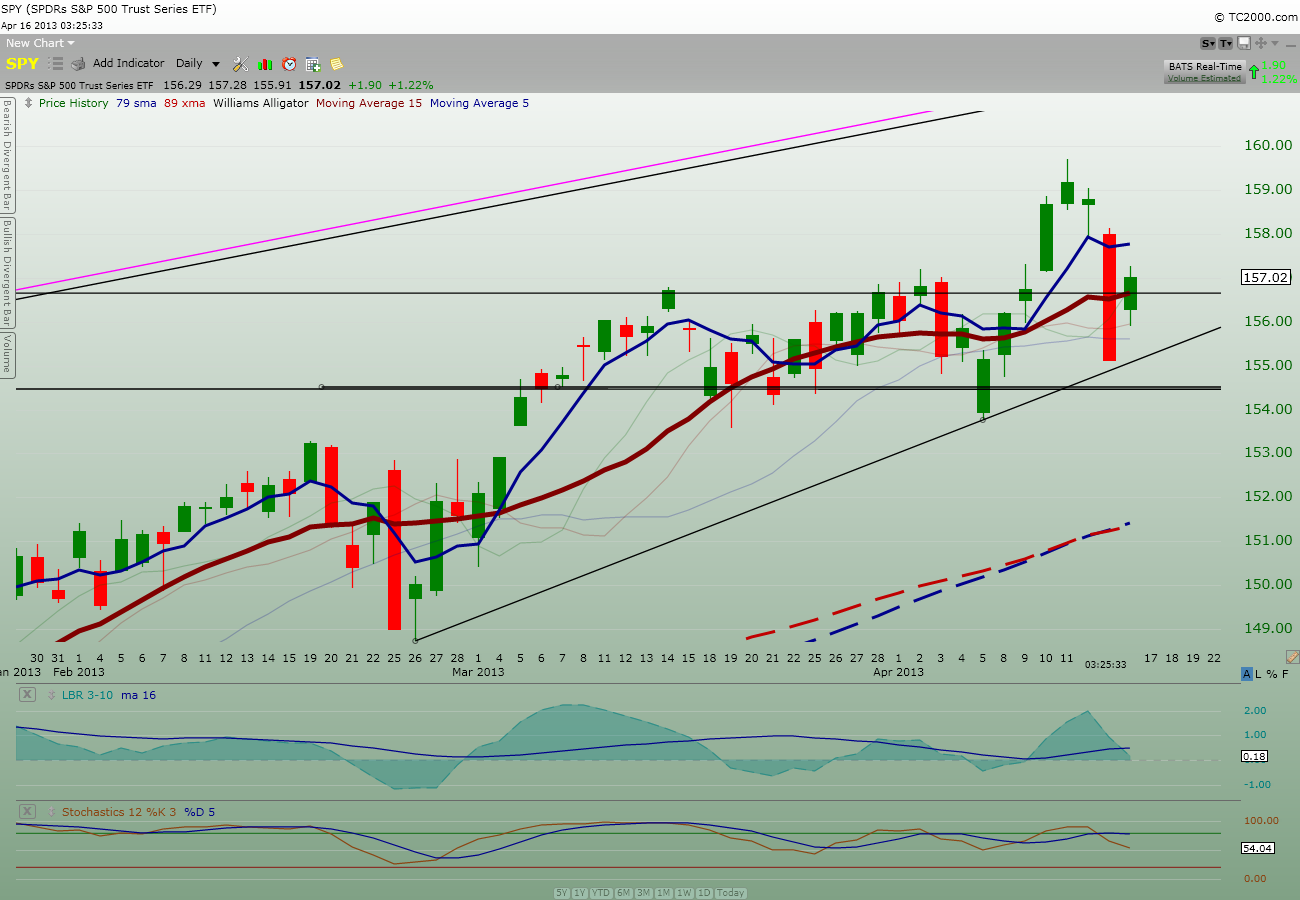
We have a really nice Bullish Harami under development in the daily $SPY chart. And the nice thing about this is that the price action is now on top of the 2007 support.
Take a look at the chart below:
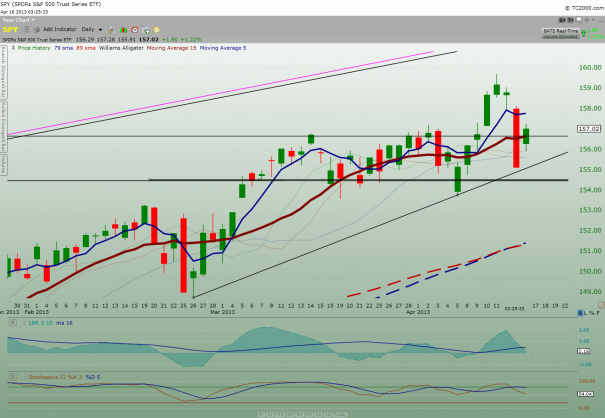
Did you notice that despite yesterday big down day, it hasn’t penetrated the up trendline on the chart.
Although market is up $126 point right now, I’m sensing quietness and calmness. Thus, I haven’t been active at all today.
Below is some primer on Bullish Harami:
Source: click here
Bullish Harami
The bullish harami is made up of two candlesticks. The first has a large body and the second a small body that is totally encompassed by the first. There are four possible combinations: white/white, white/black, black/white and black/black. Whether they are bullish reversal or bearish reversal patterns, all harami look the same. Their bullish or bearish nature depends on the preceding trend. Harami are considered potential bullish reversals after a decline and potential bearish reversals after an advance. No matter what the color of the first candlestick, the smaller the body of the second candlestick is, the more likely the reversal. If the small candlestick is a doji, the chances of a reversal increase.

In his book Beyond Candlesticks, Steve Nison asserts that any combination of colors can form a harami, but that the most bullish are those that form with a white/black or white/white combination. Because the first candlestick has a large body, it implies that the bullish reversal pattern would be stronger if this body were white. The long white candlestick shows a sudden and sustained resurgence of buying pressure. The small candlestick afterwards indicates consolidation. White/white and white/black bullish harami are likely to occur less often than black/black or black/white.
After a decline, a black/black or black/white combination can still be regarded as a bullish harami. The first long black candlestick signals that significant selling pressure remains and could indicate capitulation. The small candlestick immediately following forms with a gap up on the open, indicating a sudden increase in buying pressure and potential reversal.
 Candlestick Harami example chart from StockCharts.com")
Micromuse (MUSE)![[Muse]](http://stockcharts.com/images/minilink_sc.gif) declined to the mid sixties in Apr-00 and began to trade in a range bound by 33 and 50 over the next few weeks. After a 6-day decline back to support in late May, a bullish harami (red oval) formed. The first day formed a long white candlestick, and the second a small black candlestick that could be classified as a doji. The next day’s advance provided bullish confirmation and the stock subsequently rose to around 75.
declined to the mid sixties in Apr-00 and began to trade in a range bound by 33 and 50 over the next few weeks. After a 6-day decline back to support in late May, a bullish harami (red oval) formed. The first day formed a long white candlestick, and the second a small black candlestick that could be classified as a doji. The next day’s advance provided bullish confirmation and the stock subsequently rose to around 75.
====================
My 2 cents
Comments »