Nasdaq futures are surprisingly firm despite bad economic news out of Europe overnight. Perhaps taking a page from the QE playbook in the United States, index futures rallied overnight on weaker-than-expected CPI , Employment Change, and Retail Sales to name a few. Volume and range are running at a normal clip unlike yesterday and prices are currently set to gap up and out of yesterday’s range. On today’s docket we have Chicago Purchasing Manager index at 9:45 and Consumer Confidence at 10:00. Fed’s Powell is set to speak at 10:45 but is likely to be a low impact event. After hours we have China Manufacturing PMI numbers.
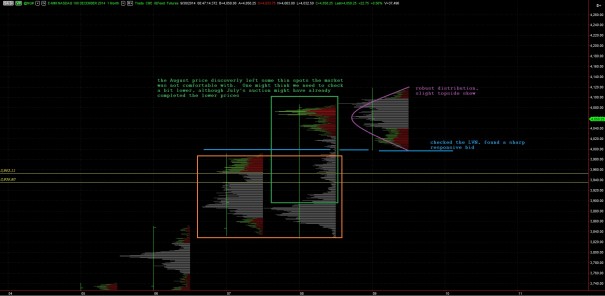
Yesterday we looked at the weekly candle chart and observed how the long term remains buyer controlled as we thoroughly auction an old gap zone. Today let’s look at the monthly volume profile chart which shows an interesting structure on the month. We tested lower to the lowest volume point on last month’s chart and sharply rejected away. The overall structure of this month is a robust distribution of acceptance. If we are to move higher from there, there would be a sold structure beneath us:
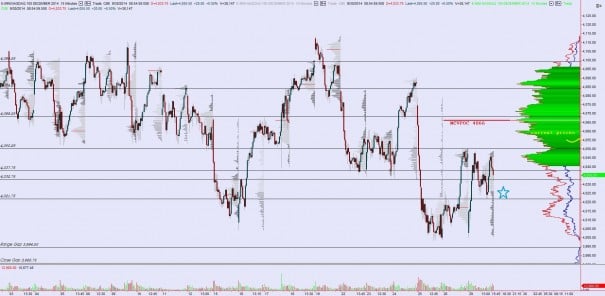
Even though we are questioning the longevity of intermediate term balance, it remains in place as we enter today’s trade. For sellers to hold onto their edge inside this balance, we likely need to see prices roll over and take out yesterday’s intraday higher low at 4021.75. This move would be the first step toward accomplishing a lower-lower trend continuation. A range and price gap still remains below which might entice the move. There MCVPOC is just above current prices at 4066. This liquidity is likely to act like a magnet as we trade nearby. I have noted these observations as well as key LVNs below:
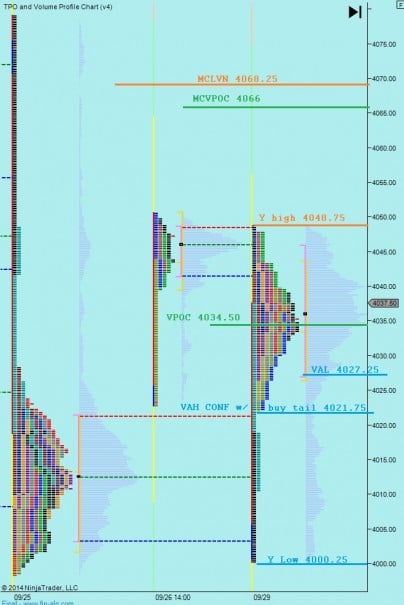
Finally, I have noted the key short term levels I will be observing below:
Comments »
