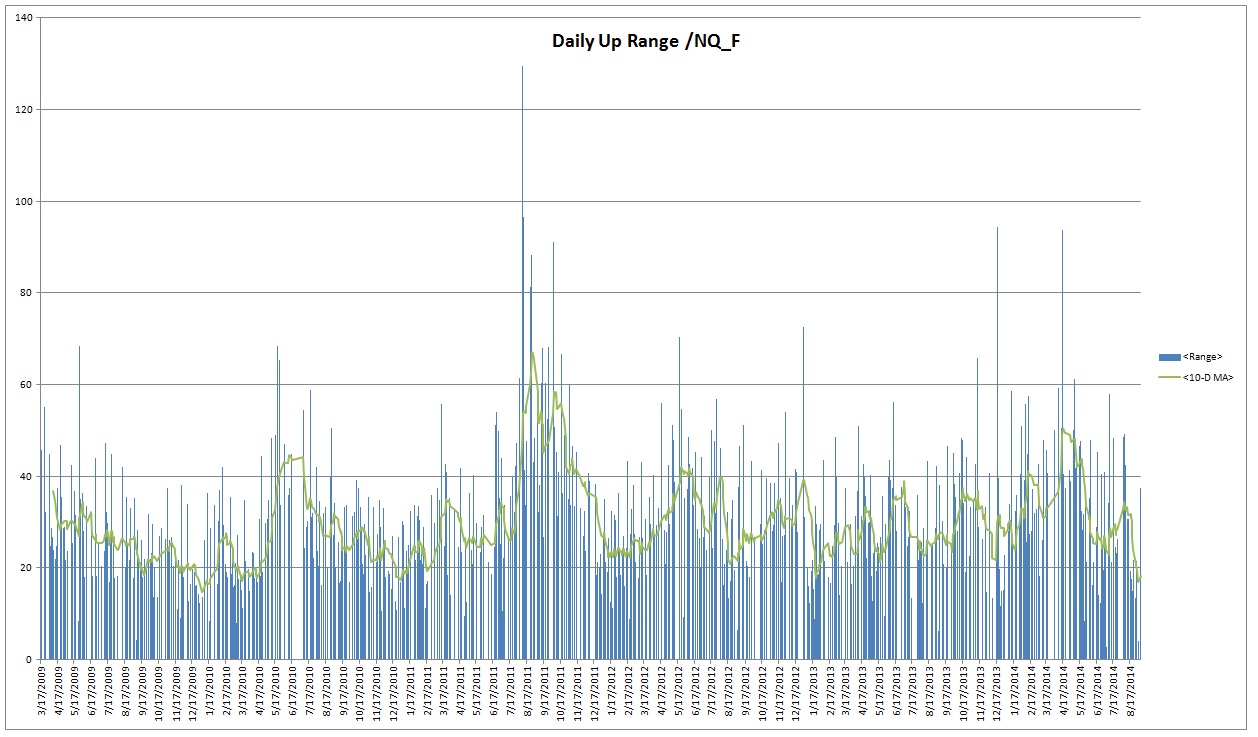
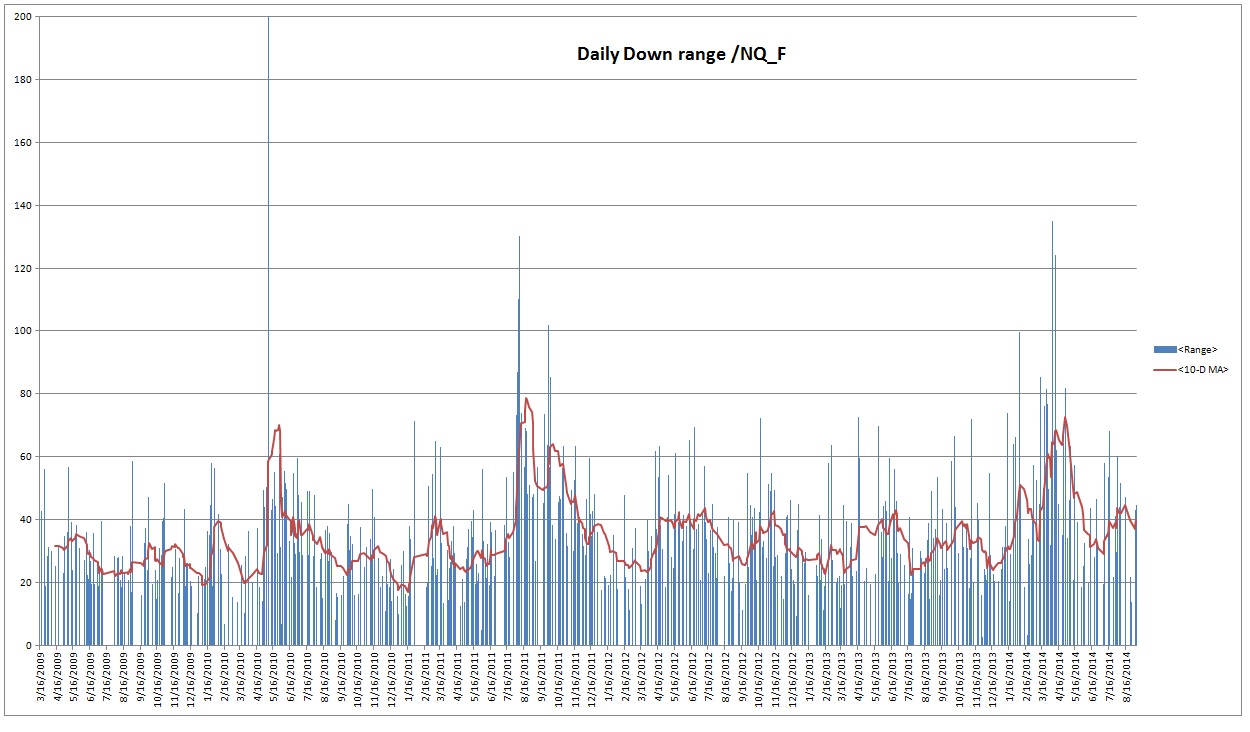
Today we are looking at the range statistics of the Nasdaq regular trading session. Although Nasdaq futures trade around the clock on globex, our focus is primarily to trade the index when the equities underlying its value are also active. Thus, this range analysis is conducted using the trading hours from 9:30-16:15 eastern time. This data was pulled from the IQ feed servers and compiled using about five years of trade (3/16/2009 start date).
The data has been split into two categories, up days and down days. This information is helpful when preparing your hypothesis on the day because you have a sense of what price levels are relevant and actionable, and which ones are beyond the average reach of the marketplace.
Some notable stats include:
- Average down day range: 35 points
- Average up day range: 29 points
- 2014 Average down day range: 45.5 points
- 2014 Average up day range: 32.5 points
Usually I will use a histogram to calculate a “normal” range, considering about 68% of occurrences as normal and anything else an outlier. What appears to more relevant in this instance is to look at the data over time to see how ranges are trending. I applied a 10-day moving average to the daily up and down ranges. The average daily up range is at about a 5-year low at just under 20 points. The average daily down range is just less than 40 points. Thus recent trading has provided about double the daily range when trading lower than higher. See below:


Do you see this as a warning sign that we are close to a top, or at least a trend reversal to the downside?
This? No. My only use for this data is in preparing hypotheses and knowing what nearby prices levels are relevant to current trade. It is also useful for tempering expectations (shorting into the hole or top ticking) and also knowing when a day is behaving out of the norm.
The hypothesis I draw from the data set provided is that of “time symmetry”. Valid or not, that is my observation.