iBankCoin
Home / Tag Archives: $NDX (page 16)

Tag Archives: $NDX

Gap Lower Out of Range

Nasdaq futures are down on heavy volume overnight.  As we approach US cash trade prices are trading below yesterday’s range.  Prices were soft overnight and accelerated at 8:30am when Advanced Retail Sales and Empire Manufacturing came in lower than expected.  We also have Business Inventories at 10am and Fed’s Beige Book at 2pm.

Whenever the market gaps outside of the prior day range we know with certainty we are out of balance on the short timeframe.   Overnight participants have rejected yesterday’s range and once the stocks which comprise the index begin trading the new development needs to be priced into the market.

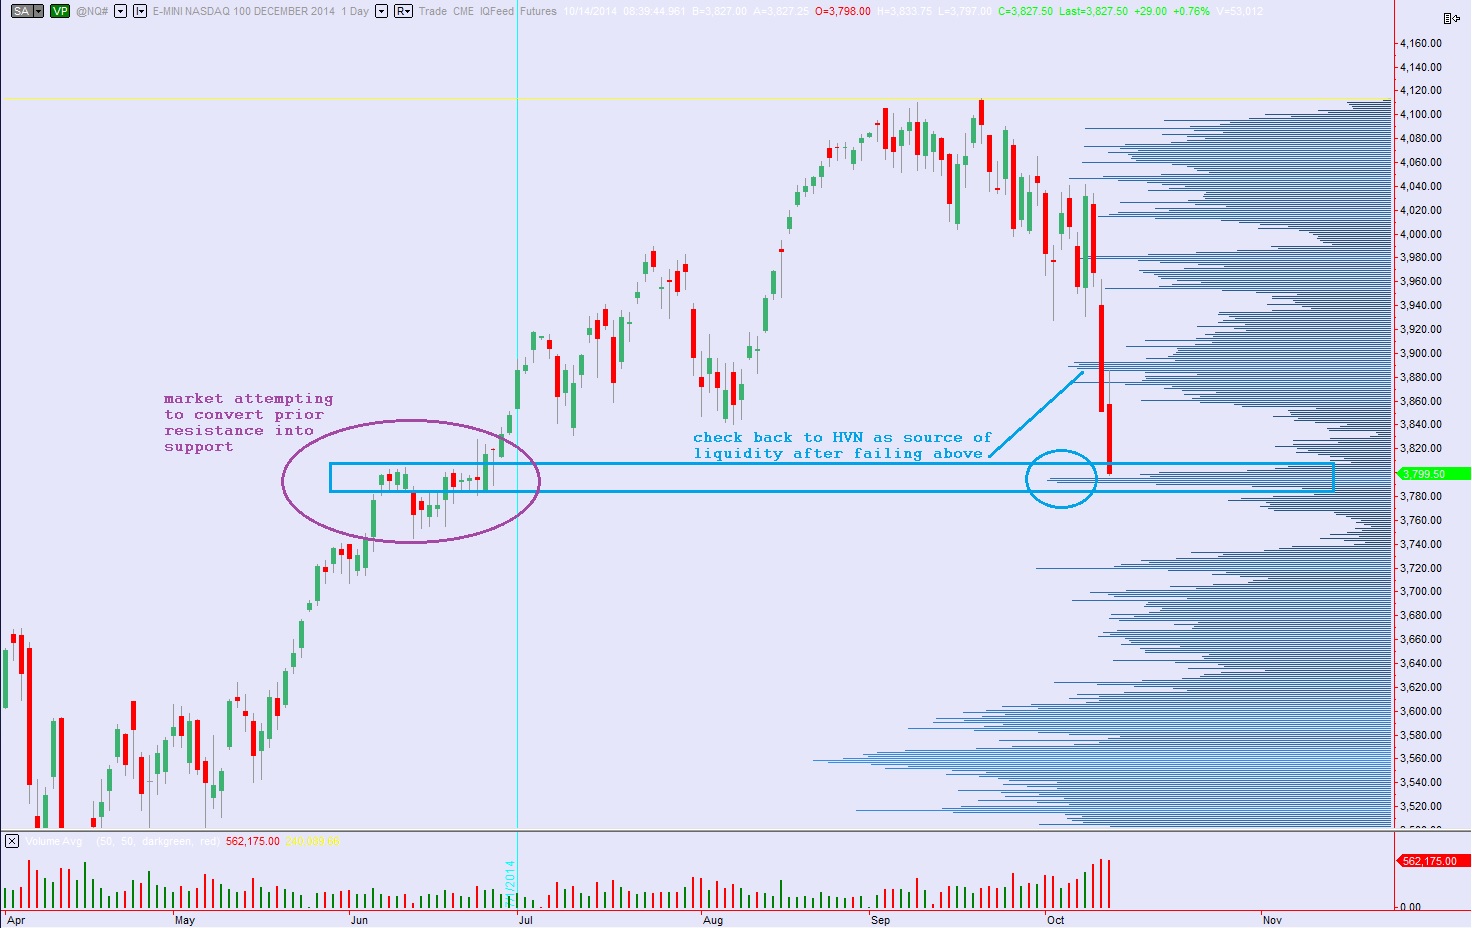
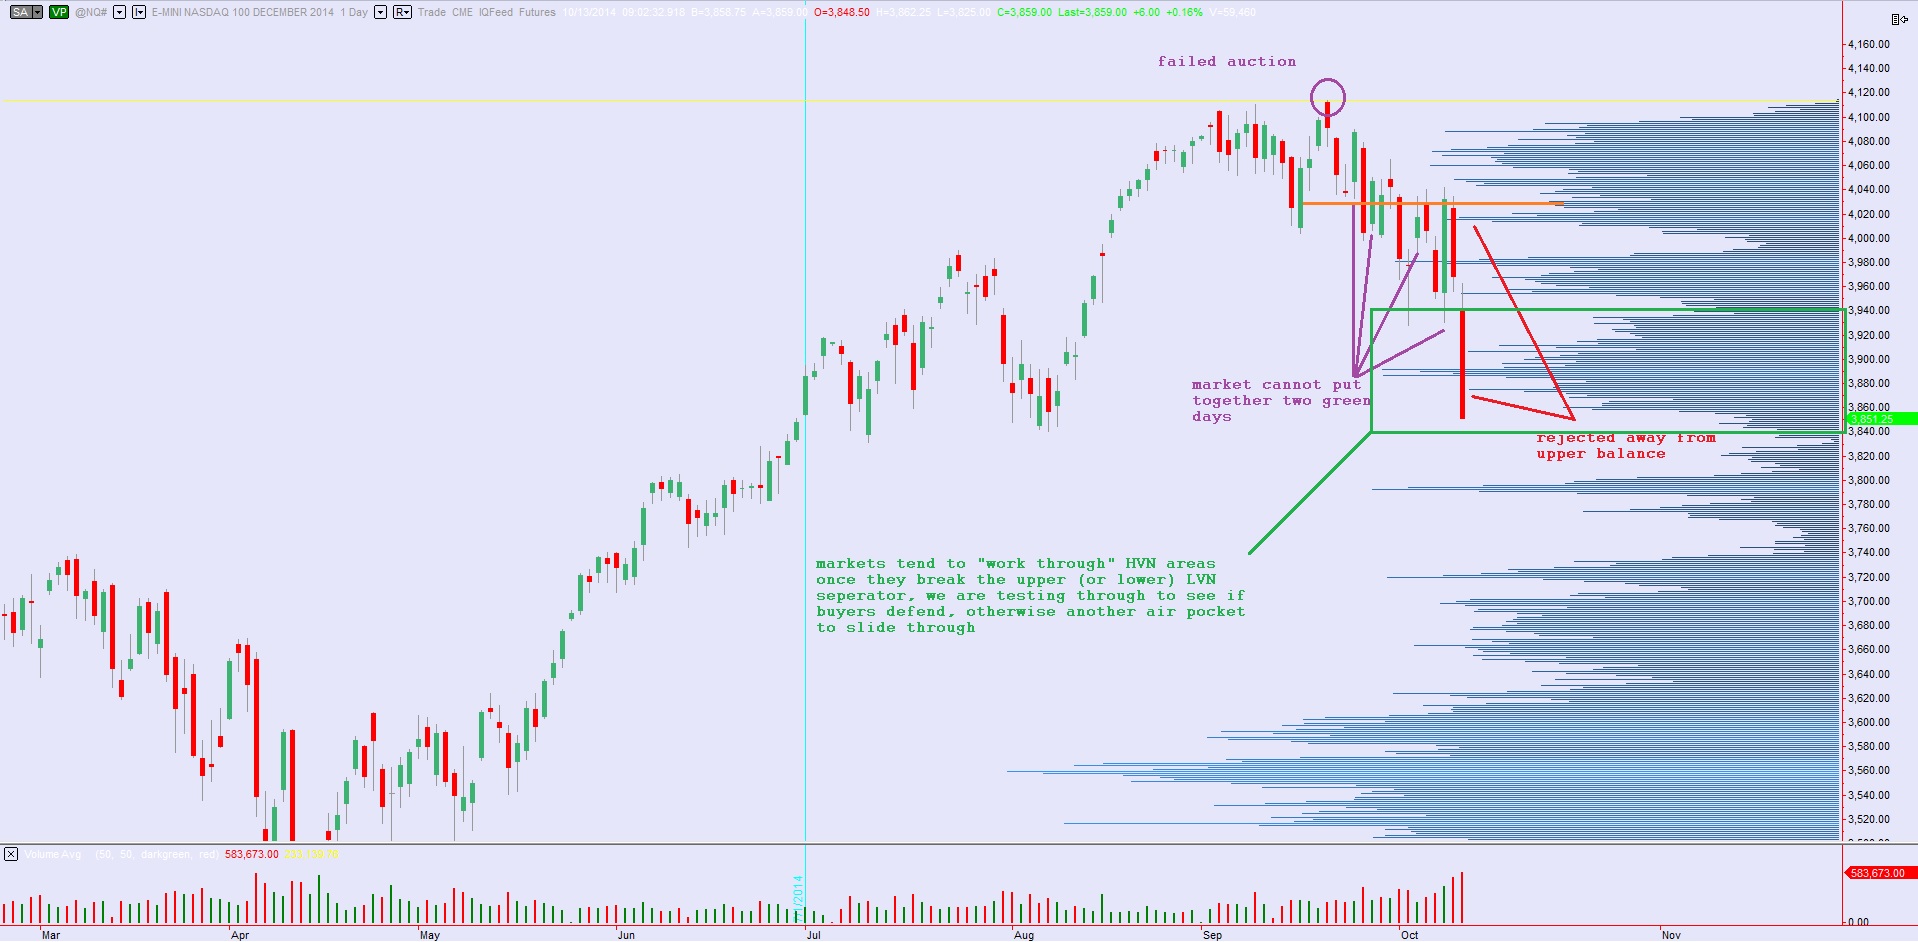
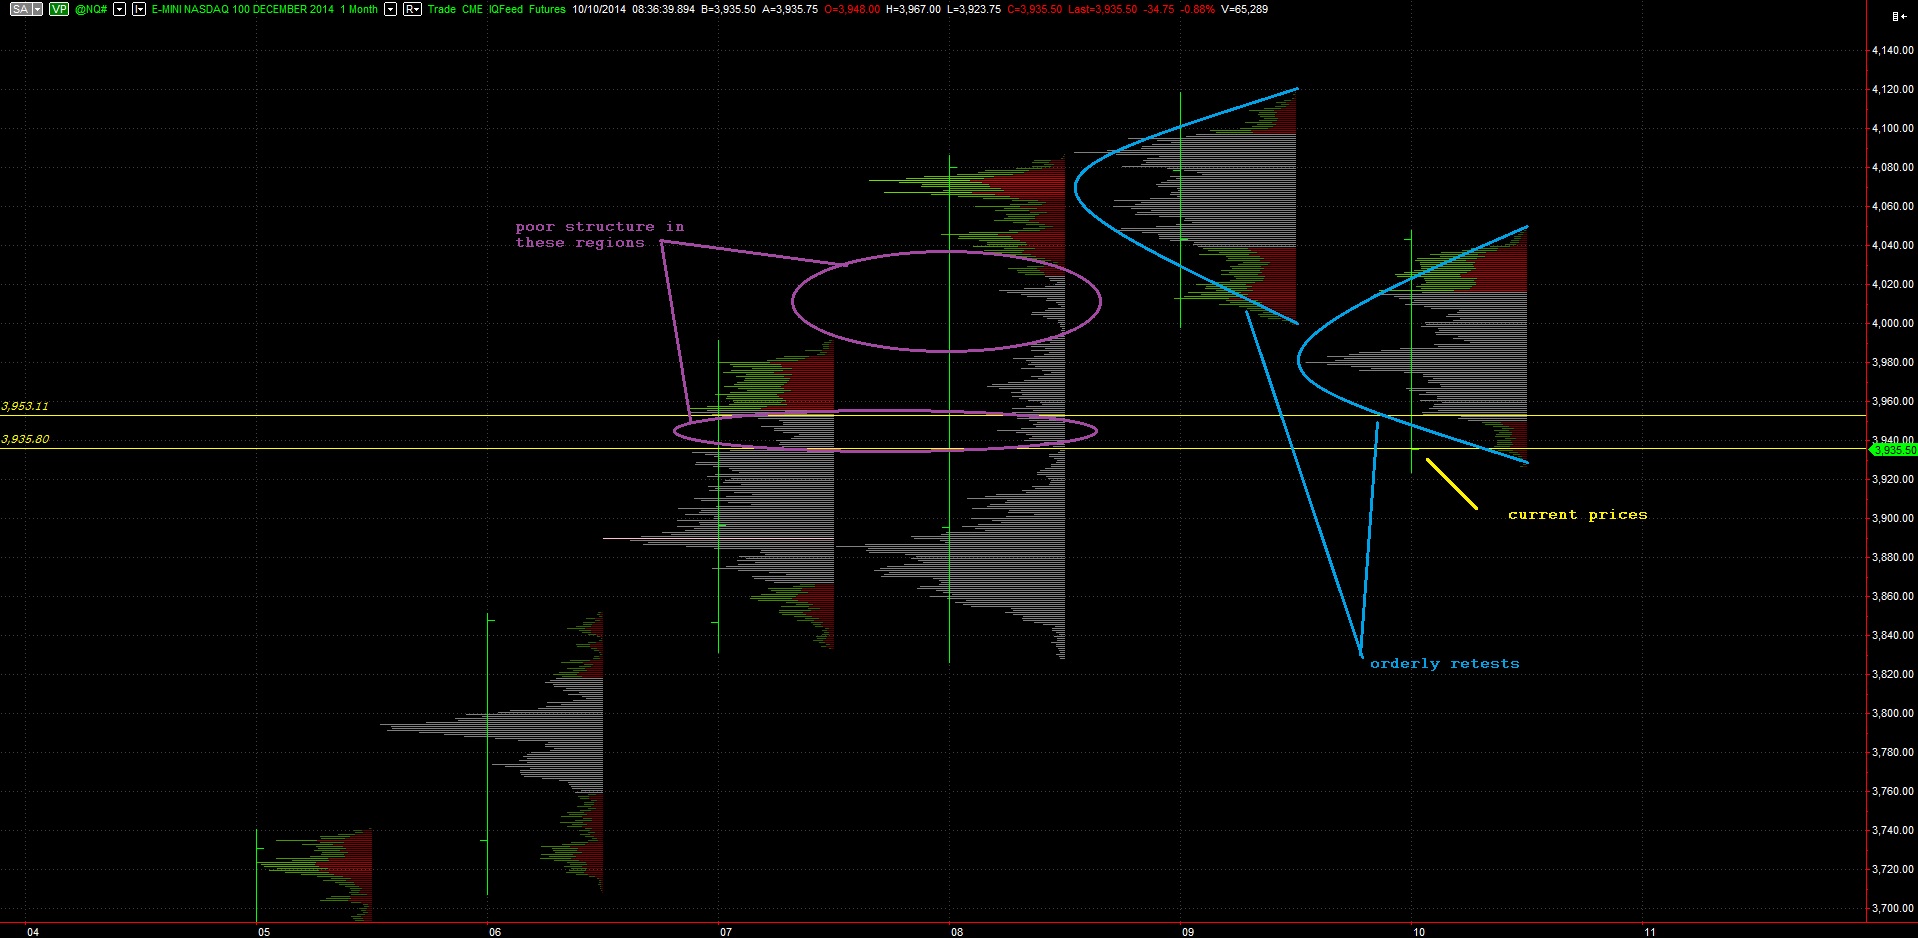
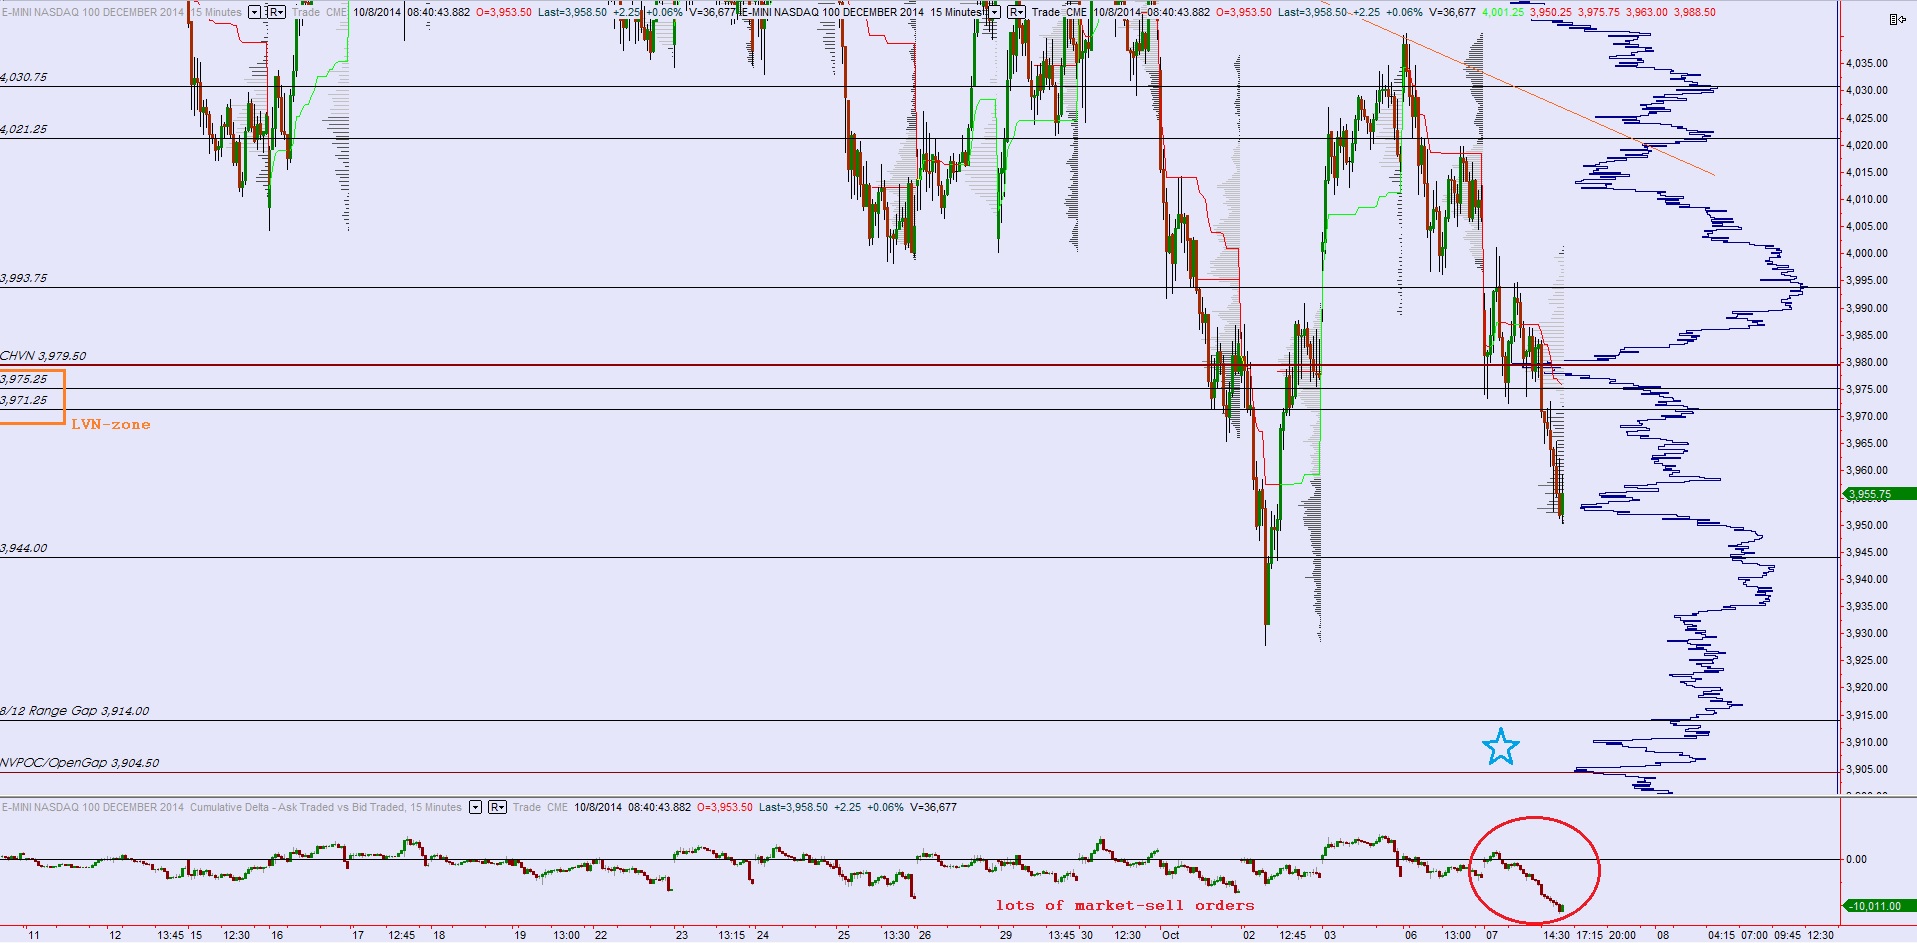
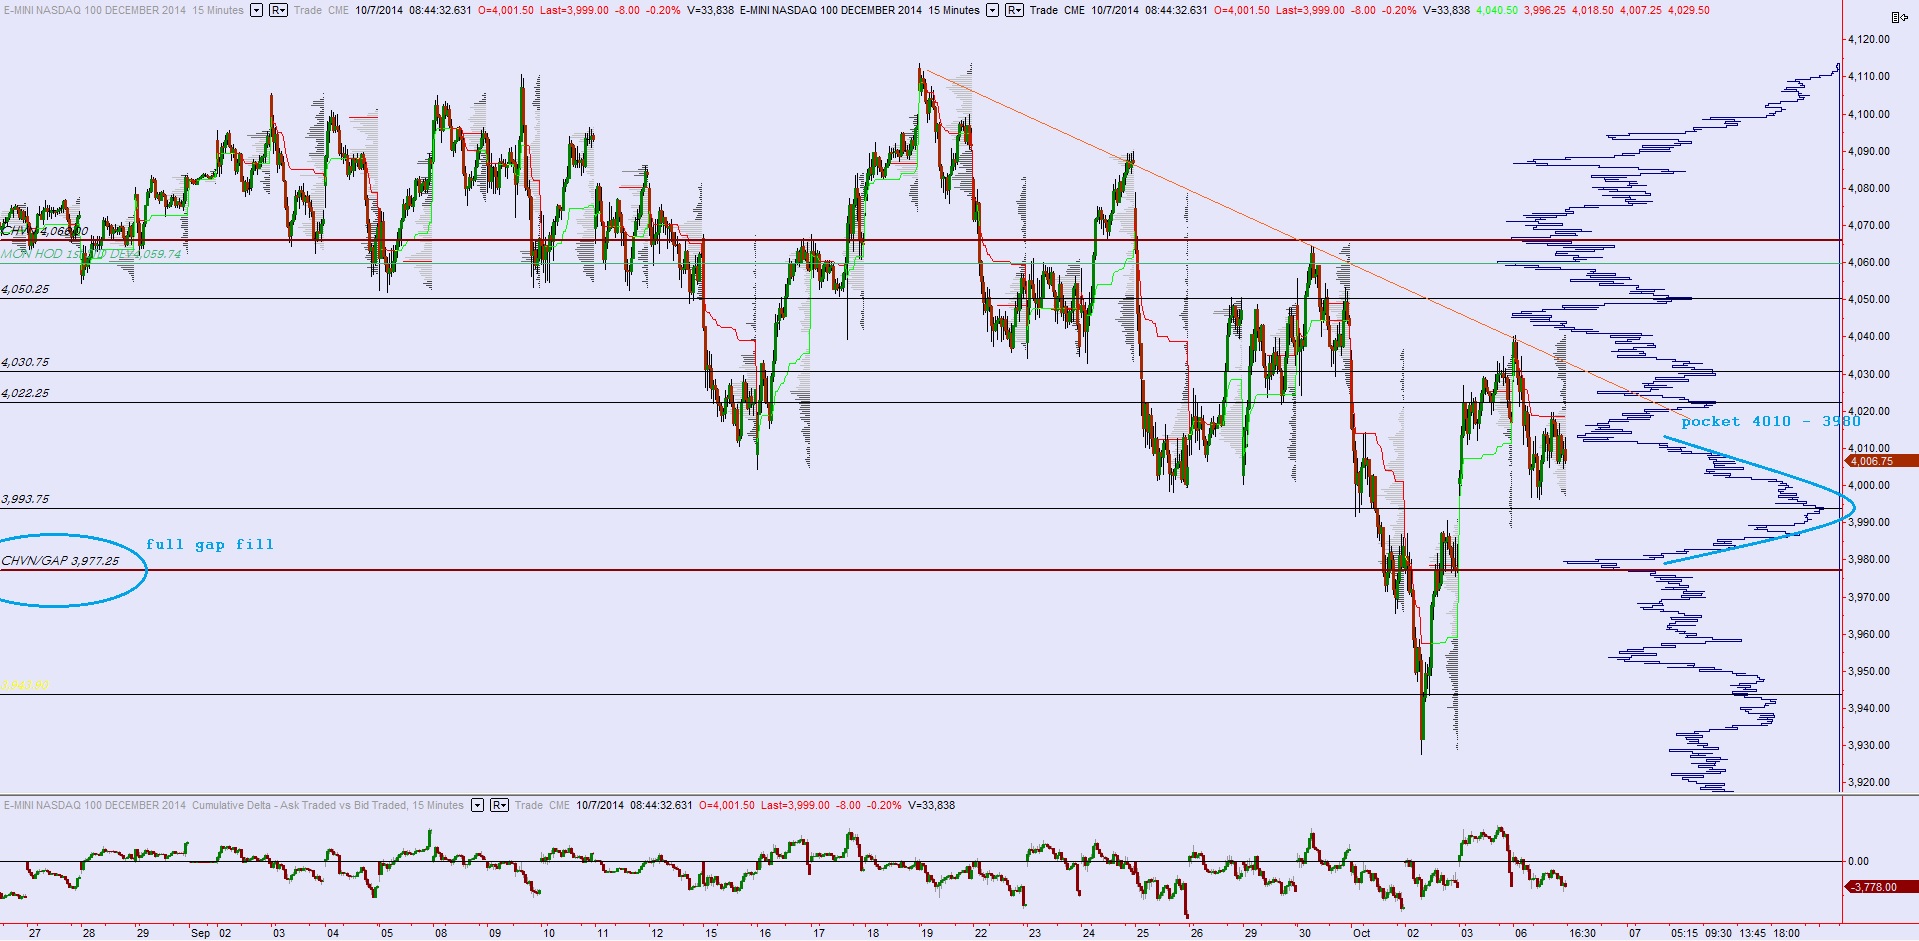
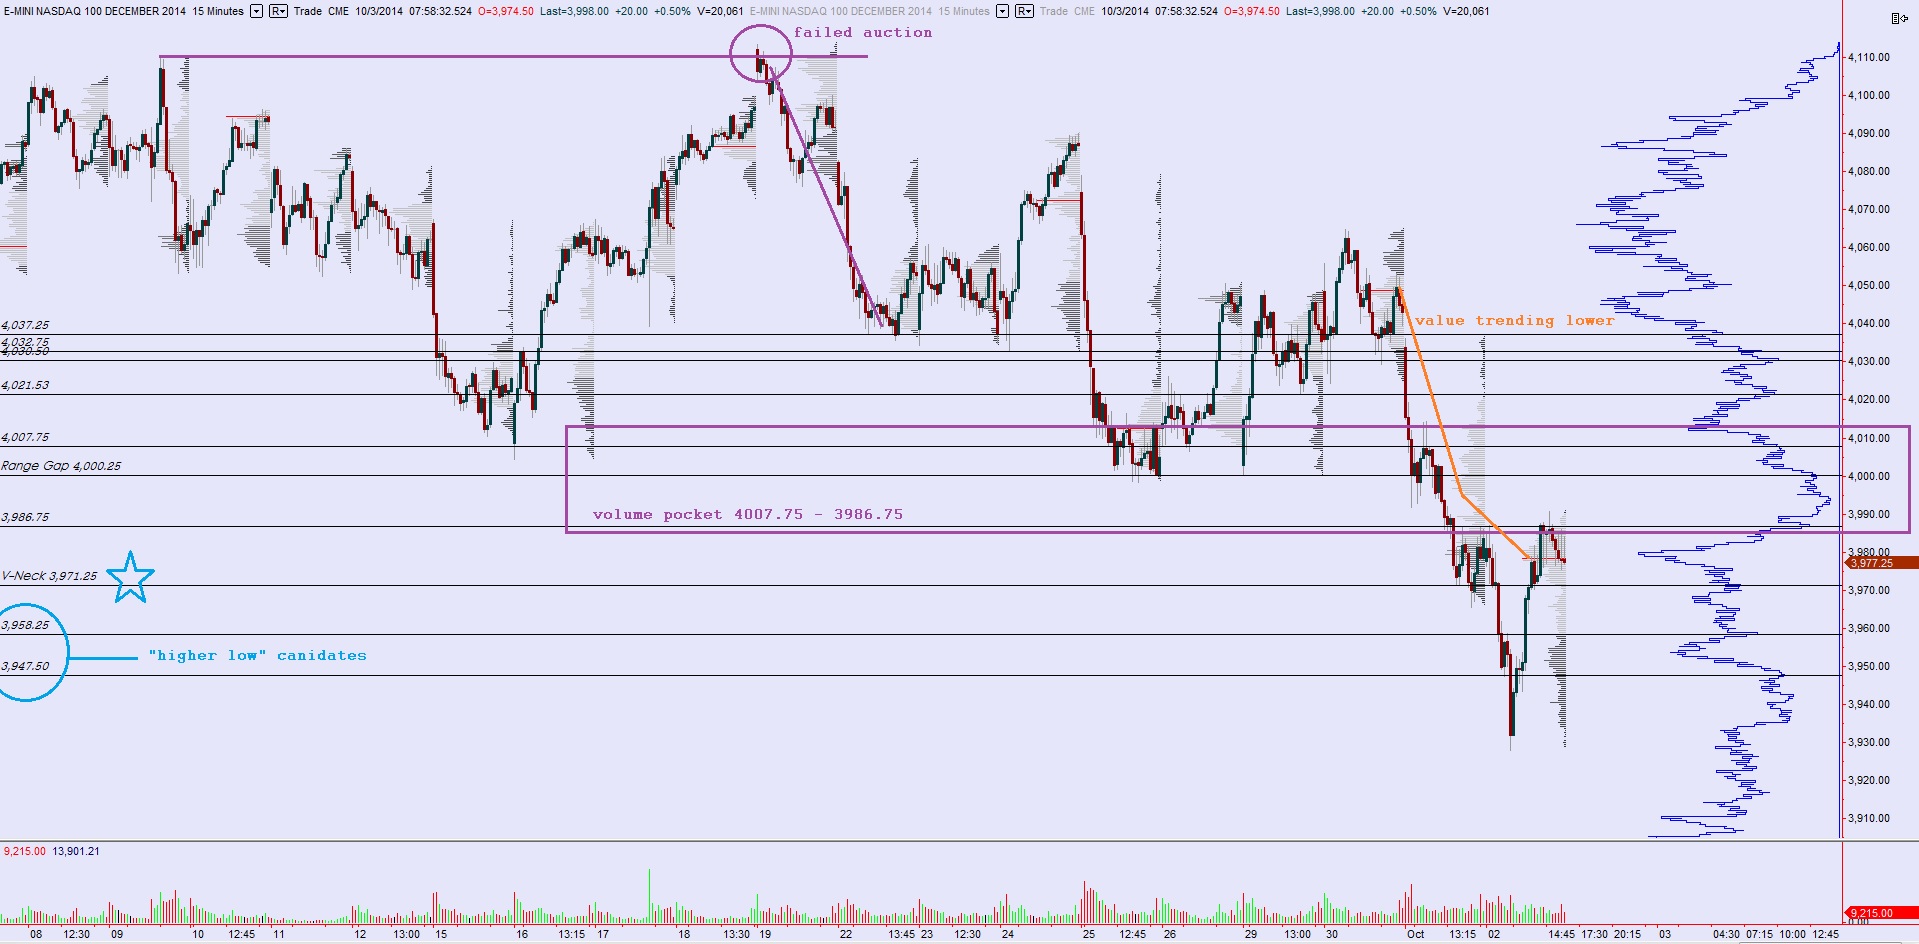
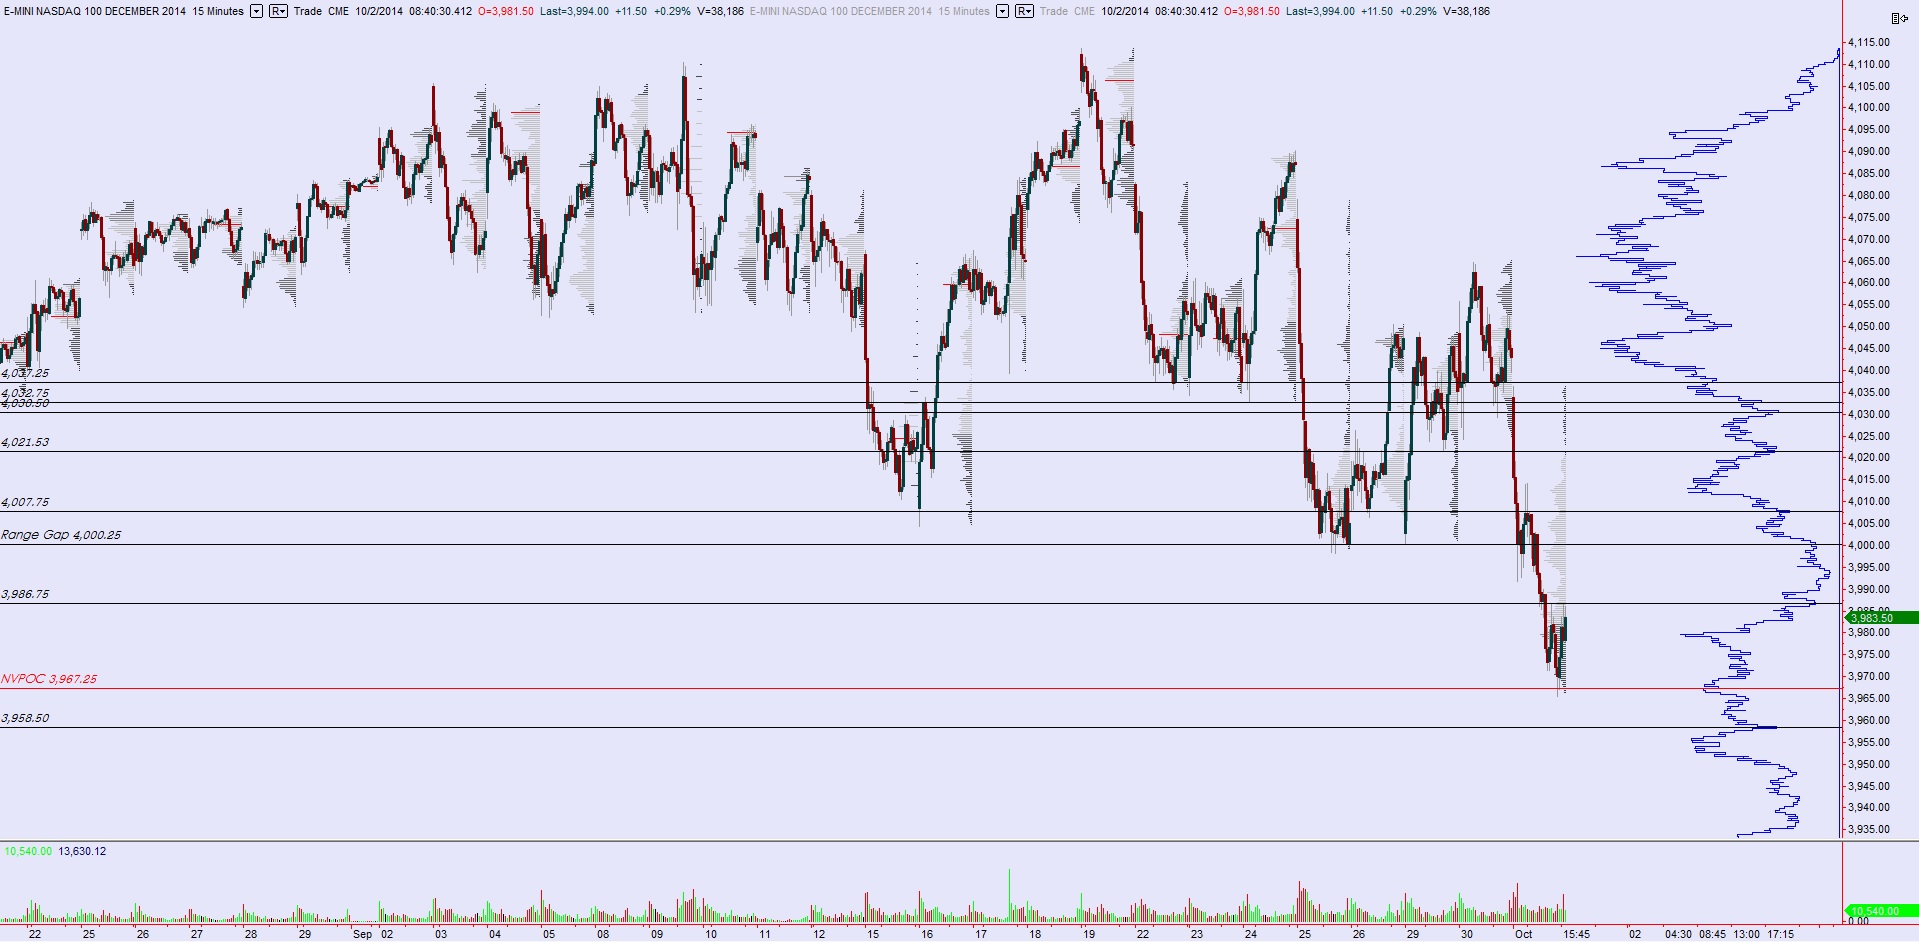
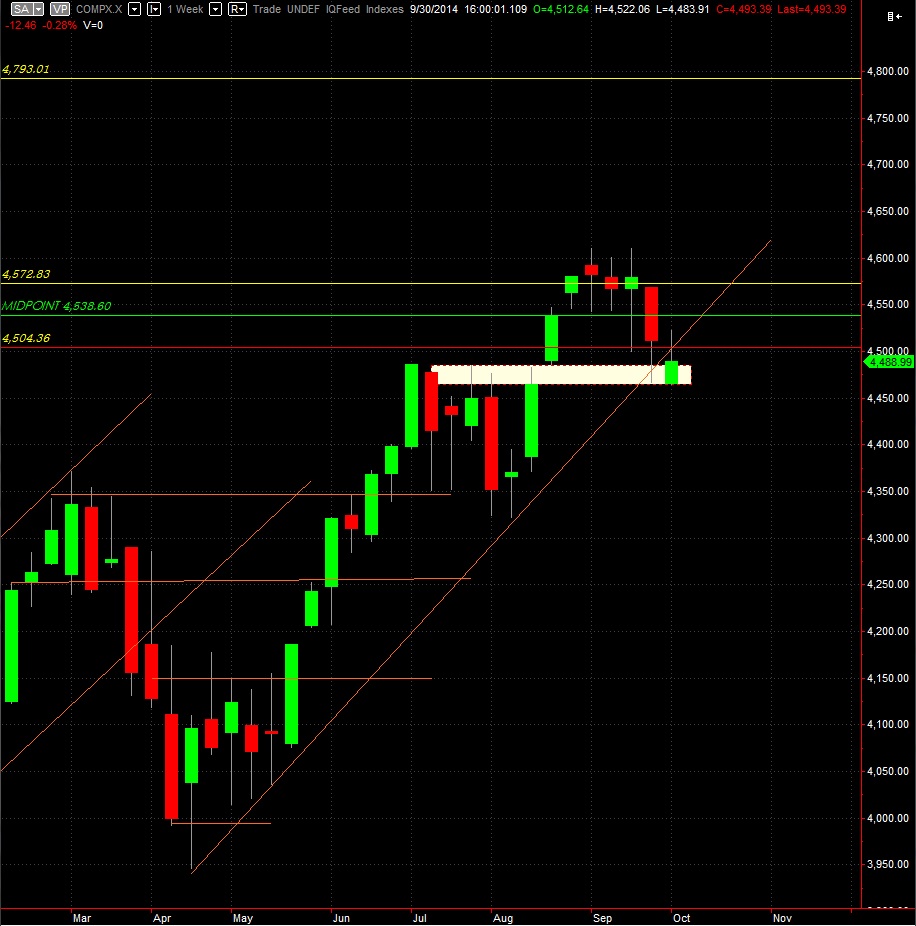
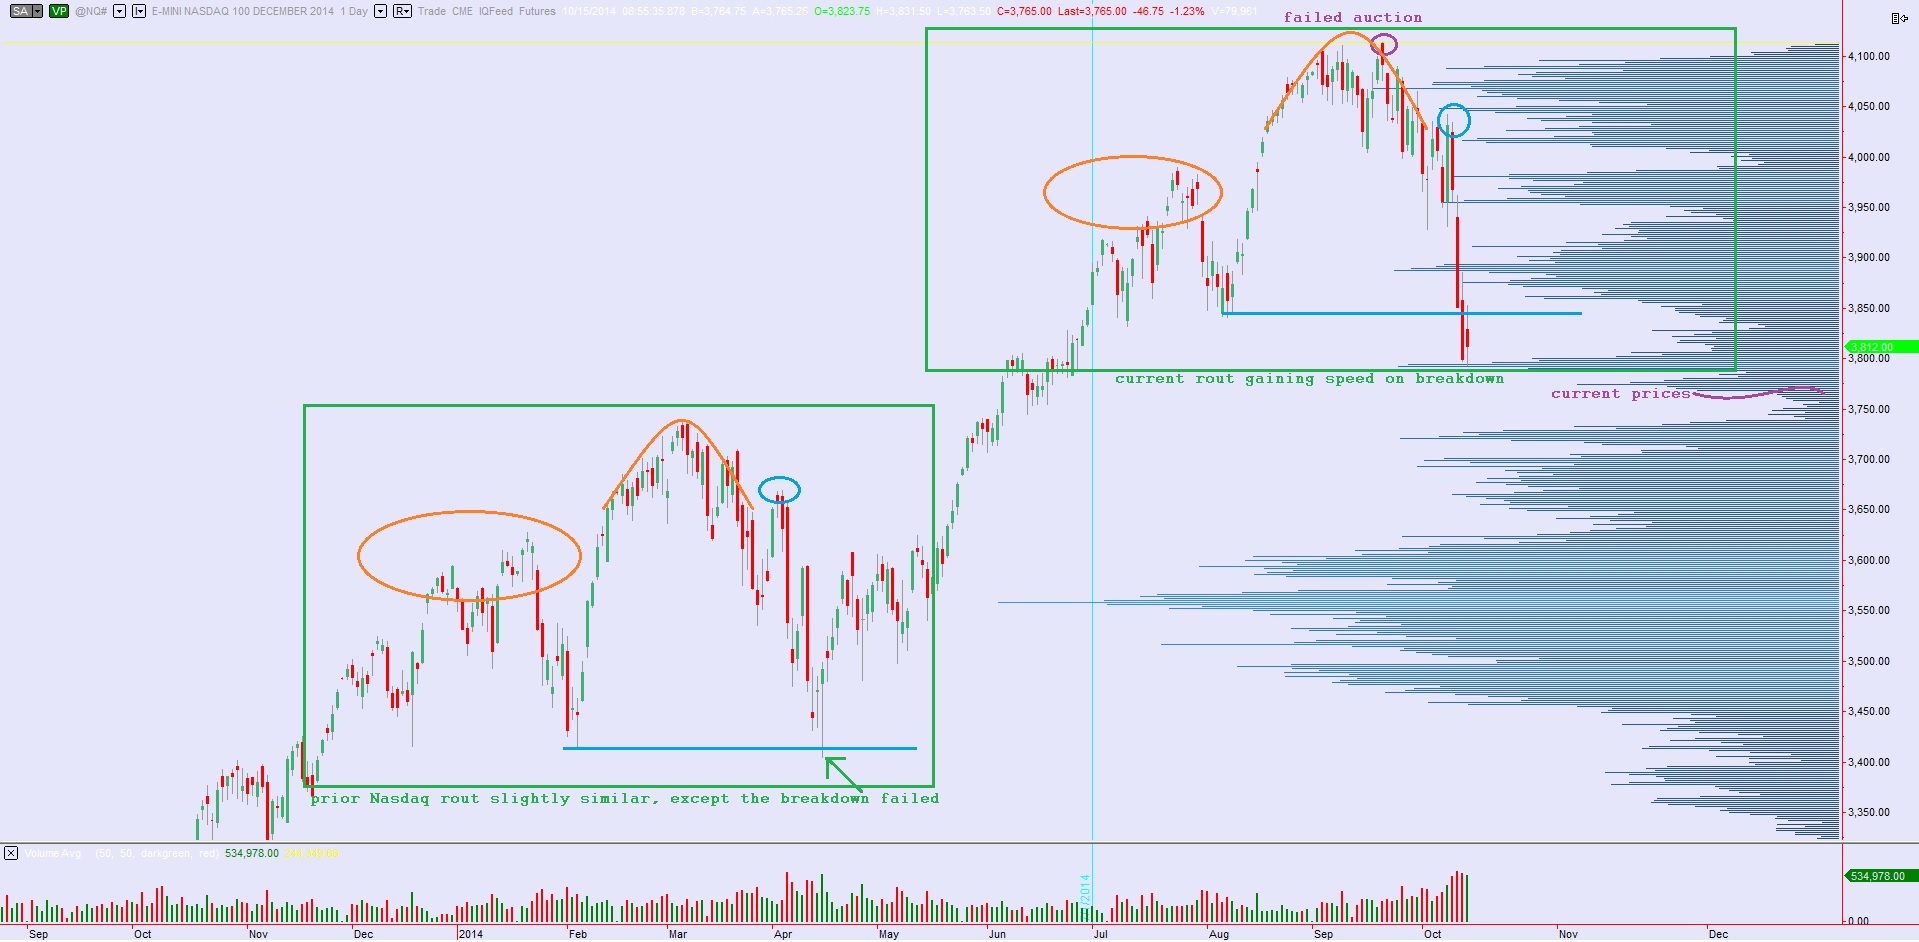
The daily chart illustrates just how fast this market is travelling down and how little difficult it has been, this week especially, to find a motivated buyer.  Once Monday rejected the V-shaped bounces of last week it sent a strong indication that sellers were in control.  Until we see buyers able to take out a prior day’s high the momentum is lower.  What is lending to the velocity of the move is the toothy volume profile we built on the way up.  Each time we slide down through an high volume zone there is another volume pocket which provides little support. The question now is whether we will traverse the next region to return to the very thick profile developed the first two quarters of this year.  I have noted this and a few more observations on the following daily bar chart:

10152014_daily_NQ

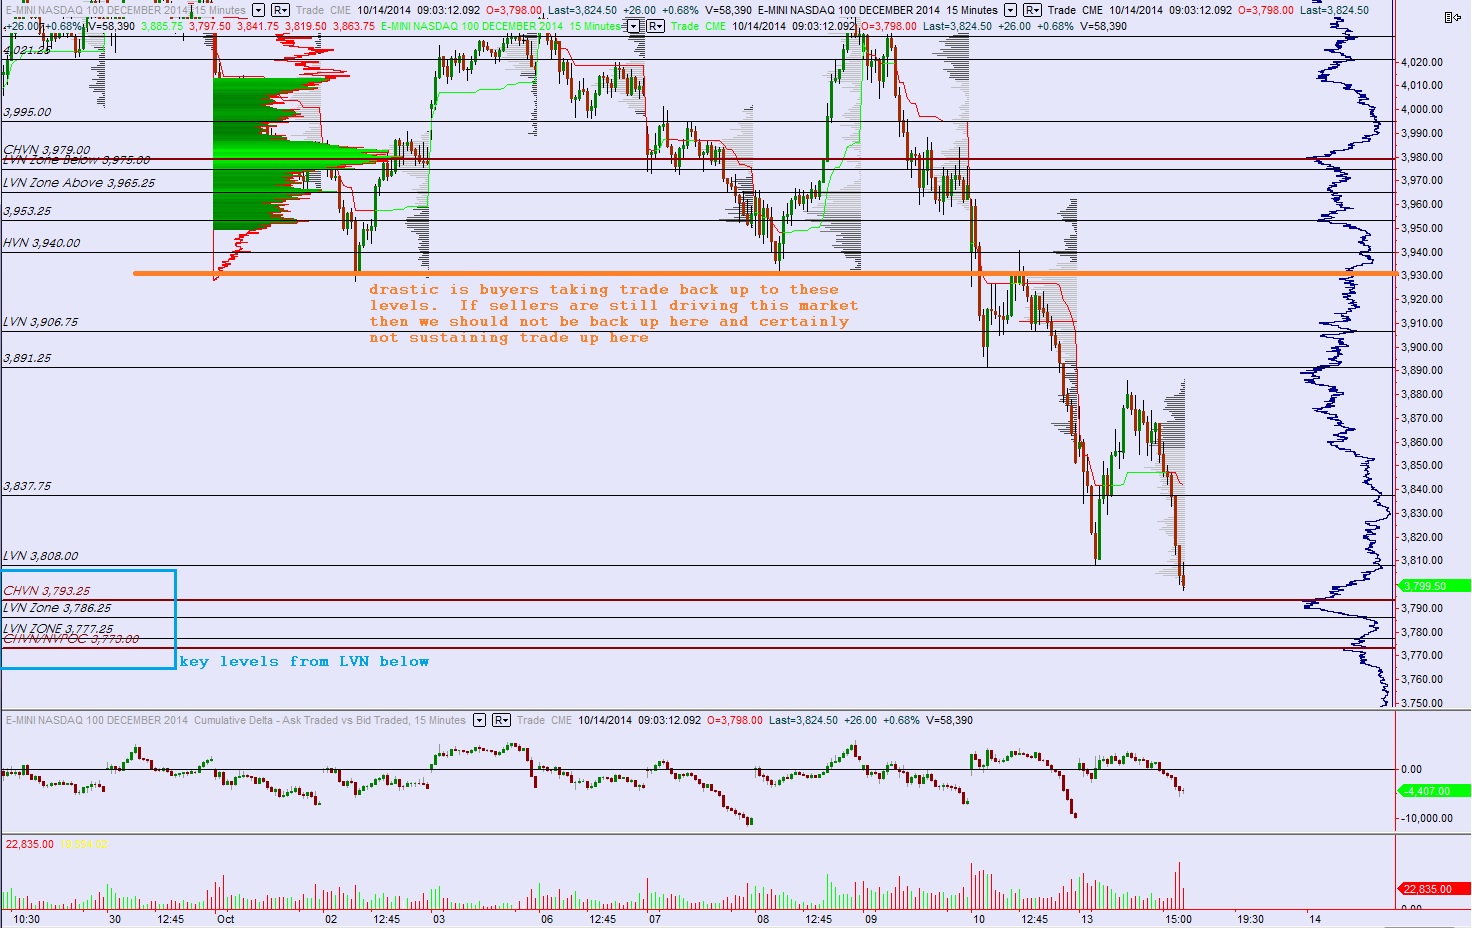
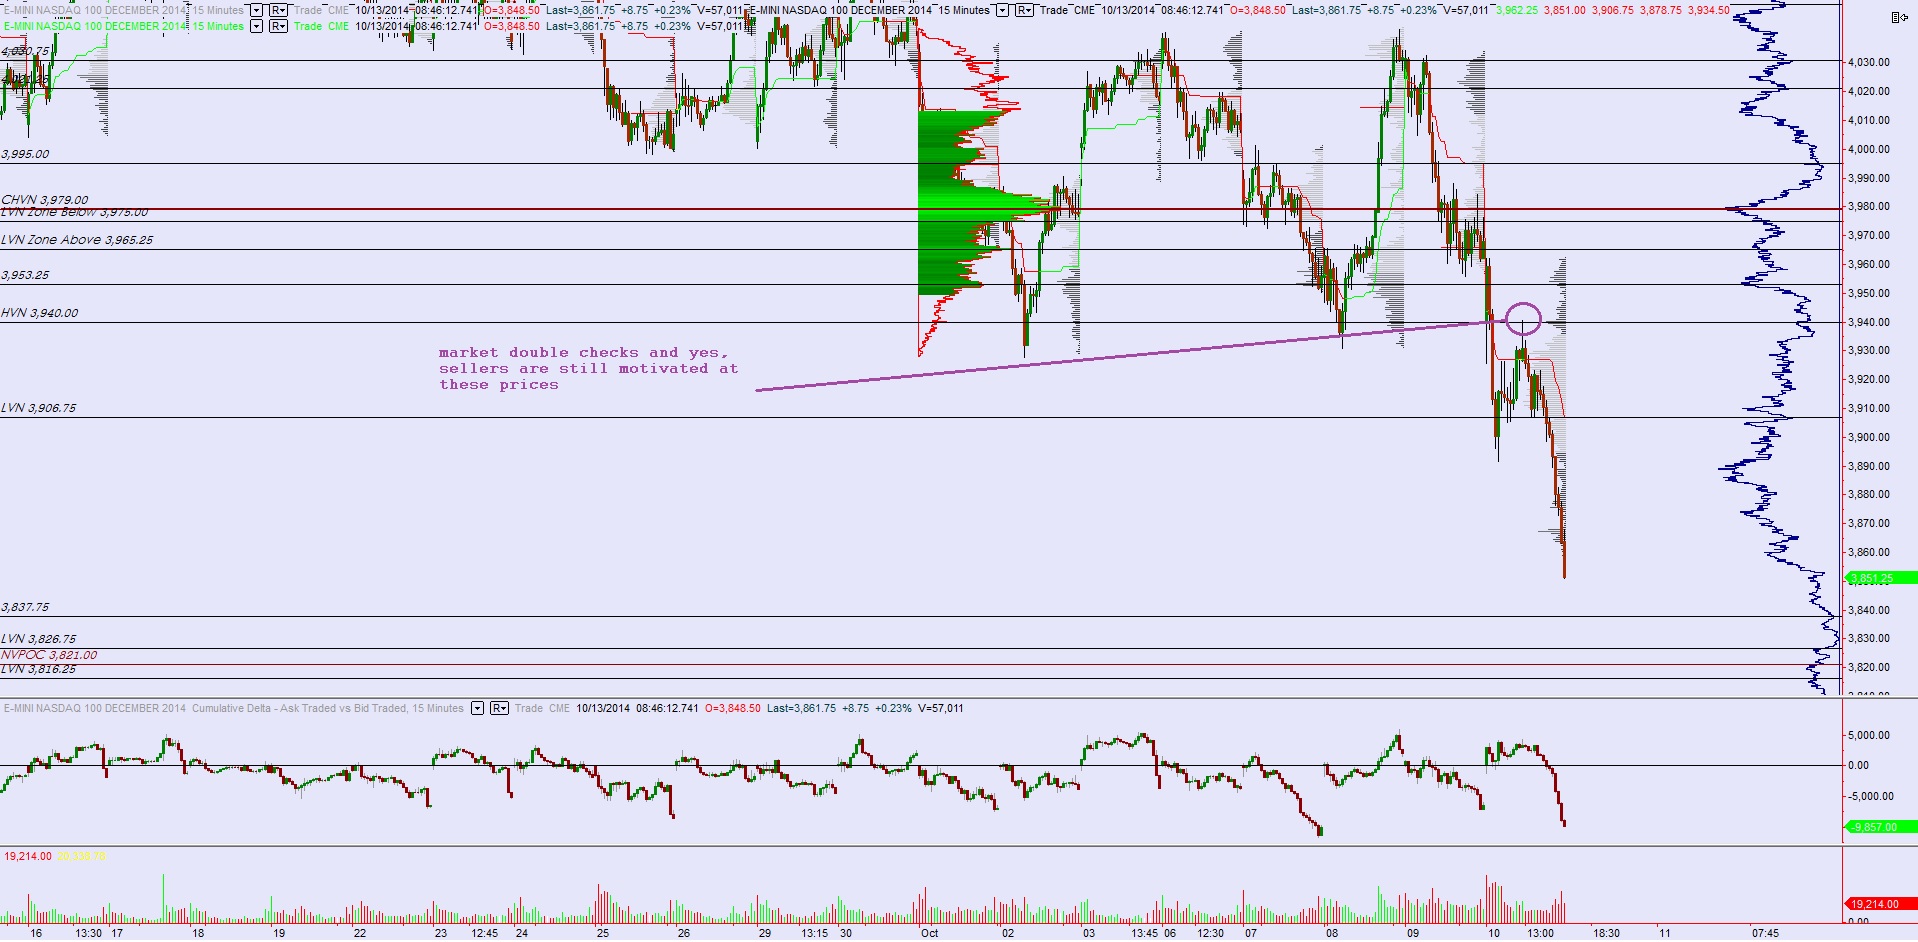
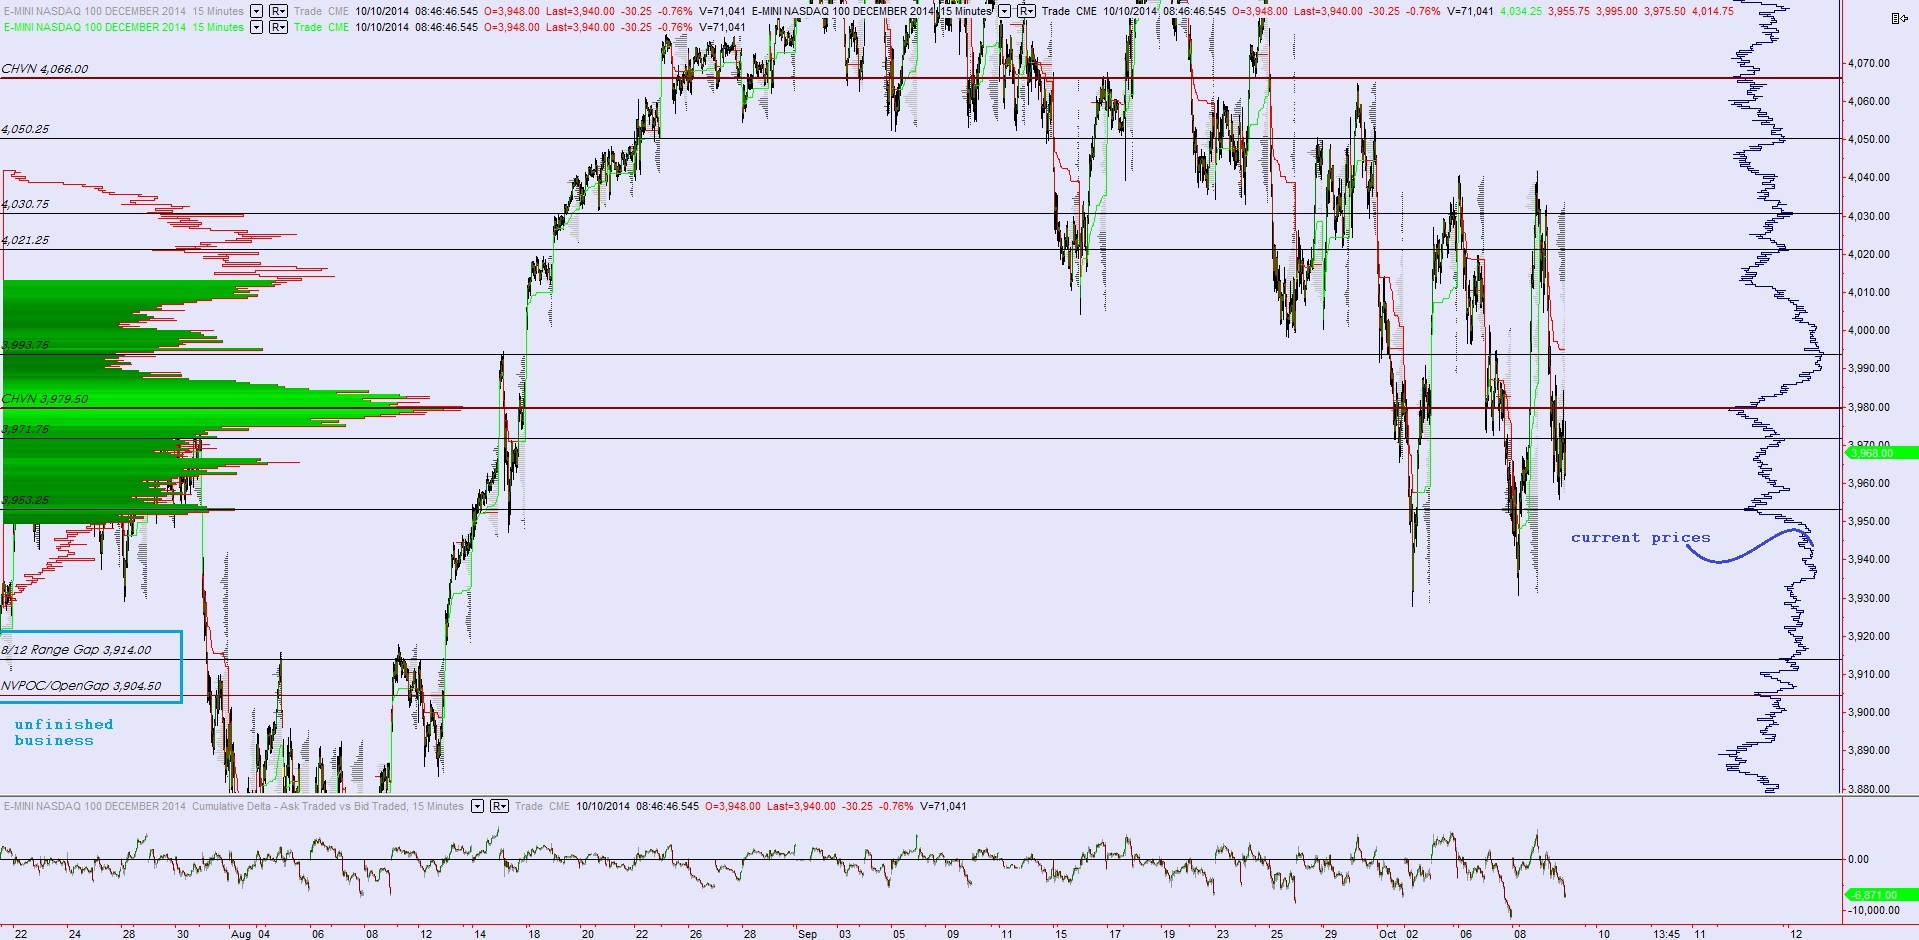
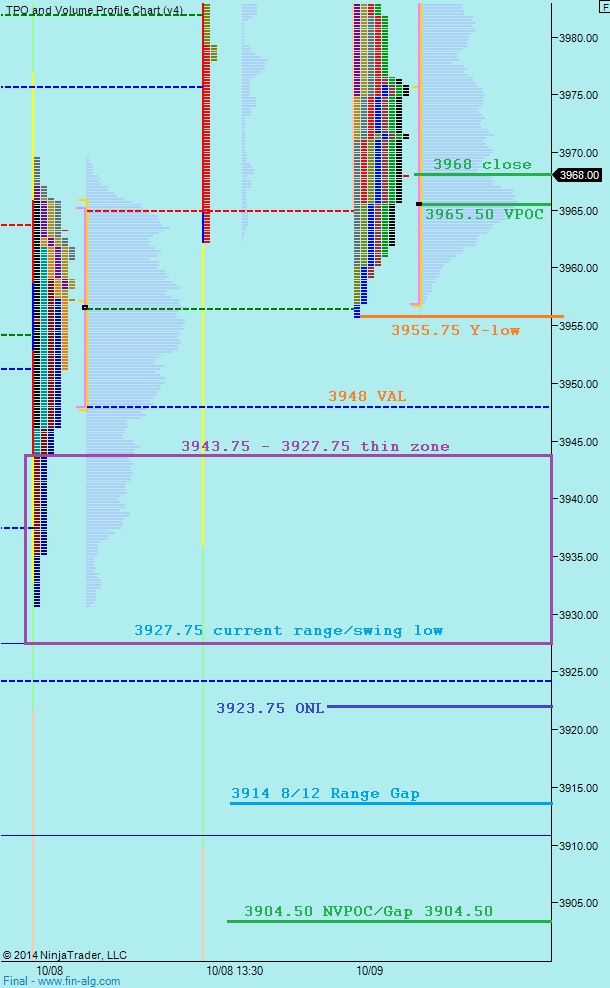
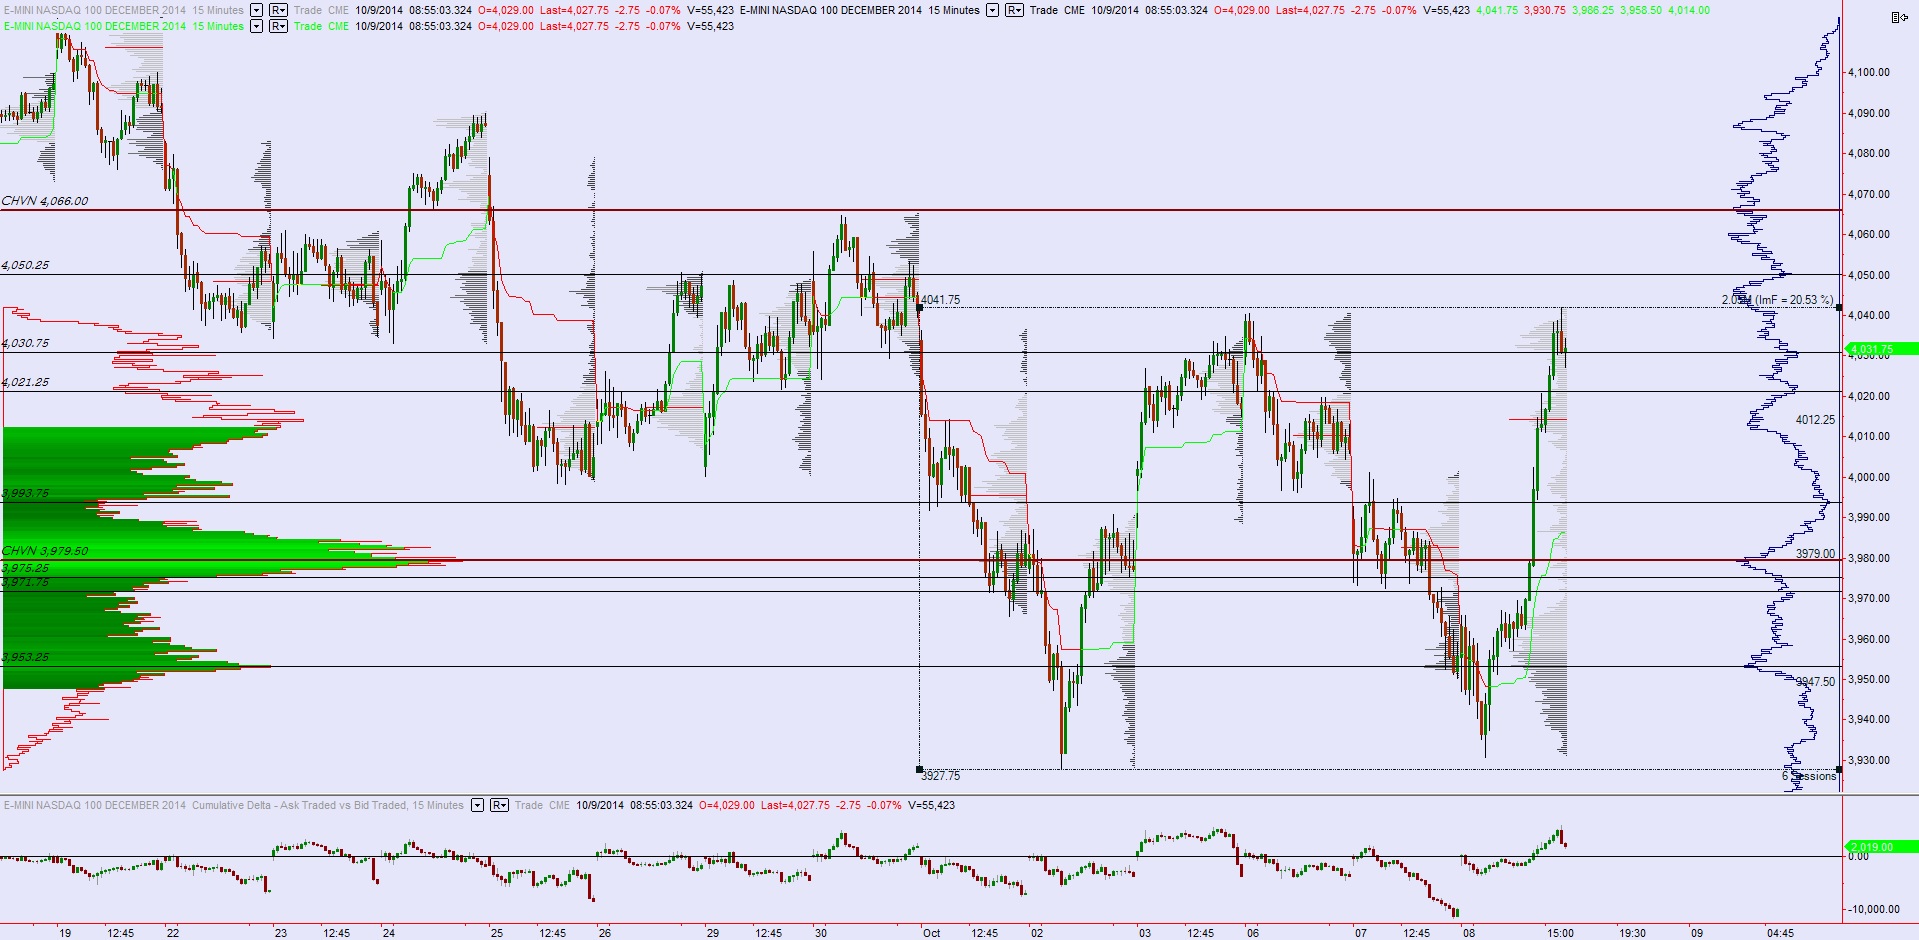
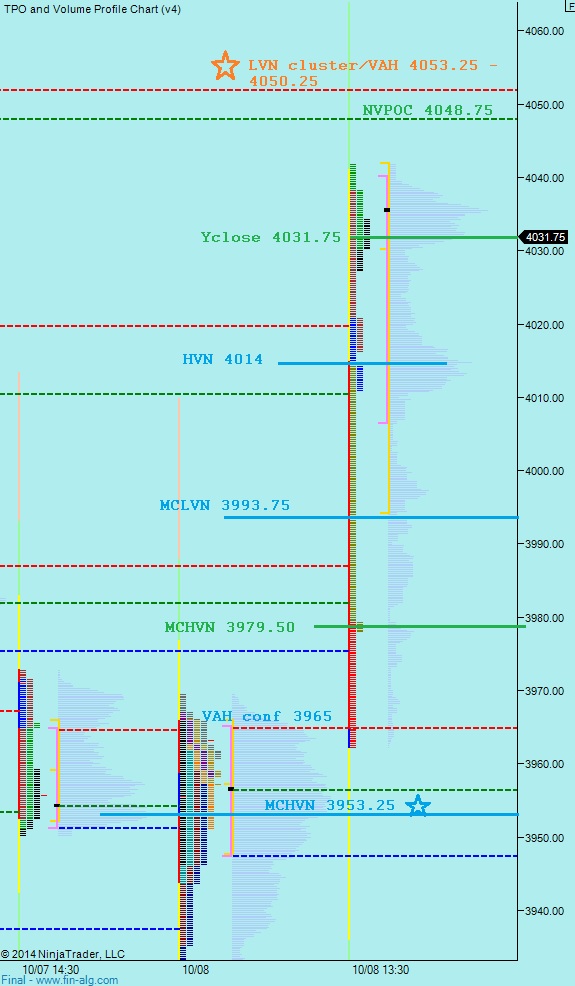
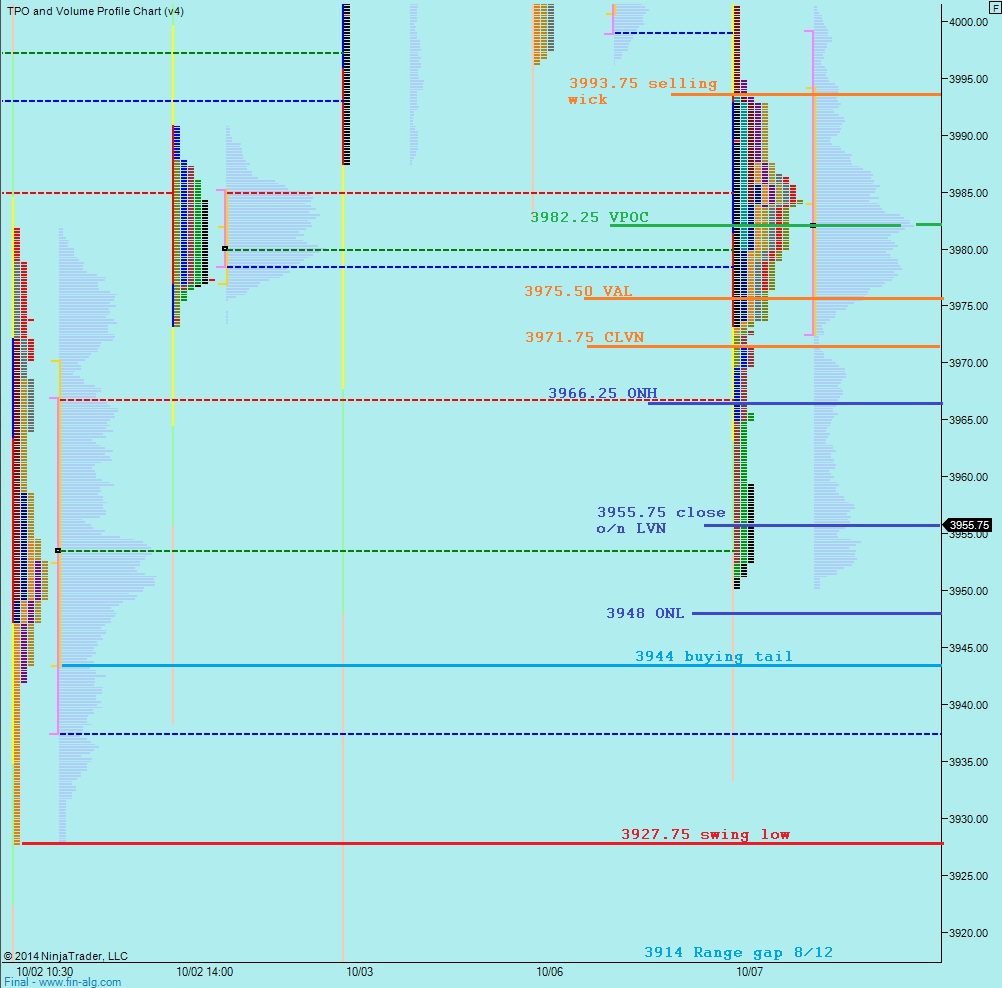
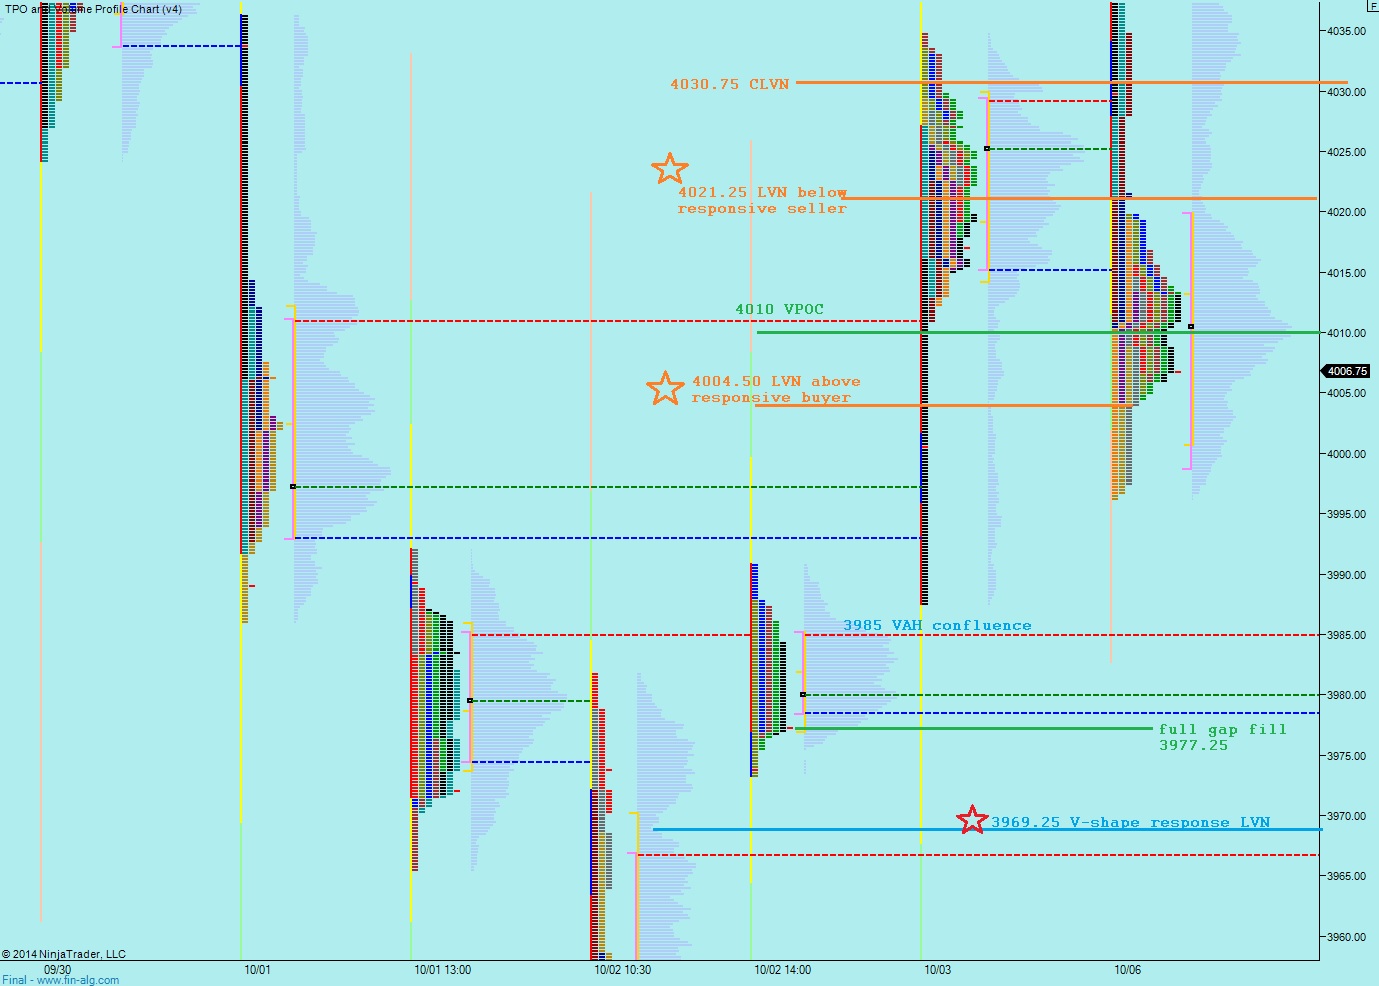
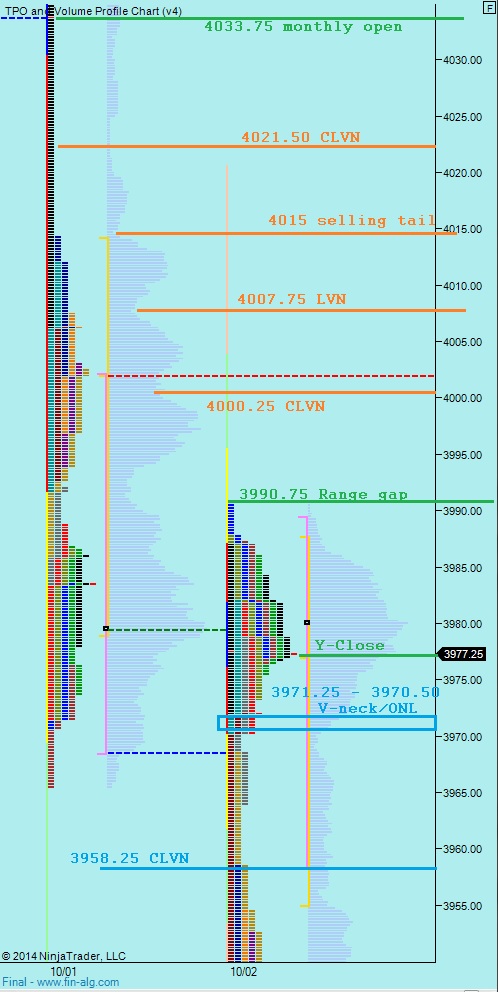
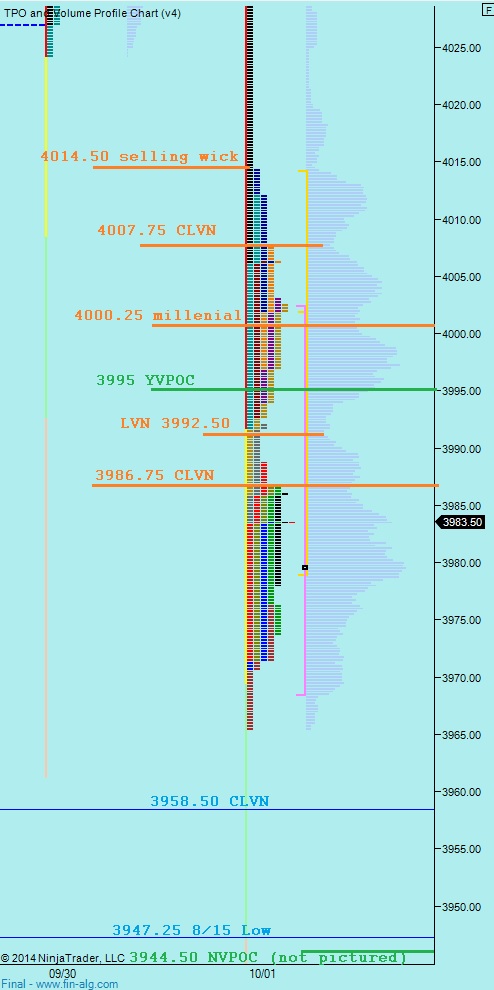
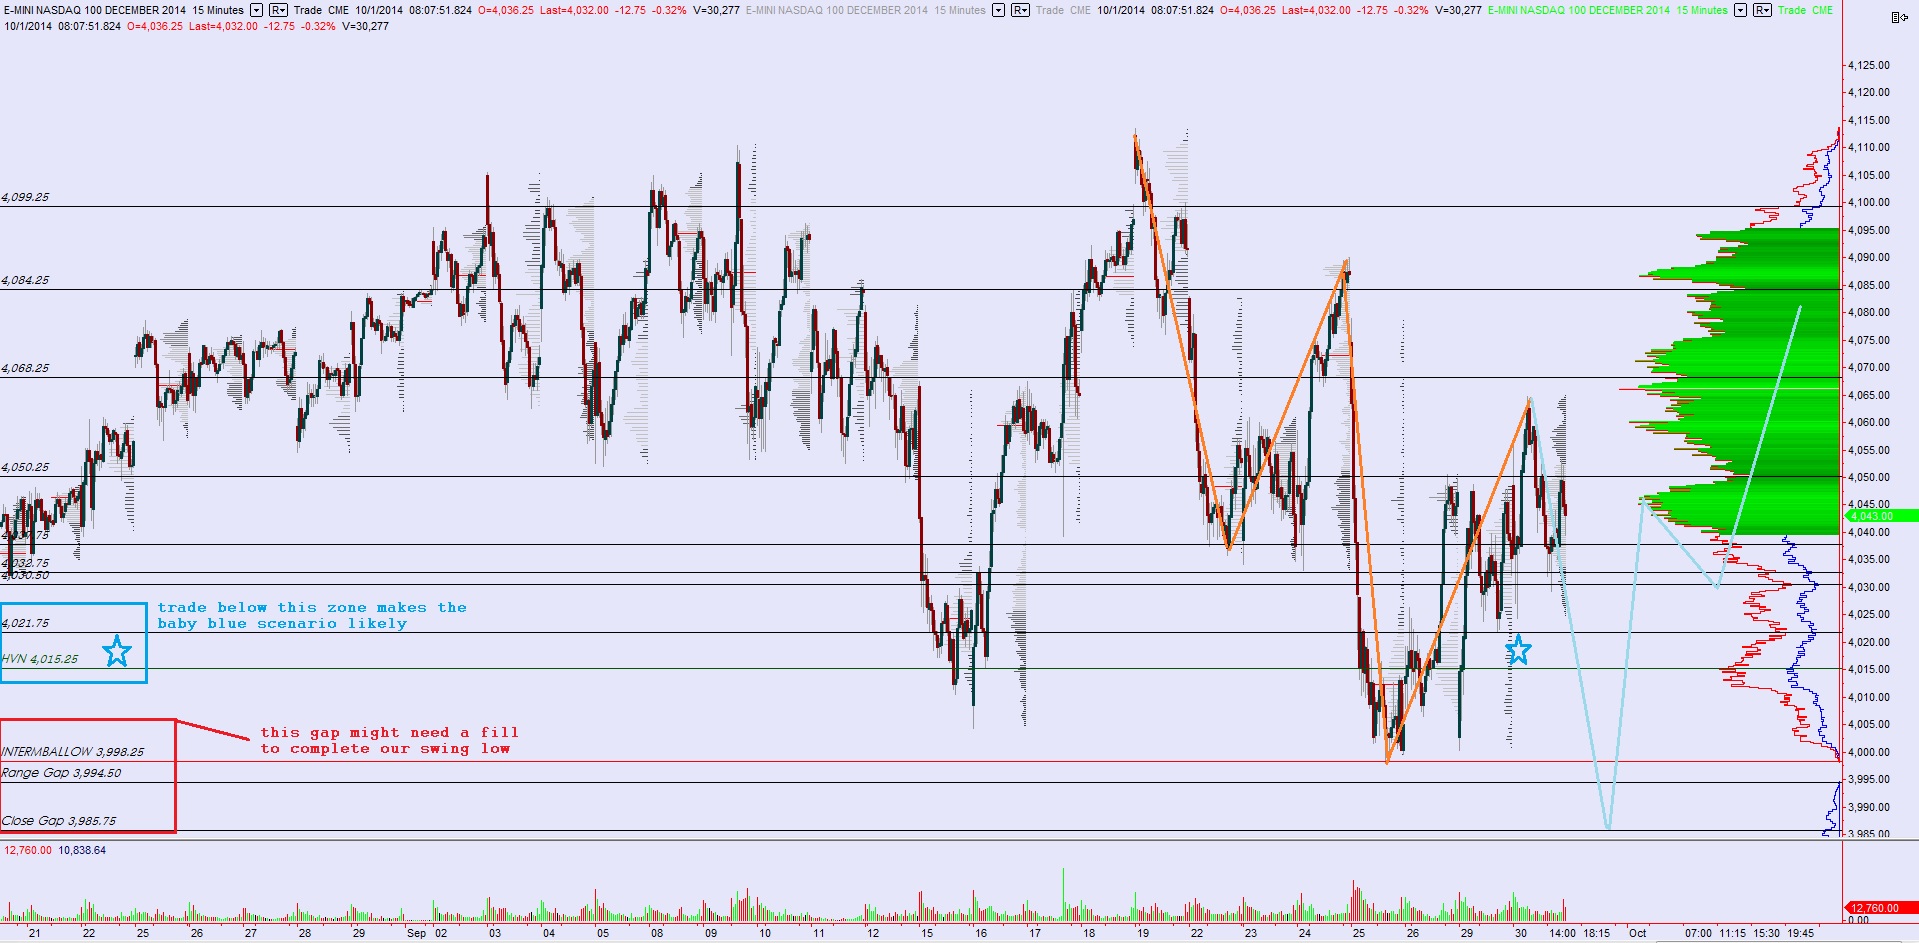
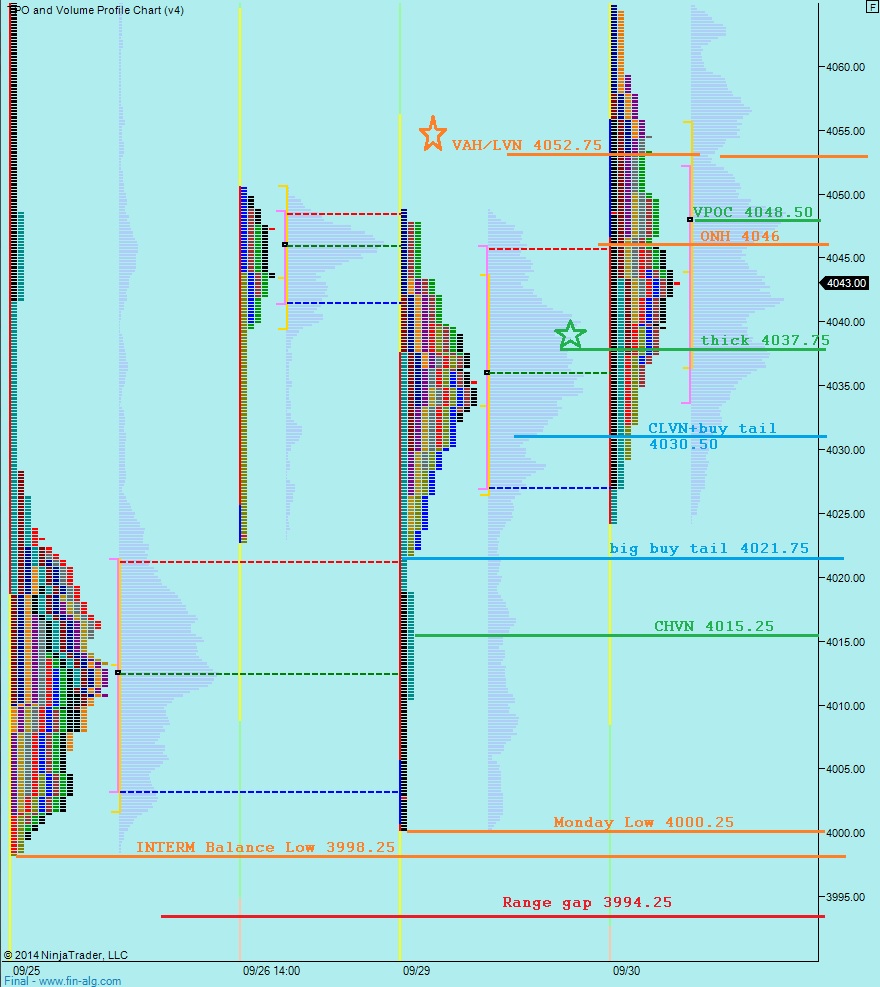
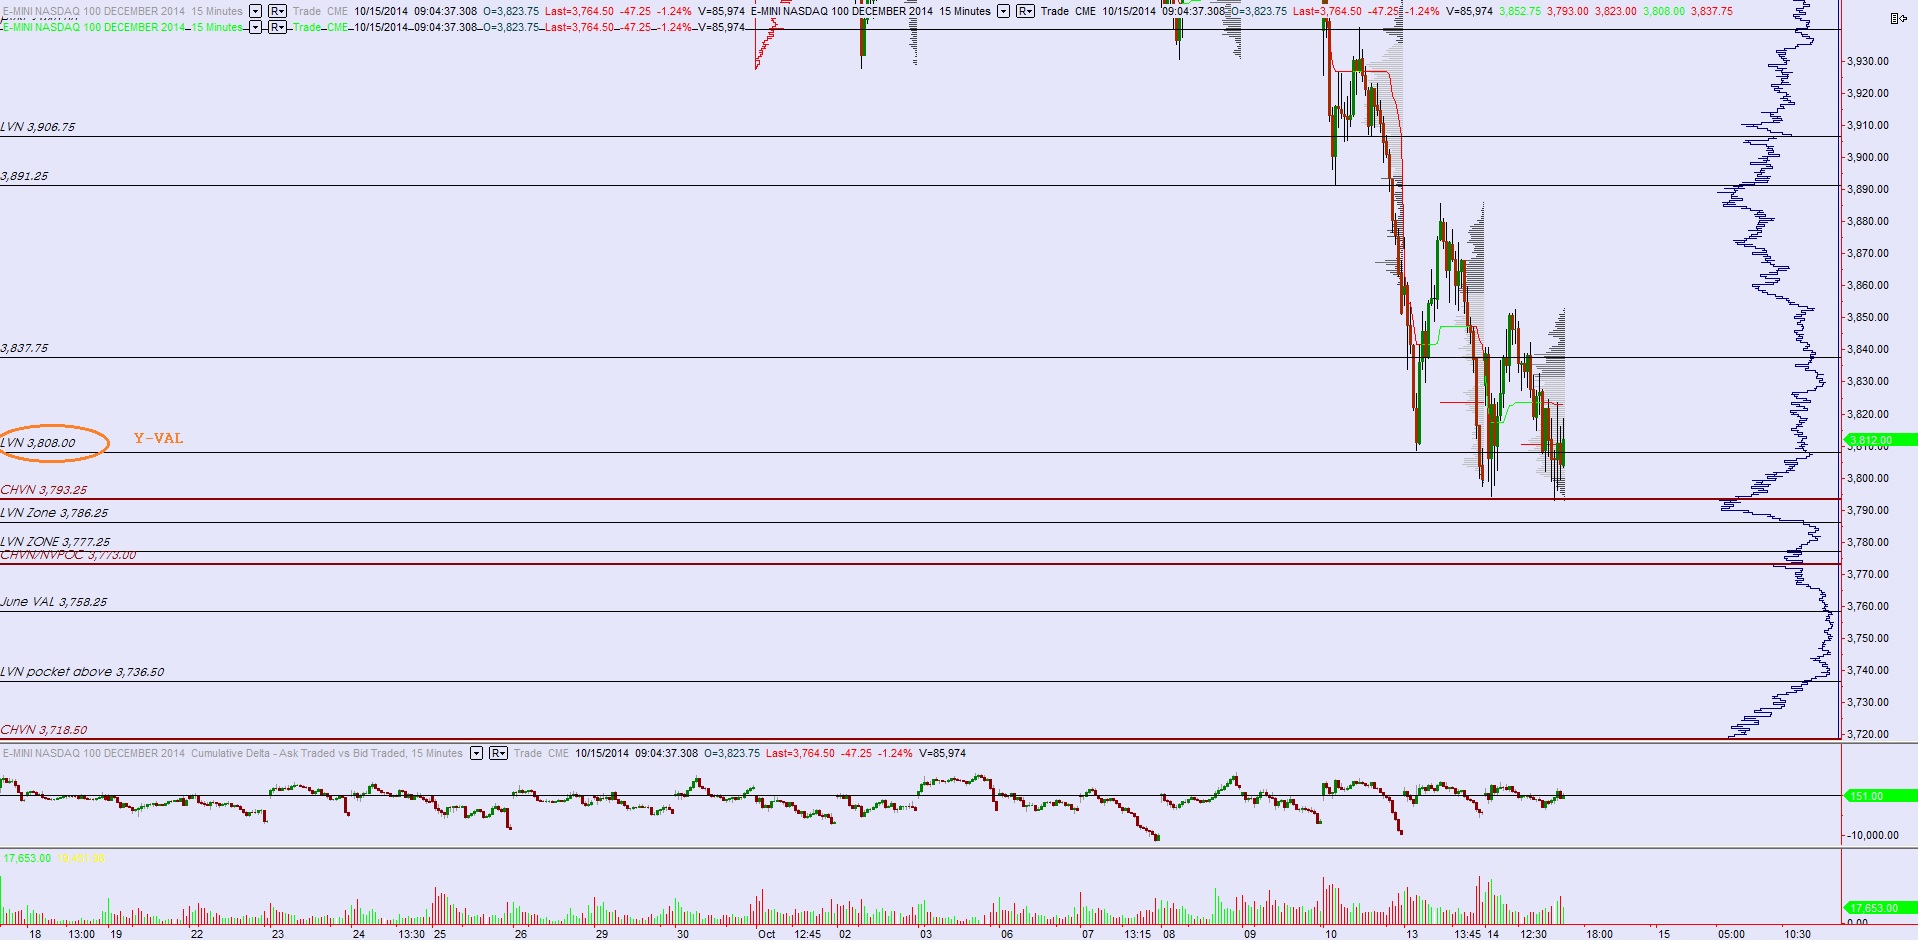
One might make the argument that the daily chart is neutral or even bullish, however there is no confusion on the intermediate term timeframe which is trend down seller controlled.  Yesterday I suggested we needed to see something drastic to change that control.  To clarify, an event would need to be drastic to alter the intermediate term control in one day.  Something less drastic, perhaps lasting 5-6 trading days, could also serve to put this timeframe back into balance.  In the market profile webinar I discussed how high volume nodes don’t make good entries.  That is because often times we traverse the entire high volume region and test the other side of it before determining if it was an effective zone for turning price.  That is what we are looking for today, as we test the low volume nodes on the other side, if it is in fact support.  I have note the key price levels I will be observing on the seller controlled chart below:

10152014_intterm_NQ


Comments »

Looking For Something Drastic

Nasdaq futures worked higher during the globex session, with the bulk of the move occurring after 7:30am when we started hearing about earnings from a few banks as well as JNJ.  The economic news from the UK and Europe was all soft overnight but the market appears more reactive to the earnings environment today.

The market worked back to an area of prior liquidity yesterday after failing to sustain trade at the prior high volume zone around 3890.  The thin pocket we fell into offered prices little opportunity to sustain themselves.  However, just below yesterday’s low was a spike of volume left behind when sellers previously defended this zone with rigor before ultimately giving way to higher prices.  These are the places where we look for signs of demand—places where sellers previously played defense.   Converting resistance into support is a characteristic the market often demonstrates. I have noted this level as well as the air pocket below it on the following daily bar chart:

10142014_daily_NQ

The issue bulls have to contend with is the motivated manner by which the market is trading.  Volume on the Nasdaq futures during the last three down days has been at the highest seen since around 2011.  The market is a mechanism designed to facilitate as much trade as possible between as many parties as exist.  Since the 9/19 failed auction high we have seen a clear pattern of lower highs and lows emerge on the intermediate term timeframe.  At some point this selling exhausts itself, and perhaps this morning’s strong gap up is an early sign of exhaustion.  However it would take something drastic to turn the course of our current intermediate term direction.  I have noted key price levels I will be observing including a price level I consider “drastic” and also noted the granular detail of the HVN zone we are trading down into (see prior chart) on the following intermediate term profile:

10142014_intterm_NQ

Comments »

Let Us Have Another Go at This Market

Traders are coming into the week with the Nasdaq futures up a bit on this Columbus Day session.  The globex market opened Sunday evening and showed some continuation on Friday’s weakness which made sense considering how we closed on the low tick of the session Friday afternoon.  Prices began to recover their losses a bit around the time European markets opened up.  The economic calendar is a bit slower this week and back loaded, with the highest impact announcements coming Wednesday (Advanced Retail Sales, Fed Beige Book) and Friday (U of Michigan Confidence).

Turning first to the daily chart, we can see just how weak the market has been since the Alibaba IPO.  Correlation does not indicate causation, however, we also printed a failed Nasdaq auction on the day BABA came public.  Since then we cannot find a sustained bidder in the market.  Instead we continue exploring lower, like Columbus, in search of buyers.  I have noted the activity below:

10132014_daily_NQ

Becoming a bit more granular and observing the 15-minute chart, we can see how balance began to form at the start of October despite the failed auction and inability to string together two up days.  It was a violent form of balance dating from Oct 1 – last Thursday.  Friday we opened on the lower range of the micro-balance and rejected it, starting anew the discovery process.  I noted in purple how the market made a strong bounce and ‘rechecked’ the scene of the rejection where if verified seller control.  I have noted this as well as the key price levels below (dating back to June) and above:

10132014_intterm_NQ

I am in development of a new market profile chart this week, thus I will primarily focus on the intermediate term chart these first few days of the week.  I am also allowing Xfinity a second chance as I start the week after their linesmen and women demonstrated some of the highest customer service I have seen over the weekend.  Thus, I will be a bit hands off until the systems prove stable.

Comments »

Keeping Matters in Perspective

Nasdaq futures are lower this morning on heavy volume and an above average range.  The selling started not long after cash markets closed in the USA and it made an aggressive rotation between 3-5am.  The economic calendar is quiet as we head into the weekend with the most significant events being various Fed members speaking at 9am, 1pm, 2pm, and 3pm.

The Nasdaq is the weakest index this morning, but before we get too far ahead of ourselves, let’s have a look at the monthly volume profile chart to have an idea of where we are trading.  Imagine you were driving from New York to Las Vegas.  Being a resident of New York you are familiar with the roads you need to take to reach the major interstate.  Once on the highway you can use a national map to guide your course.  Once you enter the state of Nevada you would switch to a state map and once inside the city a city map and once inside your casino perhaps a casino map.  The monthly volume profile is your national map.  As you can see below, we are still trading above the largest volume distribution of August.  When we went for a rally in August we left behind a poor structure which the market is now retesting.  The current pocket we are trading in had decent price memory in July, but just above us (the two yellow lines) there was little-to-no history until this month.  This is settling unfinished business.  Price could still head lower but at the least we know we are coming into some solid structure:

10102014_monthlyVP_NQ

Turning to our state map, the intermediate term timeframe, we can see that the last time we traded down at these levels was back in early August and when we did, the region just below our current swing low was traversed rapidly.  The initial surge out of August swing low left a gap behind.  The gap-and-go was strong support when it happened.  We had conviction in the long at the time because of it.  Now we are back here, and the area becomes a candidate for retest.  This does not mean it must happen, however we have an expectation it will and if instead the market cannot then we can see the other side, or buyers, emerging.  I have highlighted this gap and other key price levels on the following volume profile chart:

10102014_intterm_NQ

We are currently priced to gap below yesterday’s range.  Any time the market opens outside of the prior day’s range we know prices are out of balance.  For a moment yesterday we thought balance may be forming however this open suggests we are still discovering value.  Pulling up the city map, I have highlighted the short term levels I will be observing on the following market profile chart:

10102014_marketprofile_NQ

Comments »

Expectations Verses Reality

Trade volume is high overnight in the Nasdaq futures after we printed a 3rd standard deviation range during yesterday’s session.  The session range overnight is within the realm of normal even under the high volume circumstances.  Prices managed to take out yesterday’s high of the session before finding sellers and the selling accelerated just before we heard from the Bank of England who released in-line Asset Purchases and Target Rate Decision.  Initial and Continuing claims were released at 8:30am the claims were lower than expected suggesting the labor market is improving.  The initial reaction to the jobs data is a slight bounce.  Mario Dragi is set to speak at 11am which has the ability to move markets.

Yesterday’s move was large enough to consider returning the intermediate term timeframe to balance.  Thus I have added a profile to the left of the chart which encompasses the range of recent balance and also gives us a good view of the auction taking place.  I have noted the key price levels on the following chart:

10092014_intterm_NQ

On the short term we can see how elongated the market profile became during yesterday’s large move.  This type of structure suggests buyers sharply rejected lowers prices with a strong response.  Whether they have the conviction to defend their progress today will be key because the expectation is they will, at least for a day or two.  I have noted the key price levels I will be observing on the following market profile chart:

10092014_marketprofile_NQ

Comments »

FOMC Day Expectations

Nasdaq futures chopped about in an active session of trade overnight after yesterday printed a directional distribution-type day.  The primary expectation after yesterday’s distribution is chop with a downward bias.  The wildcard today comes in the afternoon, where the market will receive minutes from the September FOMC meeting.

Yesterday the market went neutral early.  Prices wasted little time range extending higher in the morning and pressed into Friday’s range where we found responsive sellers who pressed us through the initial balance and out the other side.  We were in a neutral print before noon.  When buyers made a second attempt higher they could not and choppiness gave way to afternoon selling.  The neutral extreme type print carries strong directional conviction by the sellers, second only to the trend day.

Below current prices we have the strong buyer reaction from last Thursday.  Whether buyers carry the same conviction today will likely be tested.  If not, then price is likely to continue discovering lower in an attempt to find a buyer.  Below last Thursday’s low we might begin to explore the 8/12 price range where an open gap and naked VPOC exist.  Have a look at the cumulative delta on the bottom of the chart as well which emphasizes the strength of the selling pressure yesterday.  I have noted these prices and other observations on the following intermediate term volume profile:

10082014_intterm_NQ

I have noted the short term price levels I will be observing on the following market profile chart:

10082014_marketprofile_NQ

Comments »

The Battle for 4000

Interestingly enough, when we first traded up to 4000 in the Nasdaq futures back in August (at the time we were trading the September contract and the ‘spot’ was a bit different) the market gave the price no thought and simply pressed through it.  Demand was high.  Even more interesting is how the market is currently coming to terms with the millennial mark.  As we approach US cash trade, price is straddling the 4000 handle after building support in the region during yesterday’s trade.

There were some fast selling rotations occurring overnight around the time the Swiss were releasing various economic data points, none of which were particularly soft.  During today’s session look for a reaction to the UK’s GDP estimate around 10am.  Aside from that we have some Fed speakers at 2:30pm, 3pm, and 4:30pm ahead of tomorrow afternoon’s FOMC minutes.

The intermediate term has a clear downward trend in tact as we enter Tuesday.  This can be seen as a series of lower highs and lows.  The most recent low was sharply rejected by a strong buyer response.  However, it had to cut pretty deep to find a vein of buyers who were willing to participate.  Buyers may be working on printing their first higher low since the failed auction on 09/19 this week.  They did however leave a bit of unfinished business below.  When we gapped higher on Friday price managed to close the range gap, or the space between the high of Thursday and the open on Friday.  This increases the probability of a full gap fill to the closing print down at 3977.25.  Should the market begin to soften at any point today, this will be a simple target for the sellers.  I have highlighted this observation and others on the following volume profile chart:

10072014_intterm_NQ

Short term, we printed another distribution-type day where the bulk of volume occurred at or near the lower quadrant of the session range.  This managed to push value lower.  The buyers were active and responsive to defend Friday’s buying tail.  This can be seen as the thin market profile near the bottom.  Note however that the coinciding volume profile suggests much business was done near the lows.  Overall, it provides us many interesting levels to observe and I have highlighted them below:

10072014_marketprofile_NQ


Comments »

Bulls Will Need To Take The Initiative

Overnight volume in the Nasdaq futures slowed dramatically ahead of the 8:30am release of Non-farm Payrolls and Unemployment Rate and spent most of the session drifting higher.  Prices managed to take out yesterday’s high and sustain trade above those levels ahead of the release.  As one might expect, volumes increased after the 8:30am numbers which showed unemployment rate unexpectedly dropping to 5.9% but a mixed message overall with average pay still compressed.  The initial reaction is higher prices.  At 10:00am we have ISM Non-Manufacturing Composite on tap.

As we head into Friday, the intermediate term timeframe is in seller control.  This can be seen as a sequence of lower highs and lows on the following chart.  You might have noticed yesterday that there is only the blue volume composite on the right edge of the chart.  That is because we have no micro-balance forming.  Instead price is loose and discovering value.  When the market trades lower it is searching for motivated buyers, yesterday’s strong responsive buy suggests we might be done looking for buyers, at least on the short term.  Once they are found the auction begins in the opposite direction until buyers dry up and seller response exceeds demand.  Since the bulls lack control on this timeframe, they are currently guilty until proven innocent by printing a higher low and higher high at the least.  I have marked the key low volume nodes and a few other observations below:

10032014_intterm_NQ

During the first three or four days of the month there is an expectation for increased demand in the marketplace.  At this time, many of the institutional funds receive cash inflows from regular folks making fixed contributions to their 401k and other investment plans.  There are studies proving this phenomenon.  The question is how much funding is put to work and what is its impact on the marketplace.  I have noted the key short term levels I will be observing on the following market profile chart:

10032014_marketprofile_NQ

Comments »

Seller Control

Nasdaq futures had another busy overnight session where volumes continue to run at an above average clip.  The main feature of the overnight session was a strong rotation of buying which began just before 5am and just above yesterday’s low of the session.  Synchronizing loosely with the move was economic news from the Euro-Zone where there PPI numbers came in a bit softer than expected.  At 7:45am the ECB announced it would keep its Bank Rate inline with expectations and as we approach cash trade Mario Draghi is speaking at a rate press conference which is stirring prices lower.  We have factory orders at 10am and our premarket seller is again active.

Since this chart took out a significant reference zone yesterday, let’s revisit the weekly chart of the Nasdaq composite.  Price is currently pushing below an area previously inhabited by sellers.  Thus, the market was not yet able to convert this resistance into support.  After rotating the gap zone and printing some long legged dojis we have decidedly pressed lower.  Bear in mind however, there are two trading days left in this week which might significantly alter the appearance of our current candle.  The long term trend is still up, however this small move could be the start of a neutral environment on the long term:

10022014_weekly_NQ

Intermediate term we have gone into seller control.  This can be seen as a series of lower highs and lows.  The question now is where this cycle will end and how the next leg will print.  There was a very complete feel to yesterday’s trade where we saw a very motivated move, a pullback around the midpoint, a secondary thrust, and then a corrective set of waves.  That daily move settled out a naked VPOC that was left behind at 3967.25.  That’s good news, the market is still auctioning in a very methodical manner.  An argument could be made that the turn is in, however the task of bulls is to prove their innocence because this timeframe is seller controlled.  I have noted the key price levels below:

10022014_intterm_NQ

Finally, I have noted the short term levels I will be observing on the following market profile chart:

10022014_marketprofile_NQ

Comments »

Q4 Context Roundup

Nasdaq futures are down to start the new quarter, and as we approach US market open prices are trading near yesterday’s low.  Late yesterday afternoon the markets were informed the Ebola virus had made its way into the United States.  Other overnight news included mixed manufacturing data out fo Europe, inline manufacturing data from China, and USA ADP Employment change coming in slightly better than expected.  The last four days we have had an aggressive seller working in the premarket session not long before cash open.  They are again active today.  At 10am we have ISM manufacturing as well as Construction Spending.  Energy traders will likely focus on the Crude Oil and Gas/Distillate Inventory numbers at 10:30am.

Furthermore, German Bund futures ripped through prior all-time highs this morning which resulted in a powerful reaction lower in German equities.  Macro conditions are running high however the correlations have not significantly impacted individual equities yet.   And as we approach cash open the Russell is attempting a slight bull divergence on the very short term timeframe.

Again visiting the long term chart of the Nasdaq Composite, we can see prices are in a zone where sellers initially held us down.  Since then, we broke higher, rotated through the dot com gap, and are now retesting the zone from above.  This long term timeframe remains buyer controlled and in a support zone.  Long term bullish:

10012014_weekly_NQ

The intermediate term is balanced with a slight downward bias.  This balance will be 33 sessions old today and we can see a pattern of lower highs and lows emerging.  With the open gap below sellers have something to shoot for.  Thus the intermediate term is neutral-to-slight-bearish:

10012014_intterm_NQ

Finally, the short term came into overlapping balance yesterday verse Monday.  The auction yesterday was very clean and methodical and balanced.  As we are set to open near the low of the session, we will have a fairly early indication of whether prices are trying to head lower or instead accepting and continuing higher.  I have highlighted the price levels I will be observing on the following market profile chart:

10012014_marketprofile_NQ

Comments »