iBankCoin
Home / Tag Archives: $NDX (page 31)

Tag Archives: $NDX

High Demand Price Points

Equity futures are slightly up overnight, snapping the consistent seller control the globex hours have experienced all week.  This presents us with conditions this morning which are different from all the prior days in this holiday shortened week.

As the USA comes online, prices are right in the middle of a balanced price distribution.  There does not appear to be any sort of imbalance in the short term for us to envision scenarios upon.

The buyers are in control of the short timeframe.  They were successful in defending us against the “slip zone” yesterday by exhibiting the same type of aggressive demand at these levels as we had seen during the first go at prices.  It’s slightly odd, because the profile we were printing yesterday premarket has an imbalanced look—and to complete the distribution would have put us well into the slip zone.  This could have started a liquidation trade.

This is an interesting clue, because it signals the buyers were acting with enough haste and force to disrupt the natural process of distribution.  By doing do, they claimed control of the short term timeframe.

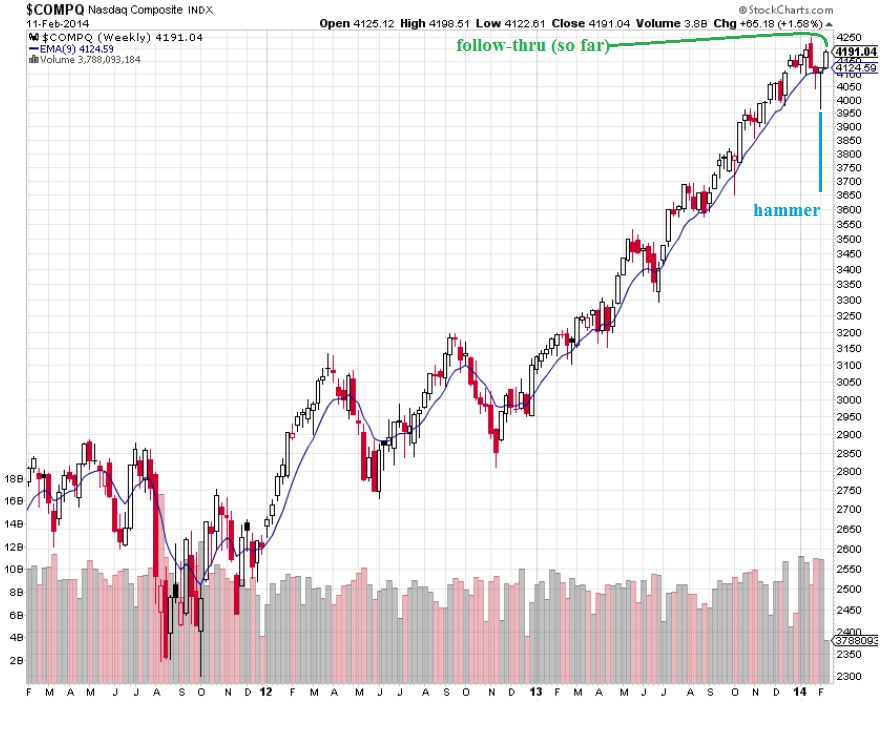
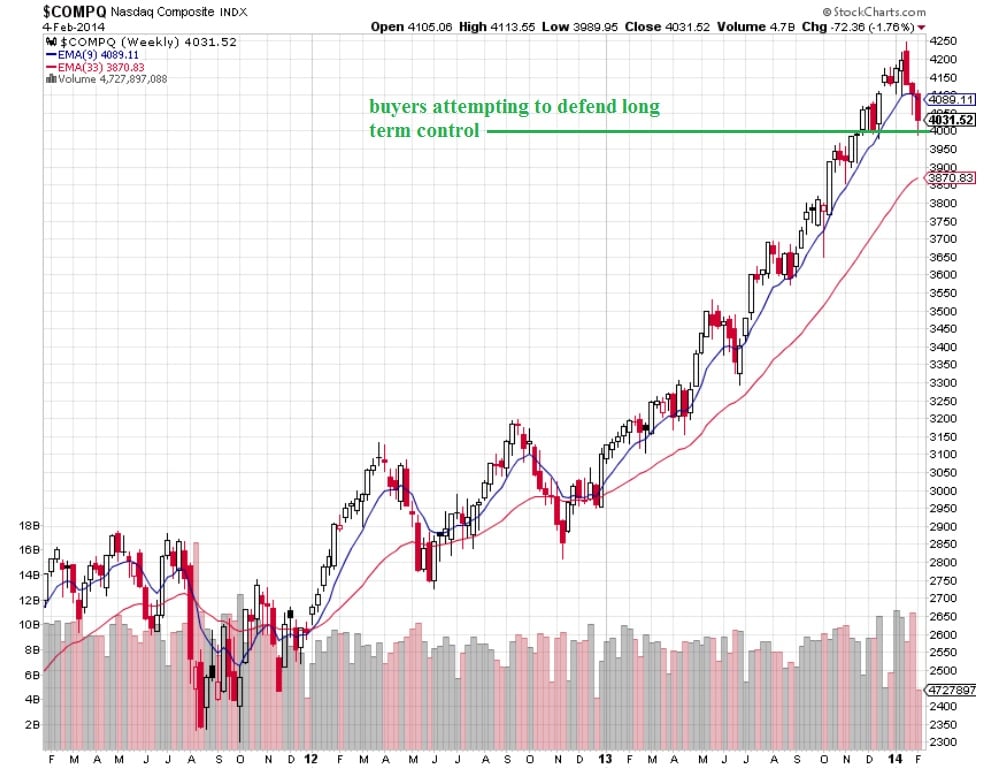
The intermediate term timeframe is balance.  Until we see a higher high, we are in a balancing zone where mean revision is likely.  The long term control is in buyers hands.

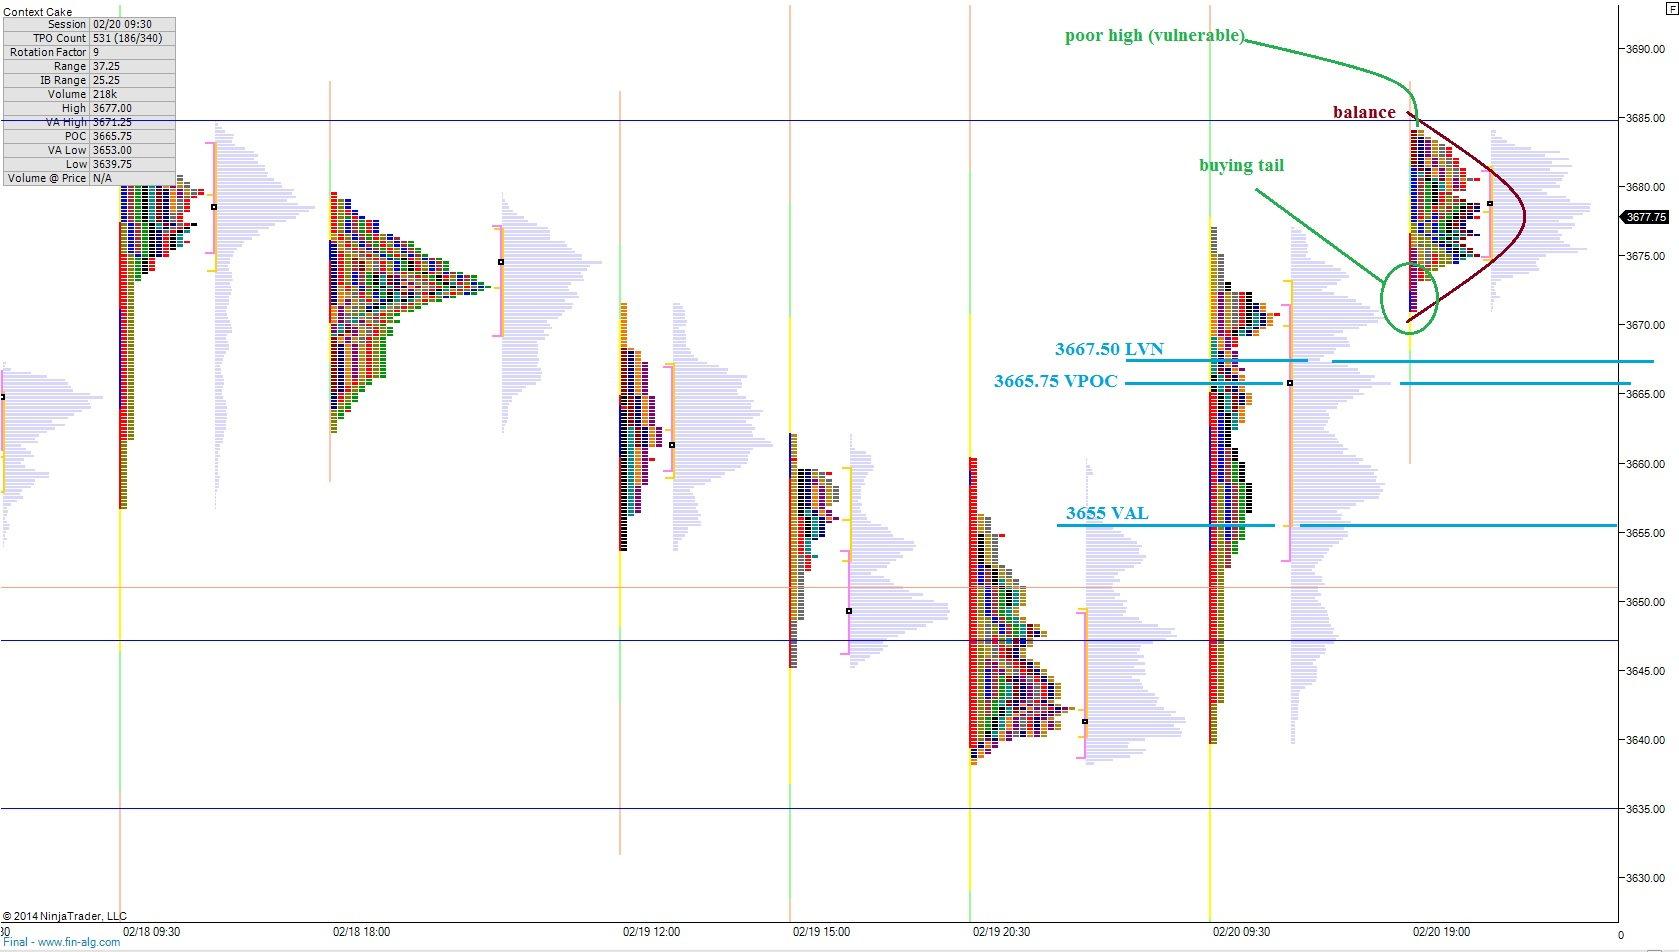
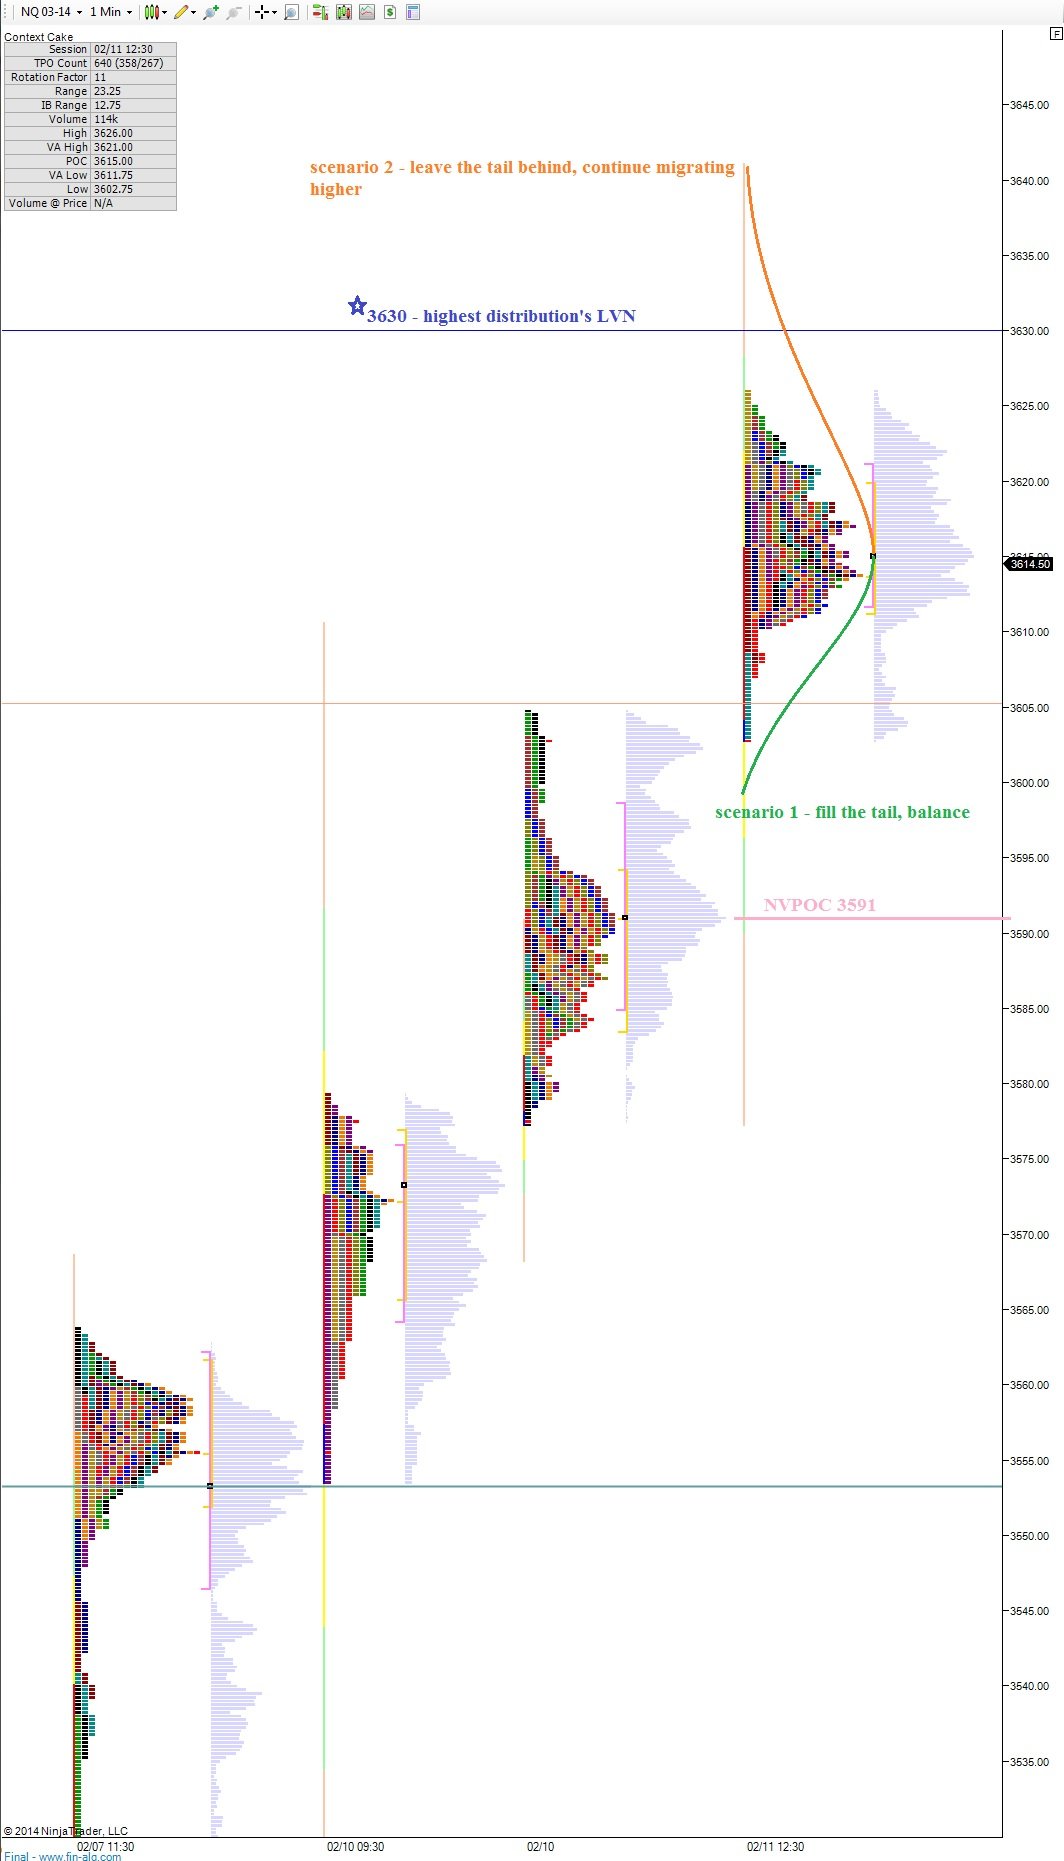
We could get a sense of buyer sentiment by testing lower today to see if demand still exists at key prices like 3667.50 where we printed a low volume node on a surge of orders.  Should we test this level, and not find the same amount of buyer participation, we may continue to test lower to the VPOC at 3665.75 and our value area low at 3655.  I have highlighted these levels and a few other observations on the following market profile chart:

NQ__MarketProfile_02212014

Comments »

Sellers Presenting Themselves

The NASDAQ futures went for a bit of a ride, trading 18.5 handles worth of range while we celebrate Presidents Day.  The futures were working lower this morning until eventually reaching some oversold conditions.  At this point a bit of responsive buying entered and sparked a squeeze.  This action resulted in us first breaking down from the uppermost profile distribution to now retesting that uppermost distributions value area low.

The question now becomes, do the sellers continue to assert their control of the short (overnight/day) timeframe by rejecting a move back into upper value, or do we see the intermediate term long waking up and making things a little less clear for the auction?

The long term timeframe is still nestled in the controlling hand of buyers.  Intermediate term, we continue seeing value migrate up with little in the way of a pullback.  The rally is becoming a bit aged, but one would be taking a difficult trade to attempt fading it before seeing sellers retain their early control.

NQ__MarketProfile_021182014

Comments »

Building Value Via The Auction Process

After last Thursday’s strong trend, the market spent time coming to terms with the new index pricing by auctioning.  This process began Thursday afternoon and by Friday afternoon the consensus was to explore a bit higher for value.  Thus the intermediate term timeframe continued to press on for the buyer.

The long term timeframe is back into the steady hands of the bull camp.  This can be seen on a daily or weekly chart of the NASDAQ composite.  Overnight, prices have rotated a bit higher, in a drift of sorts.

The logical trade early on then, would be to press into that overnight inventory of longs, and see if lower prices can motivate selling/liquidation.  I have highlighted the relevant price levels that developed in a rather large and organized distribution atop our trend.  I will be keying off these levels, should they be tested, to gauge buyer confidence and response.  These levels and more can be seen below on the following market profile chart:

NQ__MarketProfile_021172014

Comments »

The Day After A Trend Day – Valentine’s Day

The equity futures markets were balanced overnight, however rather opportunistic given the large range and impressive volumes.  The actual auction that took place overnight was very organized and saw good participation from both the buyers and sellers who both seem to be willing to participate at these levels.  This suggests we are coming into balance.

However, there was no definitive point of value reached, as the resulting volume profile suggests a slight imbalance exists via the lack of a smooth, bell-shaped curvature.  Instead the profile shows a slight imbalance to the upside.  I have highlighted this imbalance as well as a few key price points and scenarios on the following market profile chart:

NQ__MarketProfile_02142014

Yesterday was interesting and the morning vision work paid off in spades.  Inside 12631, I was taking through the profile development.  Within the first half hour of trade my entire upside scenario had been captured by a strong opening drive. This was OTF (other time frame) action, or the long term timeframe asserting itself on the marketplace.  OTF shows no regard for support and resistance levels seen on the daily and even intermediate term profiles, instead opting to plow money into the marketplace.  It did not take long to recognize the trend day activity and grab on and ride it until the wheels come off.

The NASDAQ seemed to play catch up yesterday, however, while the S&P put in a milder trend, almost static enough to challenge the trend day structure.  I will be watching the S&P today, to see if it can show strength.  Thus far in the AM, it has been diverging from the NASDAQ.  I have highlighted this divergence on the following market profile chart of the ES future:

ES_MarketProfile_02142014


Also, have a Happy Valentine’s day.  Be extra gay and sappy with your special someone.  But don’t forget about the industrial production numbers at 9:15am and consumer sentiment at 9:55am.  Carry on.

Comments »

Shaking Off A Doji Print

Yesterday we printed a tight ranged doji candle on both the SPX and the COMPQ, signaling indecision on the part of buyers and sellers and a marketplace coming into value.  It now appears the markets have found supply up here which needs to be worked off.  We may begin to see the auction process return to two-timeframe action after four solid days of long timeframe dominating the action.

Futures are lower overnight, and sellers are attempting to work down into 2/10 prices on the NASDAQ.  We have many interesting levels below which we left behind during the dynamic push higher.  I have highlighted a few potential scenarios on the day, and also some key price levels on the following market profile chart:

NQ_MarketProfile_02132014

Comments »

Morning Market Context Report

Today is day three of a week that has thus far produced a solid bit of follow through on the hammer reversal candle printed on the NASDAQ composite, see below:

COMPQ_WEEKLY_02122014

Remember, that only one week ago today, the long term control of the buyer had come into question, however we maintained that the buyer still held the control.  One week ago today was the inflection point that tripped the rally:

COMPQ_WEEKLY_02052014

Thus buyers remain in control of the long term auction after being put to the test last week.  Once a market finds a floor, or a lowest bit, it begins the process of finding the ceiling.  This is the discovery phase where price moves quickly in the opposite direction in search of excess that motivates selling.  We can look for a large selling wick perhaps, or even a subtle rejection of higher priced value.

On the intermediate term, we have come into balance, however the point of control is at lower prices.  Intermediate term balance dates back to January 24th.  I would produce a wonderful chart of this intermediate term balance, but my primary charting platform is two days into a massive elroi optimization.  Thus I must estimate intermediate term control VPOC to be around 3553.

Short term, buyers are in control.  This can be seen via the migration of prices higher, aggressively.  Value areas are not even overlapping yet.  This is strong market activity.  Before the sellers can regain control in the short term, they will first have to create some overlapping value.

I have sketched out a few scenarios for the day, as well as marked a few key price levels on the following 24-hour market profile chart:


NQ_MarketProfile_02122014

Comments »