Volume overnight in the Nasdaq futures ran on the low end of normal as prices traded slightly higher on the session. The economic calendar was fairly quiet with a few data points coming out of Japan. The Yen trade balance beat expectations while Consumer Confidence is the east was lower than expected.
Most of the discussion surrounding volume centers around time-duration volume and often on a per day basis. However given the right data, like raw tick data streaming from the IQ Feed servers, you can map other dimensions of volume like at-price and cumulative delta.
Volume at price produces the price levels where our attention might yield an area of interest to gauge sentiment and trade from. Cumulative delta can show us who is more motivated to take action in the tape.
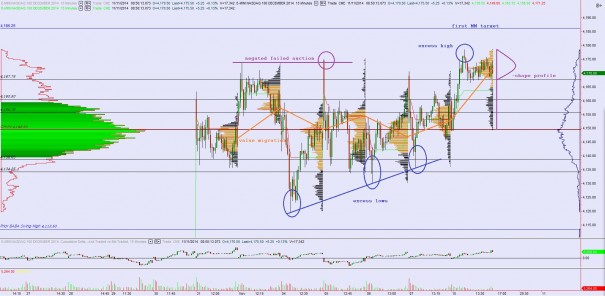
Yesterday the market gap slightly lower found responsive buyers. These buyers were responsive to the open, but initiative in nature on the intermediate term. They initiated risk away from the VPOC of the then 6-day (now 7-days mature) volume profile. The resulting print pushed value to new highs.
This might be a bit less clear since doing away with the market profile charts. However they were a bit redundant and using only the below presented chart frees up precious screen real estate and requires one less chart to monitor. You might not as clearly see it as before, but Monday printed a P-shaped profile suggesting early OTF strength (active intermediate term buyer) which caused a short squeeze. In the context of a downtrend, these often occur at-or-near a peak. In the context of an uptrend they are not as effective. All we know is value migrated higher but is still contained in the intermediate term balance.
The third dimension of volume is delta. It can be seen in the bottom pane of my chart window and suggests buyers were the more active participants for the entire duration of the session. That has been the case for six of the seven days of balance up here. It could mean two things—a large seller is resting on the offer and absorbing all of this demand which creates sideways price action amidst motivated buyers. Or it could suggest pressure building for another thrust higher. If we continue to balance and delta cannot flip to negative then we are likely to continue grinding.
I have highlighted the key price levels I will be observing on the following volume profile mashup chart:
If you enjoy the content at iBankCoin, please follow us on Twitter


Was great meeting you Raul and talking some of the more rudimentary questions I had on futures. I’m going to compile a list of other n00bish unknowns over the next while. Do you have an email I can reach you at good sir? Will be going over those market profile videos you did for us in afterhours again as well.
eMVPholdings at the gmail
Hi Raul. Great meeting you sir. I have a couple photos for you. Where can I send them?
eMVPholdings at the gmail