Four hours of continuous buy flow impulsively ripped through the globex marketplace this morning. The move is being attributed to an ECB corporate bond buying plan according to a few media outlets. The ‘why’ of a move is often the focus of media outlets, but we focus on the ‘how’. We know for certain a dominant buyer overnight rejected us away from yesterday’s prices. This puts the Nasdaq out of balance as we approach cash open. Our next job is to assess how RTH participants react to this new development.
There is a general consensus of skepticism surrounding the market bounce currently taking place. The dip lower that precluded our current market bounce was fast and spanned a wide price range. This leads many to suspect any bounce will eventually roll over, likely before attaining new highs.
That theory becomes a bit thorny as we enter today’s session. We are now pushing into a zone where the market is likely to find sellers, however if they instead back off the tape we have a high velocity move underway which could carry us to new highs.
Buyers were impressive yesterday. The session started with a strong push higher, lingered for the rest of the day, and finally made another thrust up into the bell. Looking at the daily chart below, we can see prices probing a prior area of support which also features a high volume node. It appears we will ‘test through’ this zone to the LVN on the other side before determining if this zone will be converted into resistance. On the whole, this is the first real pullback since this move started. I have noted the motivated move lower, its midpoint, and a few other observations below:
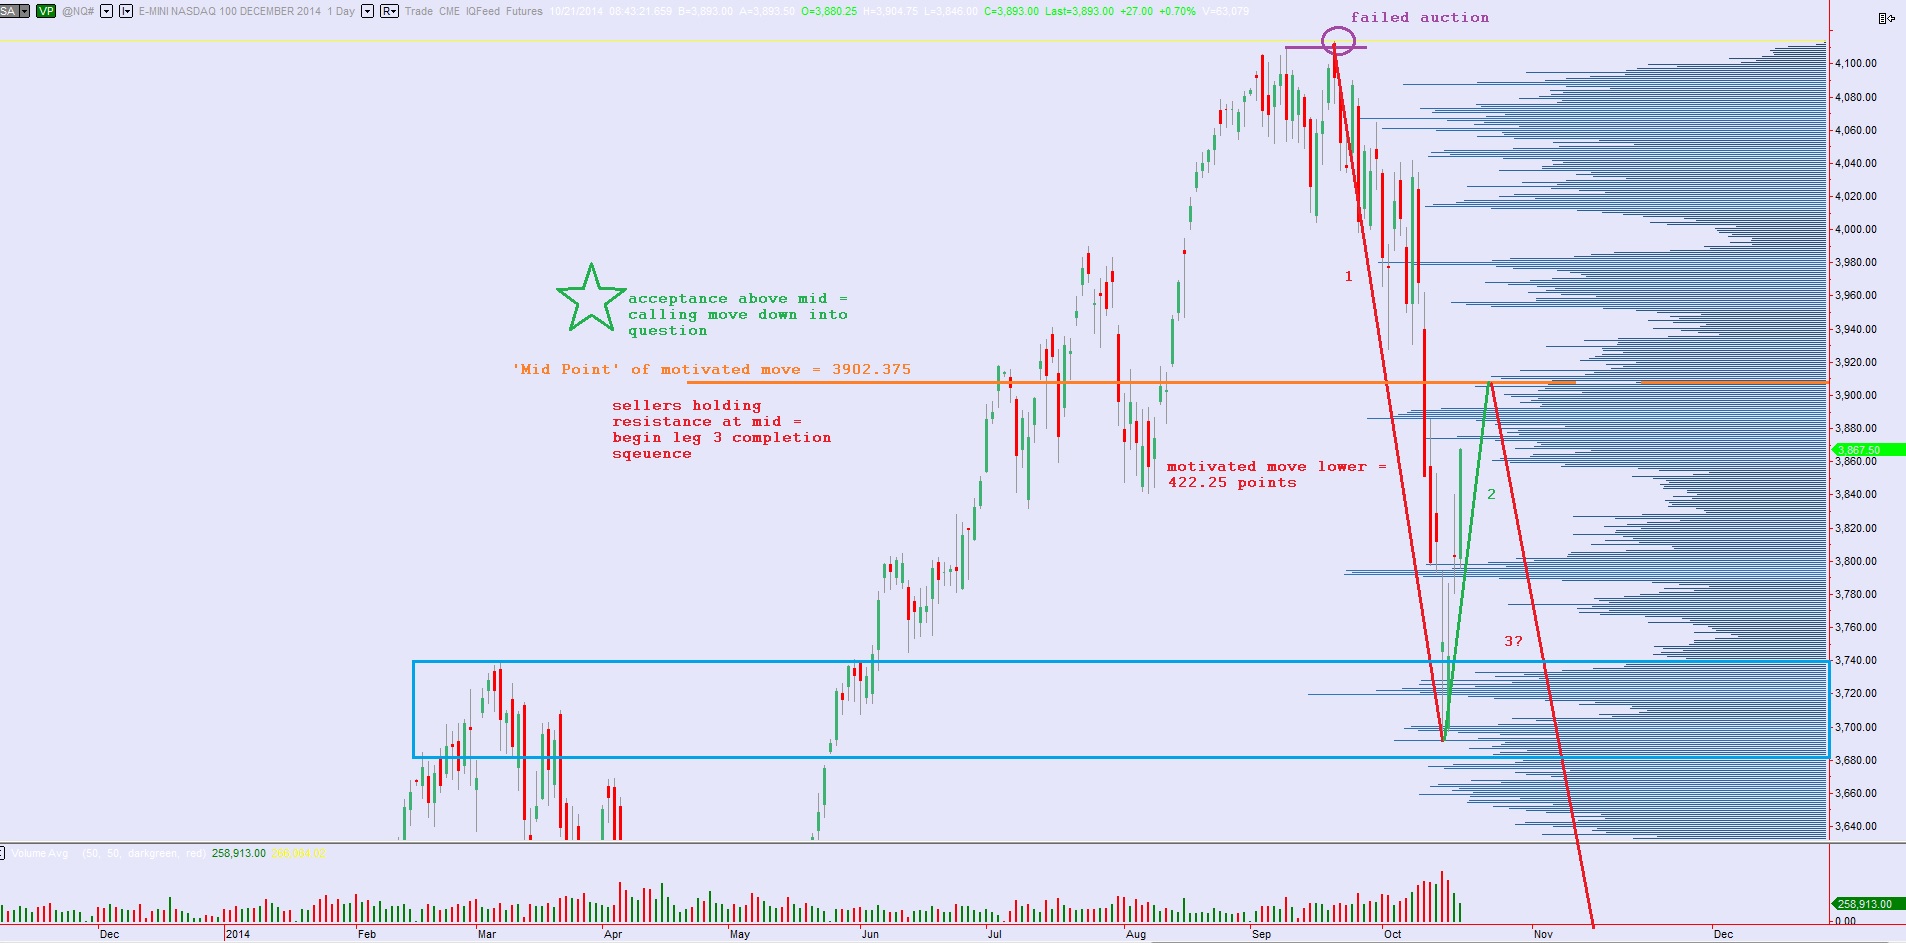
We always observe the midpoint of a major move in the marketplace. Major is relative as the markets produce similar patterns on multiple scales and timeframes. This is why you hear the word fractal thrown around in these parts. Put simply, the mid is a simple number to calculate and observe which makes it easy to run statistical analysis on, build trade ideas on, and build executing algorithms upon.
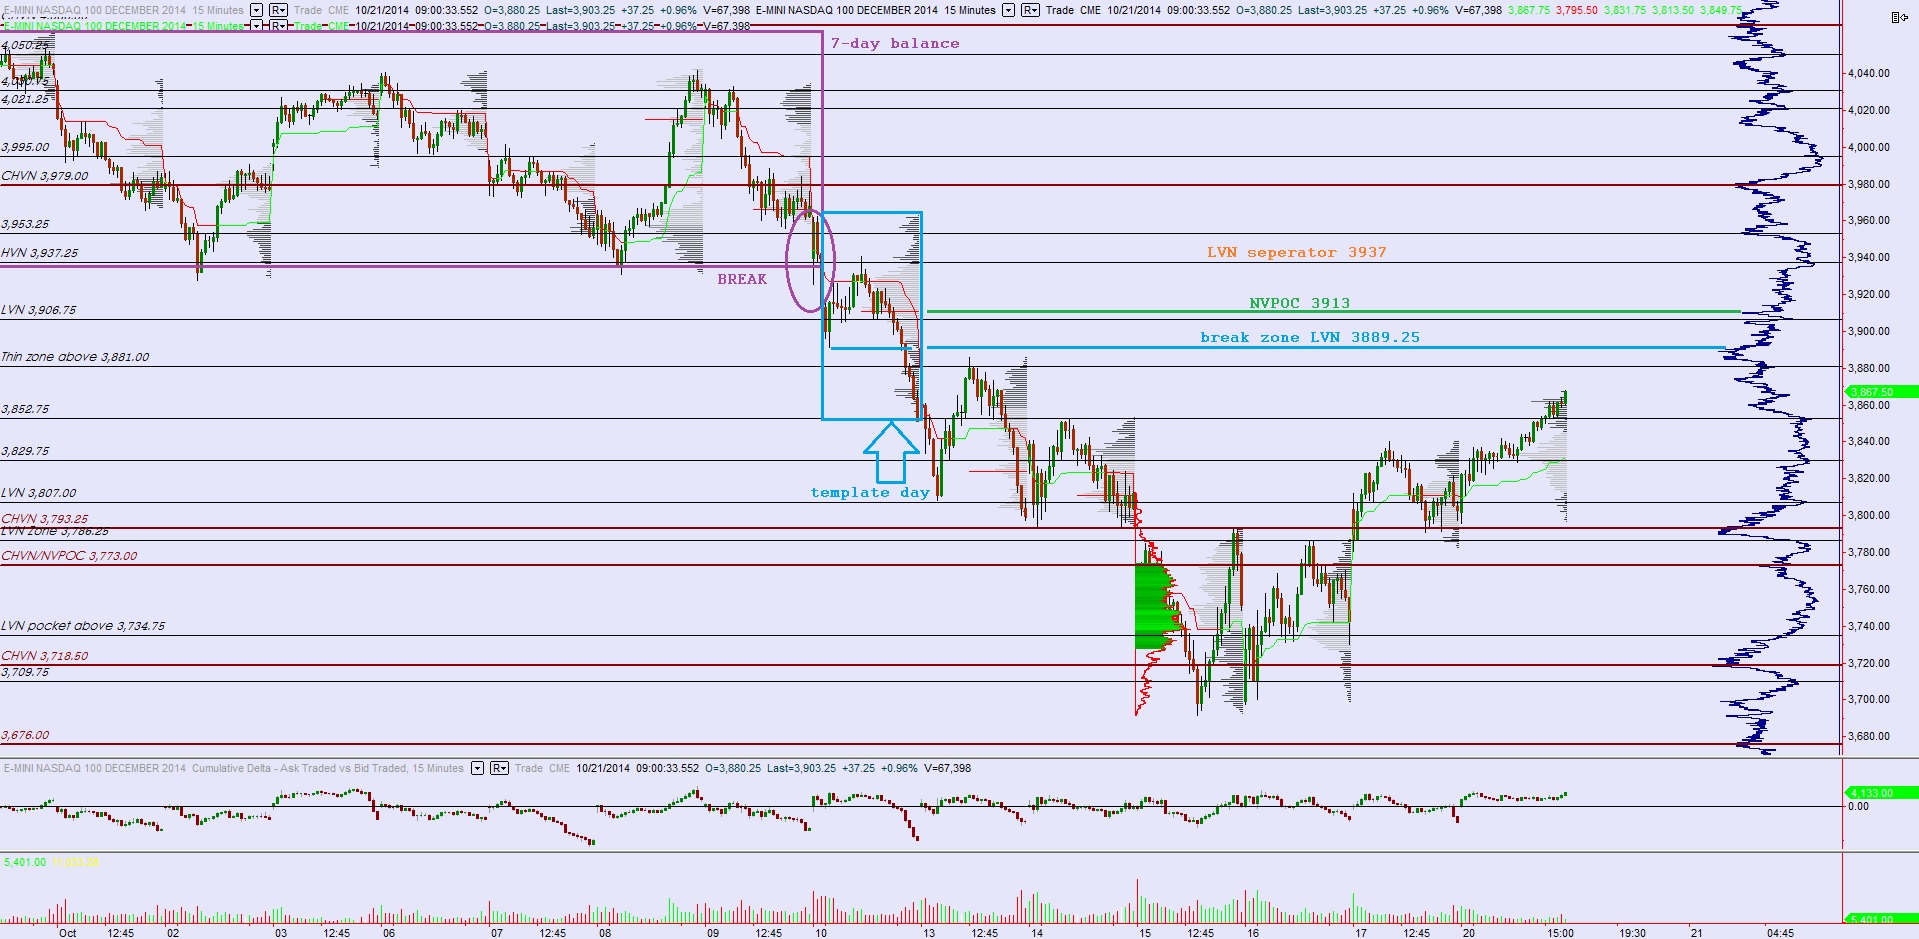
On the shorter 15-minute timeframe we can see the market is returning to its normal function of balance-discovery in a quest to determine value. The recent low printed a clean balance volume profile before we began exploring upward. Now price is probing into the volume profile printed just after we left a 7-day balance and only moments before we printed the fastest leg of the downward move. This is our template day of volume-at-price to observe for today’s trade. I have highlighted the key price levels I will be observing on the following chart:


Momentum day, right? NQ is taking out its conviction day not long ago.
Extreme breadth readings in adv/dec, uvol/dvol, etc.
there was a moment near the open where sellers had a fairly decent shot to grab early control, they blinked, since then a one timeframe up session, 2nd standard deviation range for up day, cum delta is meh~can’t quite stay green, rechecking the upper balance zone to see if sellers still want to defend it. Expecting some follow thru to the upside tomm if we close in the upper quad