In order to succeed in any business venture, be it trading or startup or corporate monotony, one must have a plan. It does not matter if the plan is perfect. Once you have a plan, you can respond to live conditions as needed, always returning to the plan drawn out during a calm state-of-mind. There is no free lunch ever, and with trading you can end up being lunch. The best traders I have ever met work incredibly hard. If you want to succeed, you should too…and have a plan.
We are working through a correction. It just so happens this correction is different than all the others because it is happening in January after a strong year. It is also happening with a backdrop of negative news flow—no surprise there. It is also happening on a macro level, with currencies and volatility rearing their lovely head back into the action. This is all very fun, you see?
I tune out all of that. I am trading stocks, many of which are nestled in the NASDAQ 100. Therefore, the behavior of this one indicator can tell me more than any news channel or derivative. I understand being very micro and treating every stock as its own situation, but at the least I will build a framework (read plan) for assessing the index.
First, I run through the control.
Long term control – buyers: this can be seen on a weekly chart. Price has made higher highs and lows since last January.
Intermediate term control – sellers: yesterday’s action put price below recent lows, pressing price out of intermediate term balance. The sellers now control the intermediate term timeframe.
Short term control – sellers: the price action over the last three days has been dominated by sellers. This can be seen in market profile via selling wicks, range extension lower (price trades lower than the first hour of trade), and value migrating down.
Yesterday’s control – sellers, but signs of balance: price action was again in the control of the sellers, however, we did begin seeing signs of balance with price trading back to the midpoint during the afternoon.
Overnight control – sellers: we have a thin volume , wick print on the overnight profile likely caused by the drop in AAPL shares post earnings. This was extended upon before finding buyers at 3465.75.
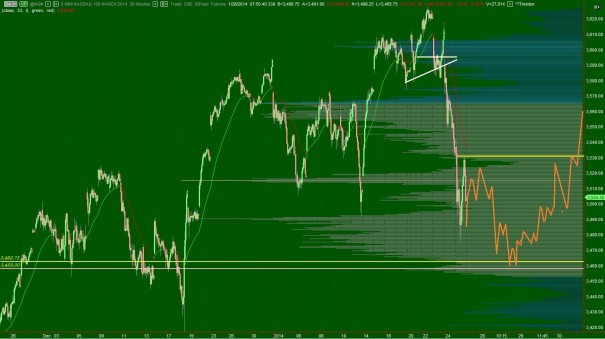
Therefore we can see sellers still predominantly controlling price action. I expect their control to continue as we work through correction. However, it is my expectation also that we are nearing the end of correction. Calling the left side of a sentiment chart is difficult, but I have drawn out a rough road map of what I expect to occur as we close out January and head into February (see below):
The low print you see coincides with a naked VPOC dating back to 12/18/2013, one of Ben Bernanke’s better days of action. Price likes to retest these big “moment” days to see if the catalyst for creating the moment still exists. If not, if buyers do not present themselves at these levels, my take on the left side of the sentiment chart may be wrong, and we may not have seen true panic yet. However, if it holds, we may begin working through the very lucrative process of discouragement, where our micro stock analysis can begin working again.
If you enjoy the content at iBankCoin, please follow us on Twitter


This is nicely done. Thanks R
thanks for reading along J