Belated: Portfolio 01/28/13; A Tad More About $SODA

625 views

Disclaimer: my apologies for the delay on this post.  I had penned what may have been the greatest blog post in the history of man when many of the words were suddenly swallowed by a vat of olive oil (extra virgin, of course) when I pushed the “save post” button last evening (unfortunately the less interesting parts were saved).  Yes, I realize that this information is dated, but wanted to get it out there anyway.

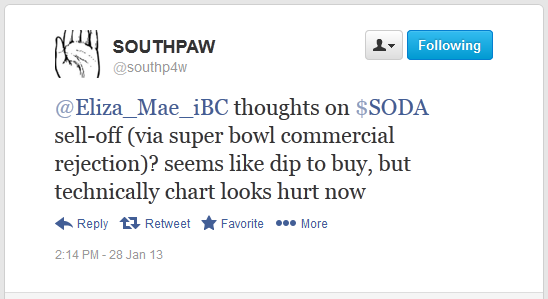
Earlier this evening a Twitter follower named “Southpaw” (I knew I had to be friends with an avatar like that) posed the following question:

As an aside, if you read this blog with any sort of frequency, you recognize how much I enjoy doing reader requests.  If you have a stock you want me to take a look at, feel free to let me know because as far as I’m concerned, we’re all trying to learn here anyway.

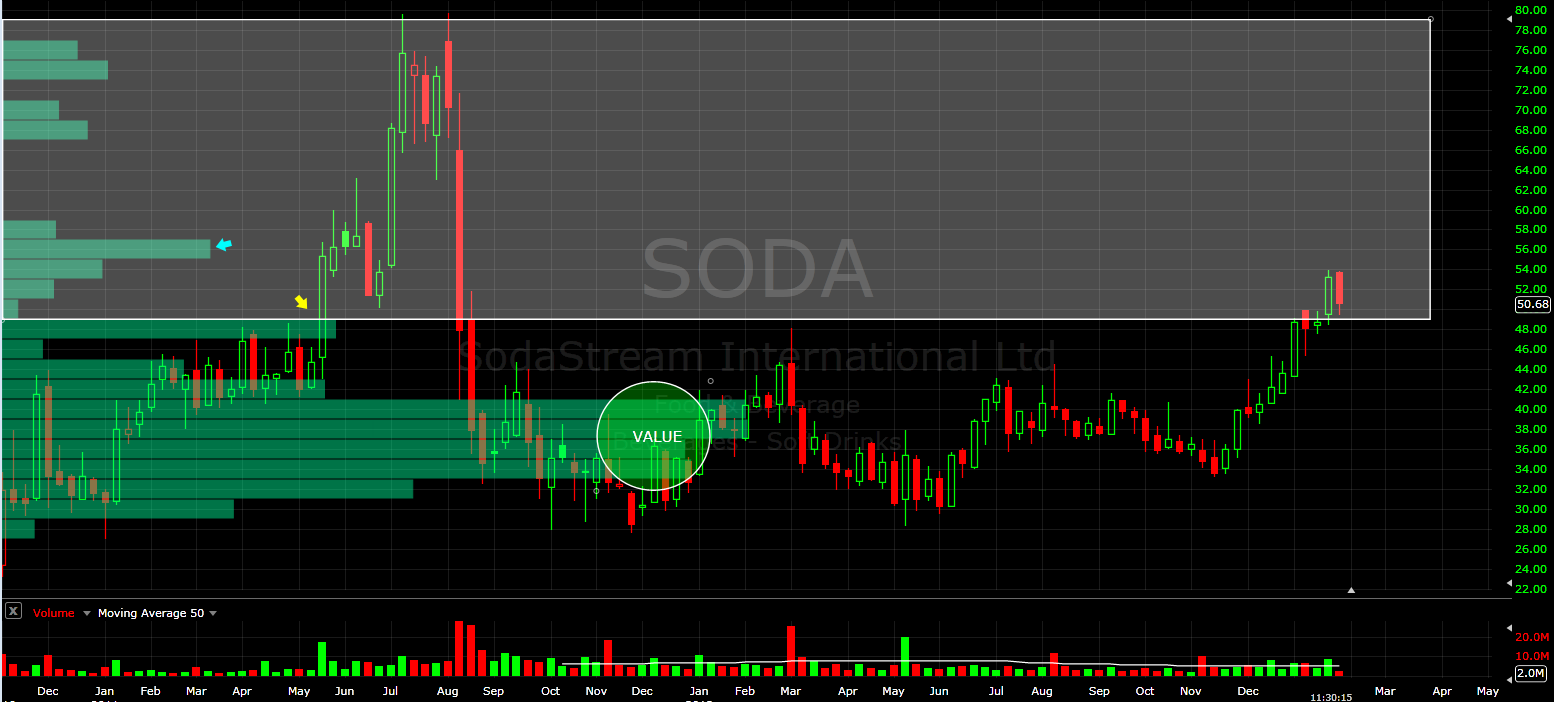
Back to the topic at hand: SODA.  In my weekend “Top 10” post, I had SODA as my number one (1) choice.  My top secret scoring system uses an extremely complicated algorithm which should be of no concern to you at this juncture.  With that, let’s take a look at the weekly.

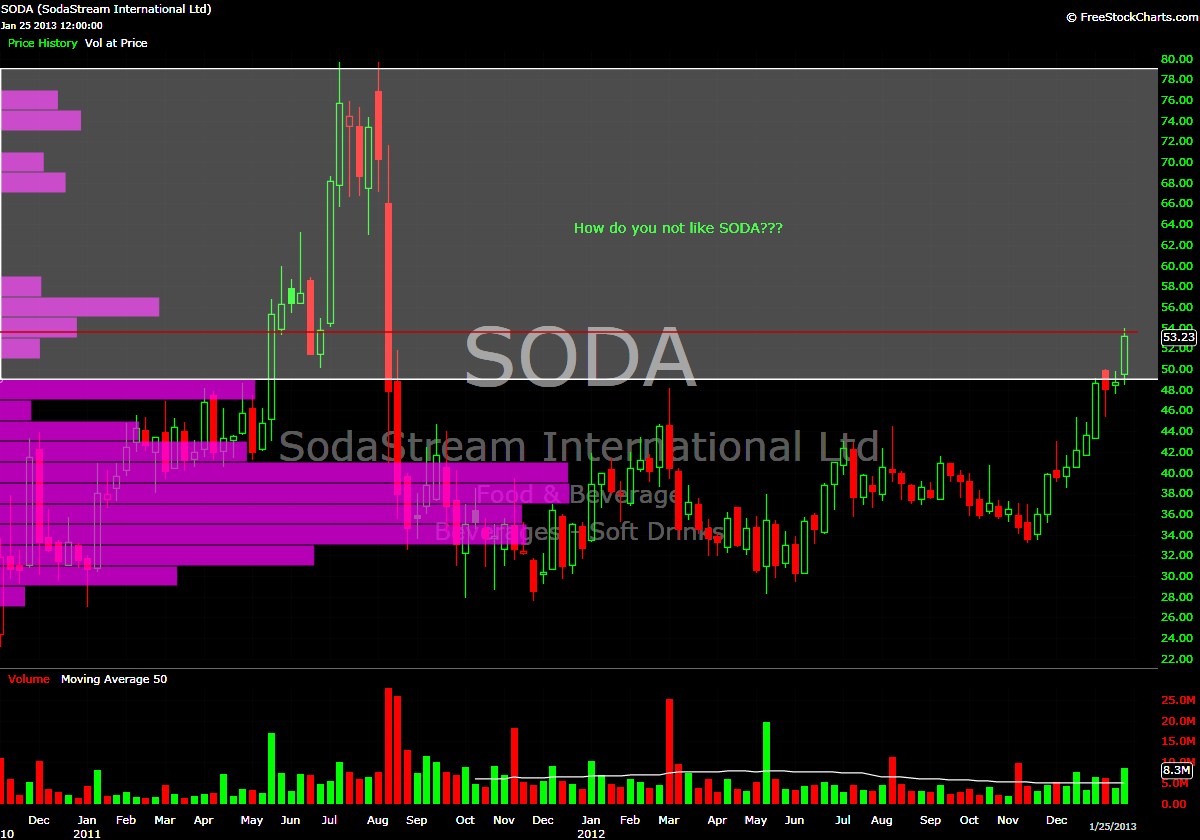
When using PbV to analyze a stock, we need to take into account how much data we have available.  With a stock like SODA that has been public for a little over two years, the volume profile will be characterized and affected by the range of prices.  SODA just happens to have a very large distribution of prices from the low 20’s to almost 80.  With only two years of data and such a large distribution, there are likely to be “voids” somewhere in there.

Clearly buyers and sellers have determined that fair “value” for this stock is somewhere between 32 and 40.

Taking a look at where we are now, SODA does have very little historical volume above 50 (with the exception of around 57 which happens to be the last point of resistance, as signified with the blue arrow).   If price is able to get through this point, it could really run.

To the downside, I would say that 48 is the first (and final, for our purposes, yellow arrow above) point of support.  If price cannot sustain this level, I would go and look for better opportunities.

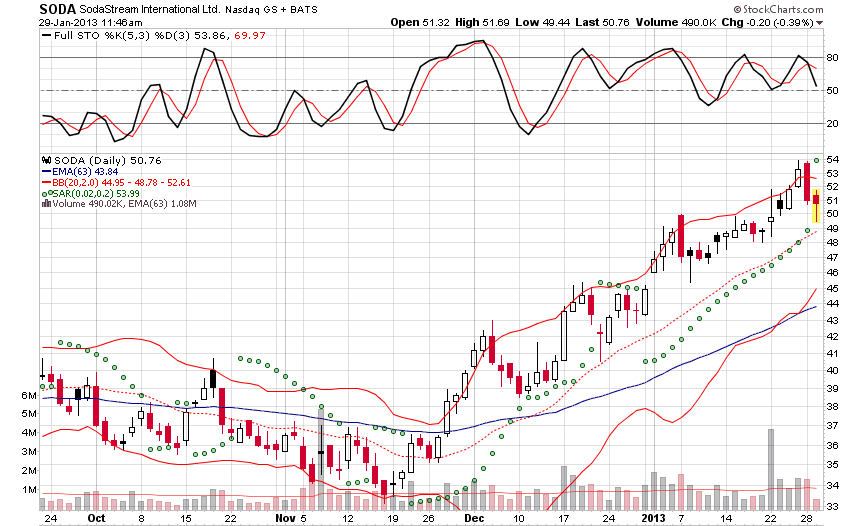
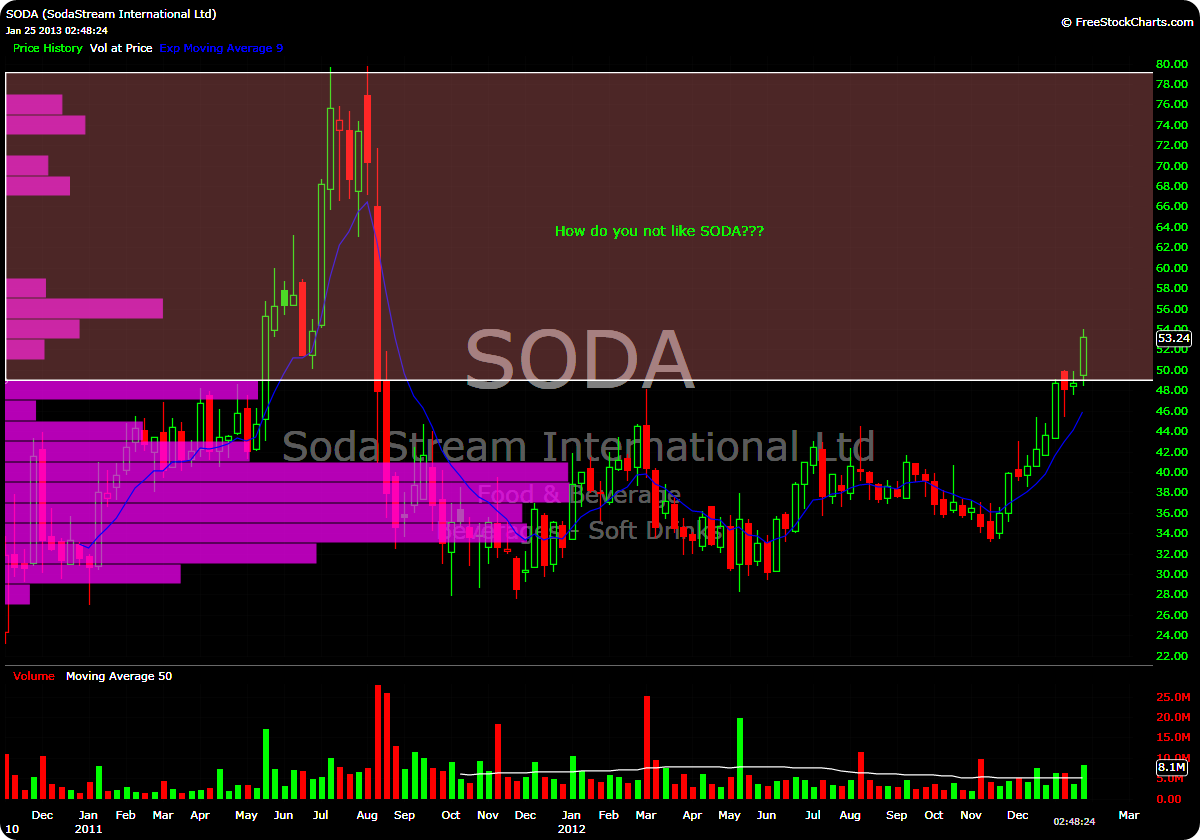
As for the daily:

We have seen this stock violently pull back, meander sideways for a couple of weeks then go higher once this year already.  I think that if it is indeed forming another base here and breaks free, then the next stop is 57.

As of now, I am going to be very patient with this and let the dust settle.  I have a price in mind where I would like to start a position.  All I have to do is wait in the tall grass for it to come to me.

Bottom line: I’m feeling quite bullish on this stock as long as it can remain above 48.

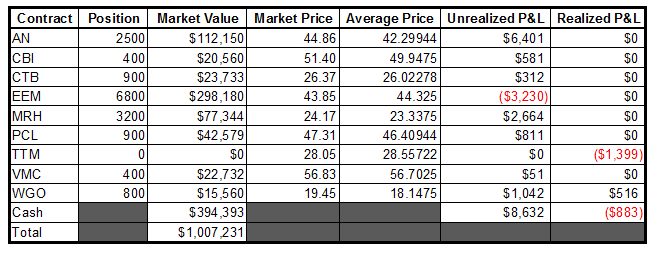
For the sake of completeness, here an abbreviated portfolio update:

-EM

$SODA? It’s Bubbly, It’s Refreshing

412 views

Mr. Costanza poses a very interesting question.  As EEM continues to infect my portfolio with degeneracy and losses, setups like this are keeping me afloat:

I’ll be looking for a consolidation before jumping in, but this one is right at the top of my list of favorites.

-EM

Watchlist Update

294 views

Lots of moving and shaking happening on the volume pocket watchlist.  I posted this table over a week ago and there were only 4 stocks that were within 5% of my predetermined “price of interest”.

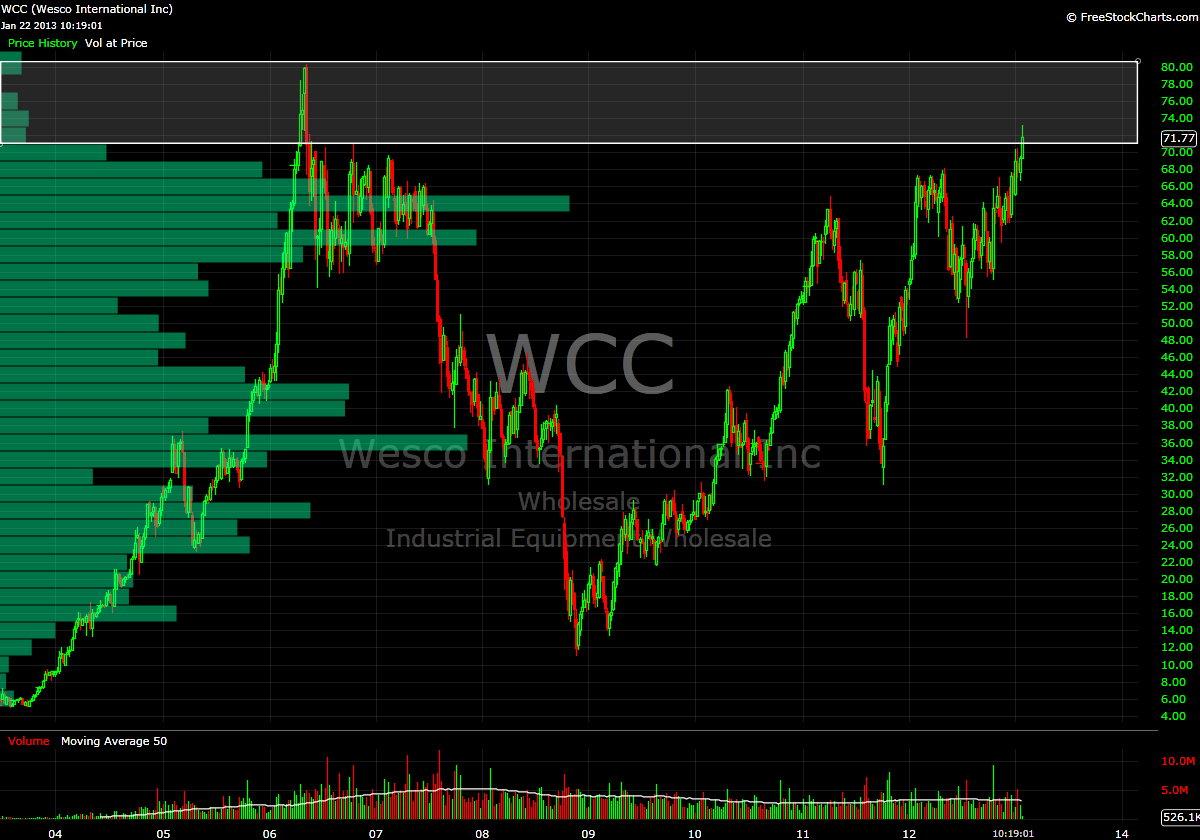
Today we have 13, with two having surpassed that price.  One of these was TPX, which blew out earnings last night and the other was my documented miss in WCC.

Aside from the stocks that are already in my portfolio (highlighted in red), I like the following:

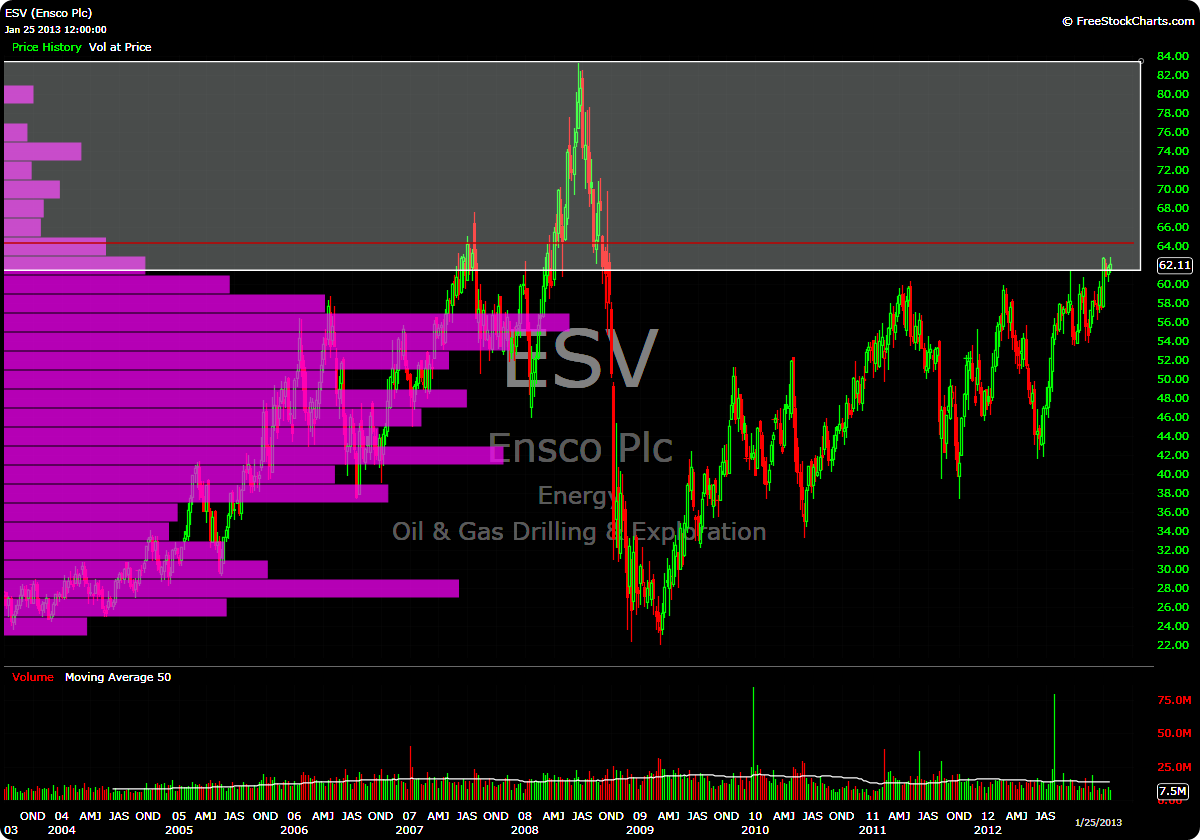
  • ESV on a break of 63, but I’d like to give it a little more room before jumping in.
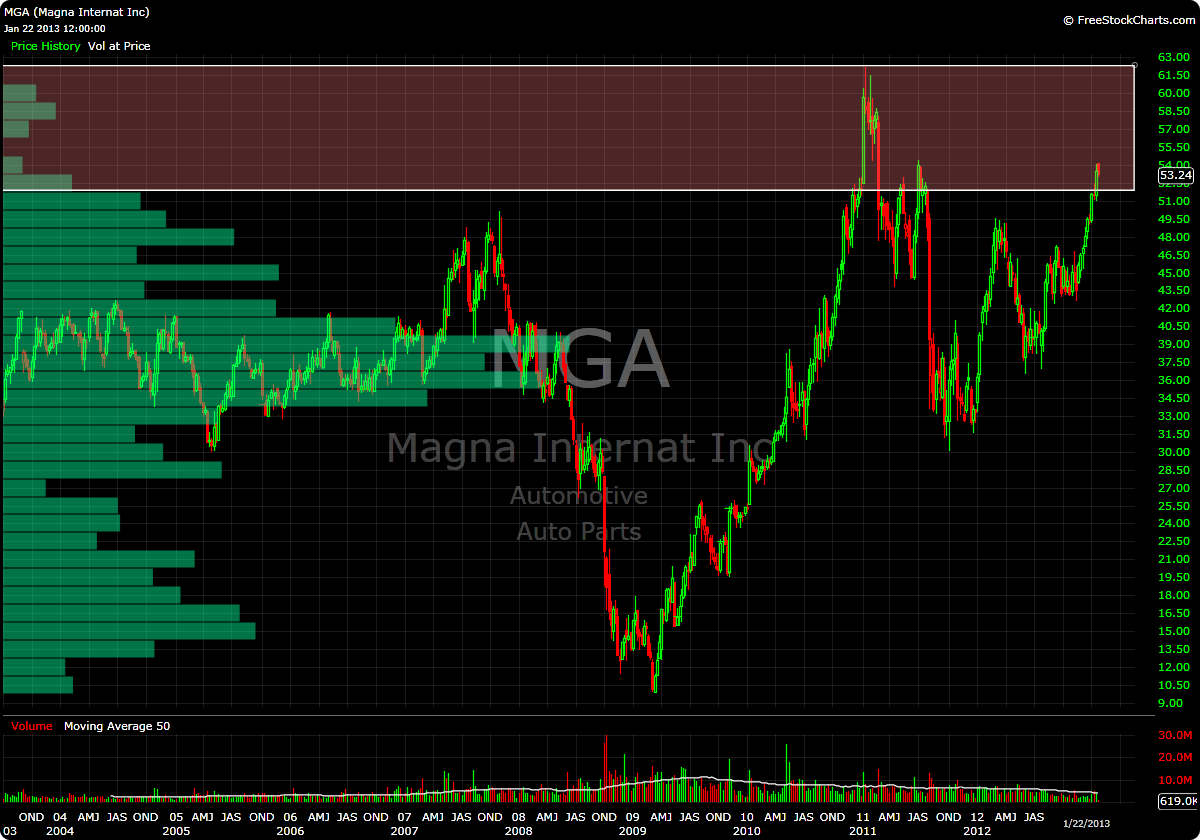
  • MGA on a break of recent highs around 54.2
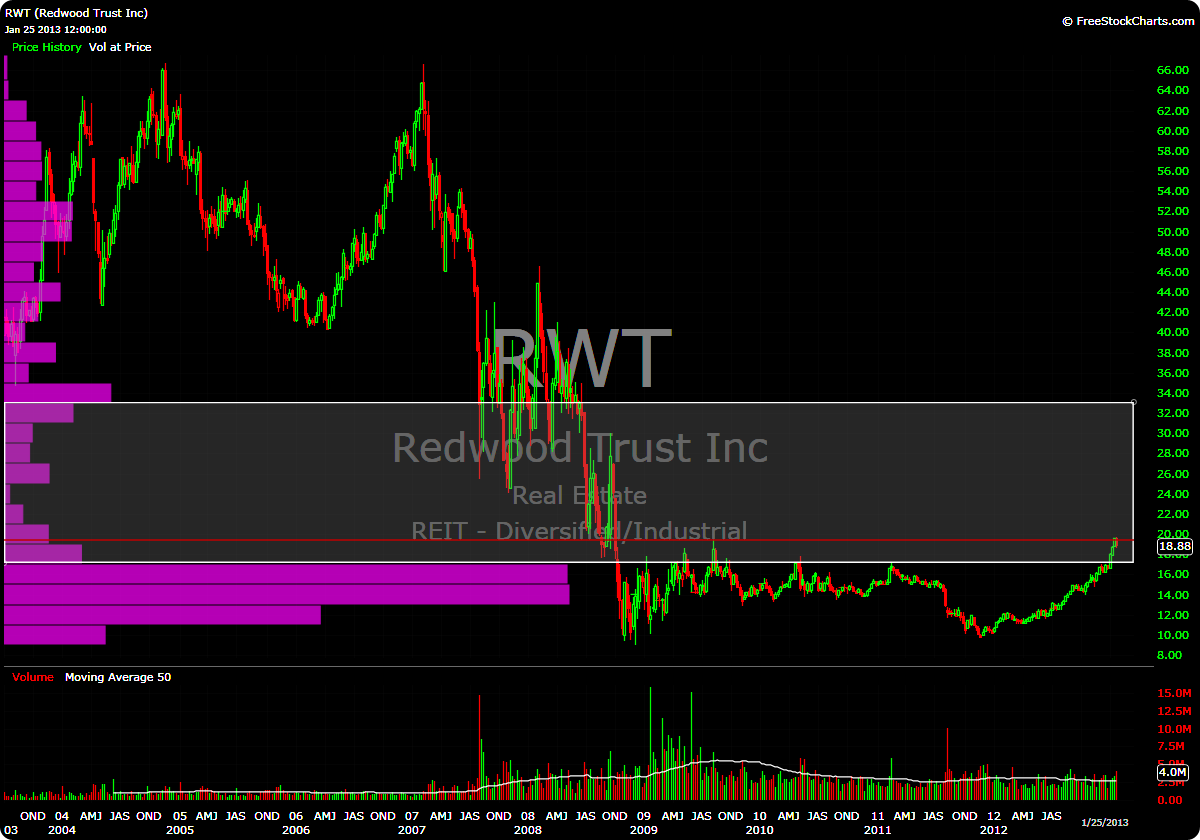
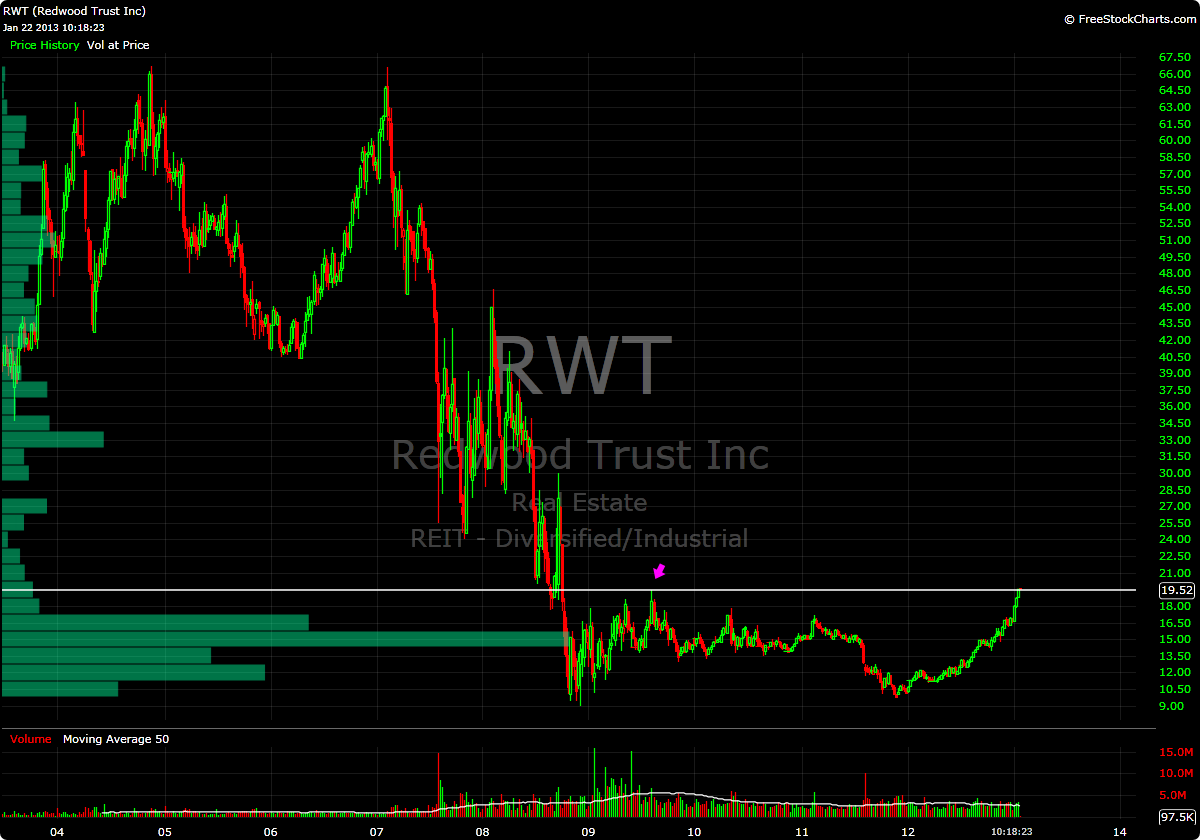
  • RWT break of most recent highs around 19.7

-EM

Go Long $TPX and Get a Better Nights Rest

466 views

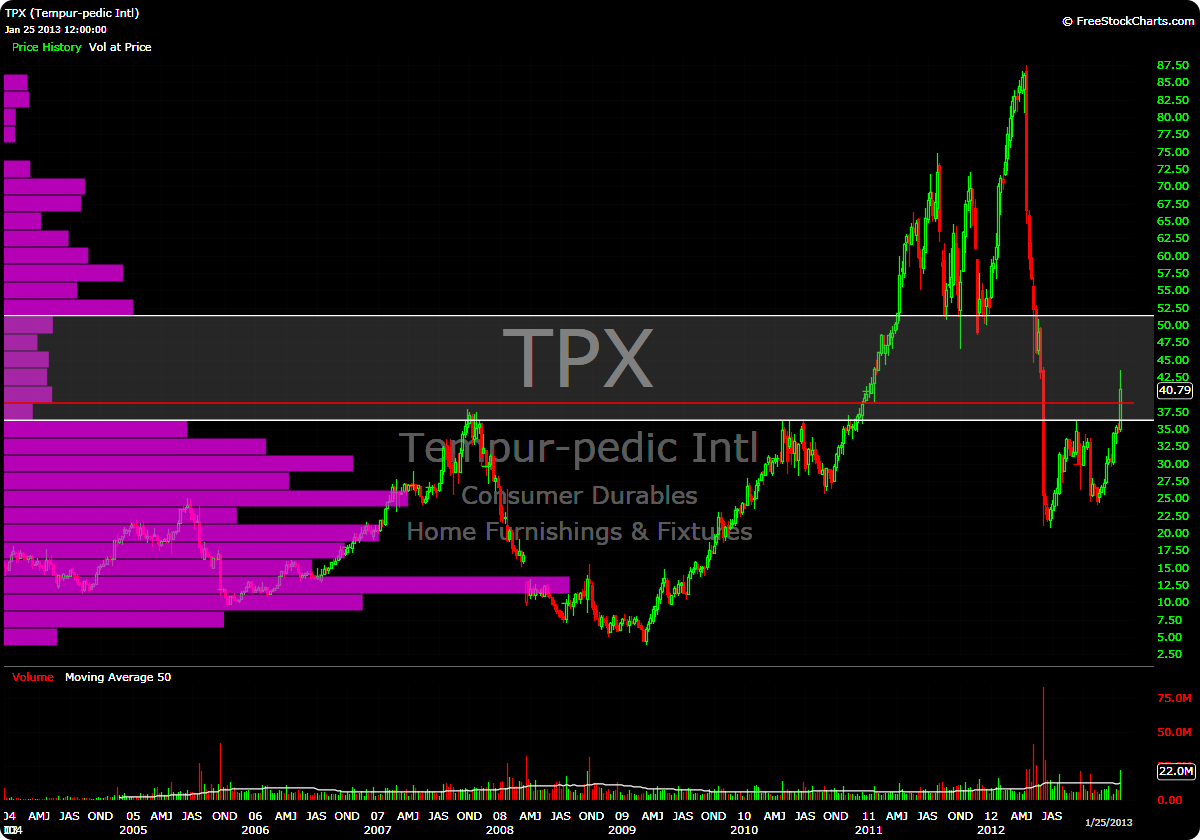
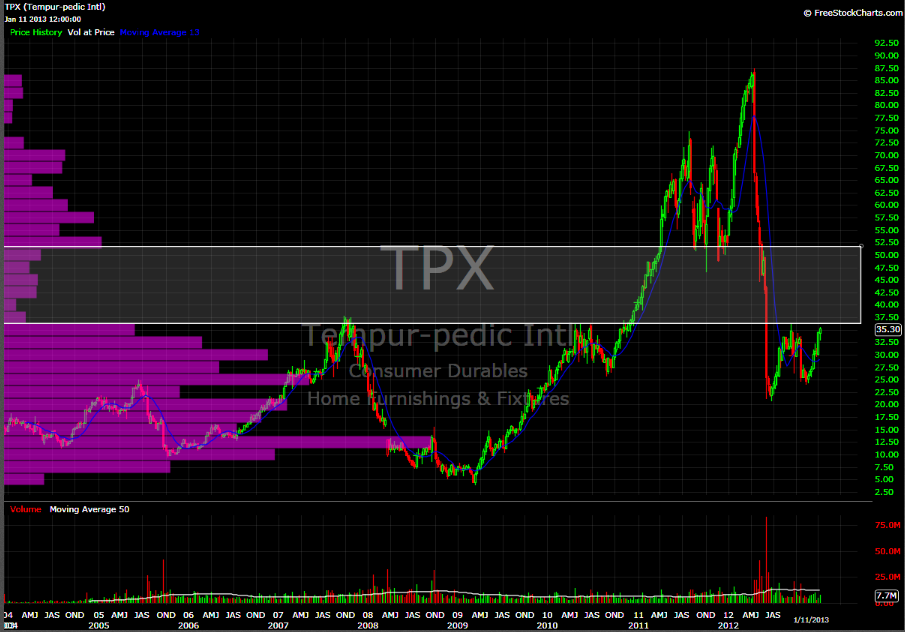
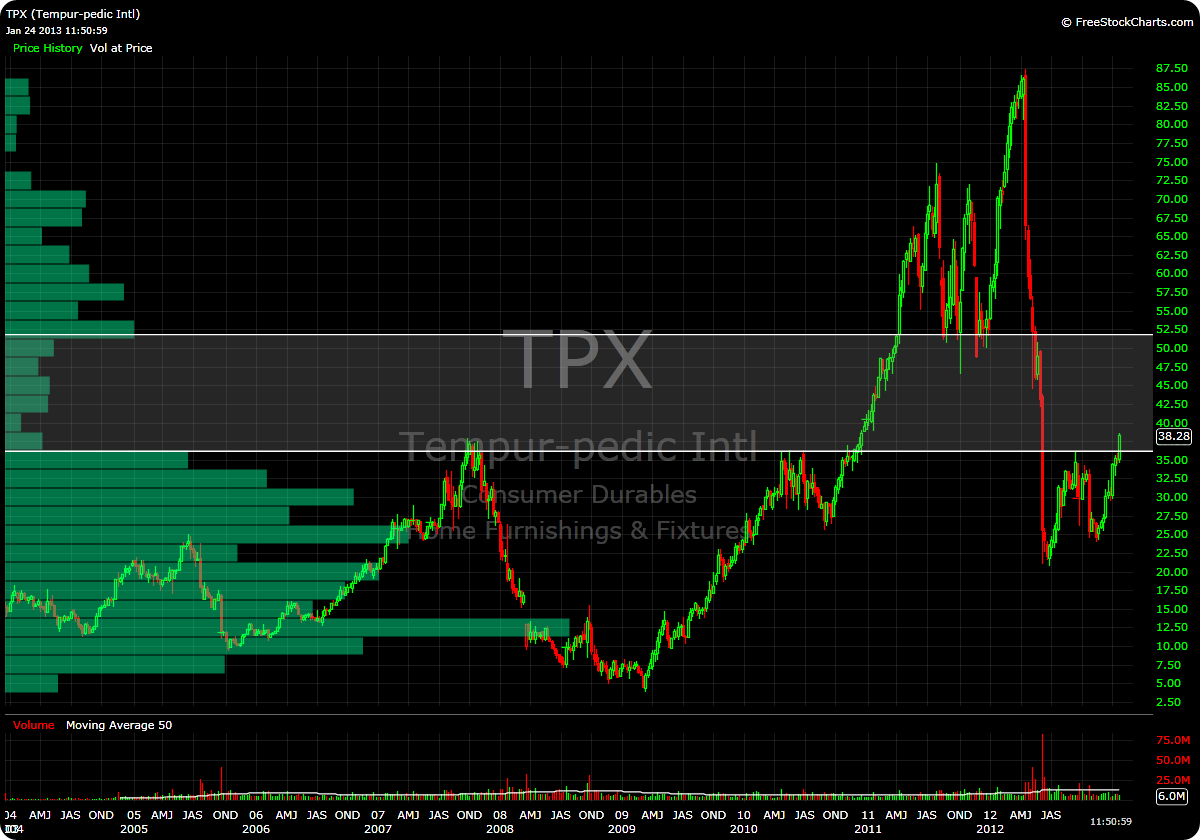
Colleague Raul3 aka @TwoSmuth alerted me this morning that TPX has entered “the void” (why this was not on my watchlist is beyond me, but the glaring omission has been rectified).

A few weeks ago I did some analysis on the stock and noted that the low volume area measured to about a $15/share.  With a buffer in place to try and avoid getting chopped up on the periphery of the LVN, we are very close to where I would consider starting a position in this stock.

I know that I’m none to enthused about buying at the high end of a +9% day, so I’m going to sit by and wait to see if this one takes a breather before moving higher.  Granted, I may miss some of this initial move; however my “buy point” is at 38.8, so there is still some room to maneuver, and a consolidation here would provide an ideal opportunity for me to start a position.

UPDATE: Raul3 has notified me in the comments that TPX reports after the close today (1/24), so I definitely will be waiting until that smoke clears before making any decisions.

I’ll post the chart from my initial analysis and then a current version:


-EM

MGA MGA MGA!

387 views

Ok, so the title is a pathetic play on Italian-American grandmothers everywhere who overtly try to shove “death strands” (aka pasta) down our throats.

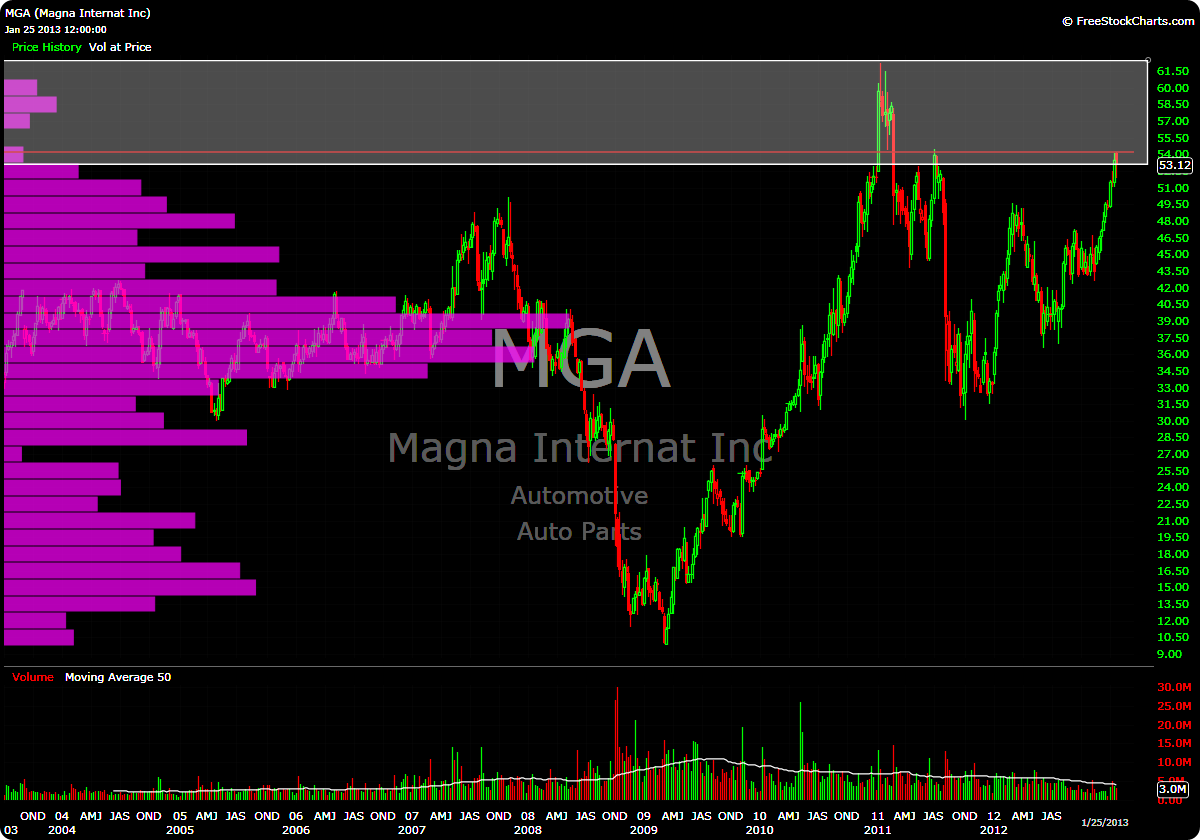
But we aren’t here (today at least) to speak about how foodstuffs made from modern wheat are poisoning our society.  No, I want to talk about Magna International (MGA) and how it is close to flipping from a “watch” to a “buy”.

Yesterday the stock gapped higher only to sell off throughout the session.  I’m okay with that, as this could lead to a much higher probability setup whereby I can initiate a position upon a break of this range that seems to be forming between 53 and 54.

Looking at the weekly shows that over 51 could be considered a low volume area.  Additionally, price stalled just over 54 (much like yesterday) on the attempted rally back in July 2011, which adds a little extra punch to my conviction to get long this stock on a break of this range (should it form constructively).

Should this happen, my target (and position sizing) will be based on a move to the highs from early 2011 around 62.  Should we get there, I will take profits and let whatever I have left ride into the void.

Keep an eye on this one, you know I will be:

-EM

3 Stocks to Watch

432 views

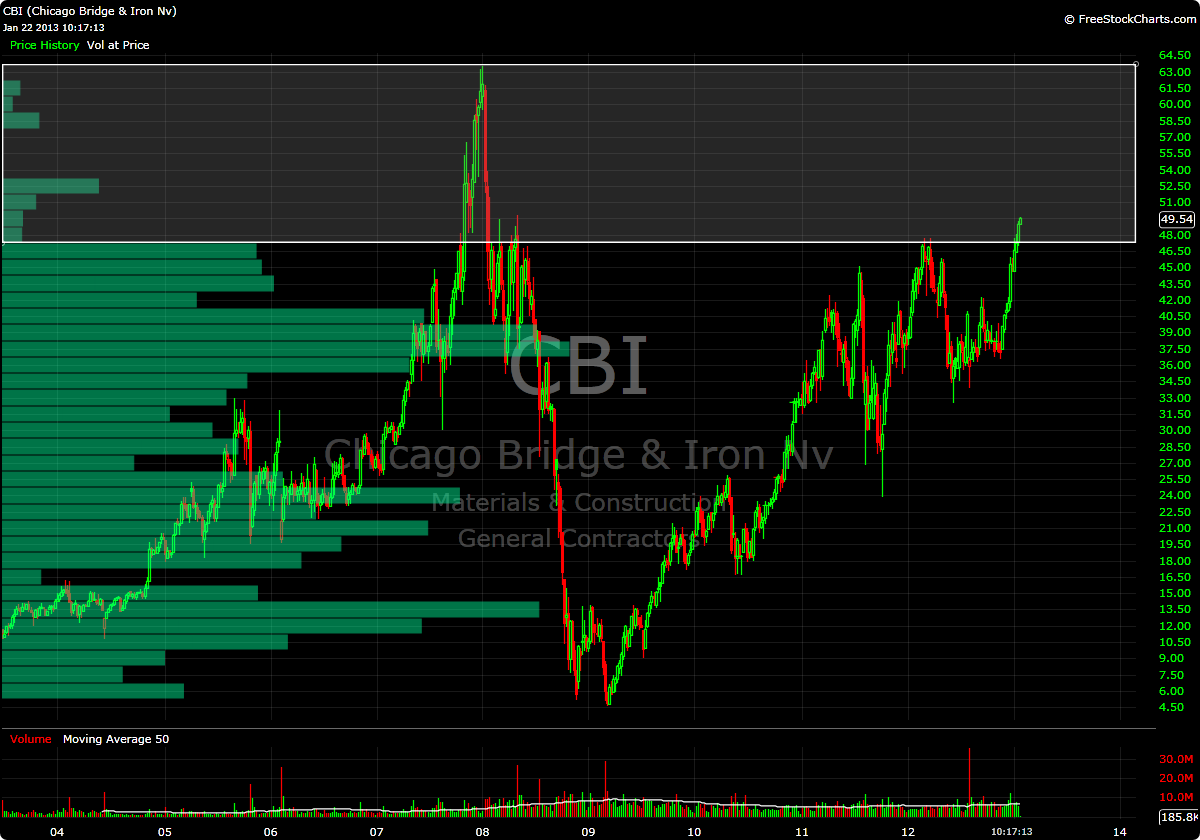
Three stocks have my IB watchlist lighting up like a Christmas tree this morning:

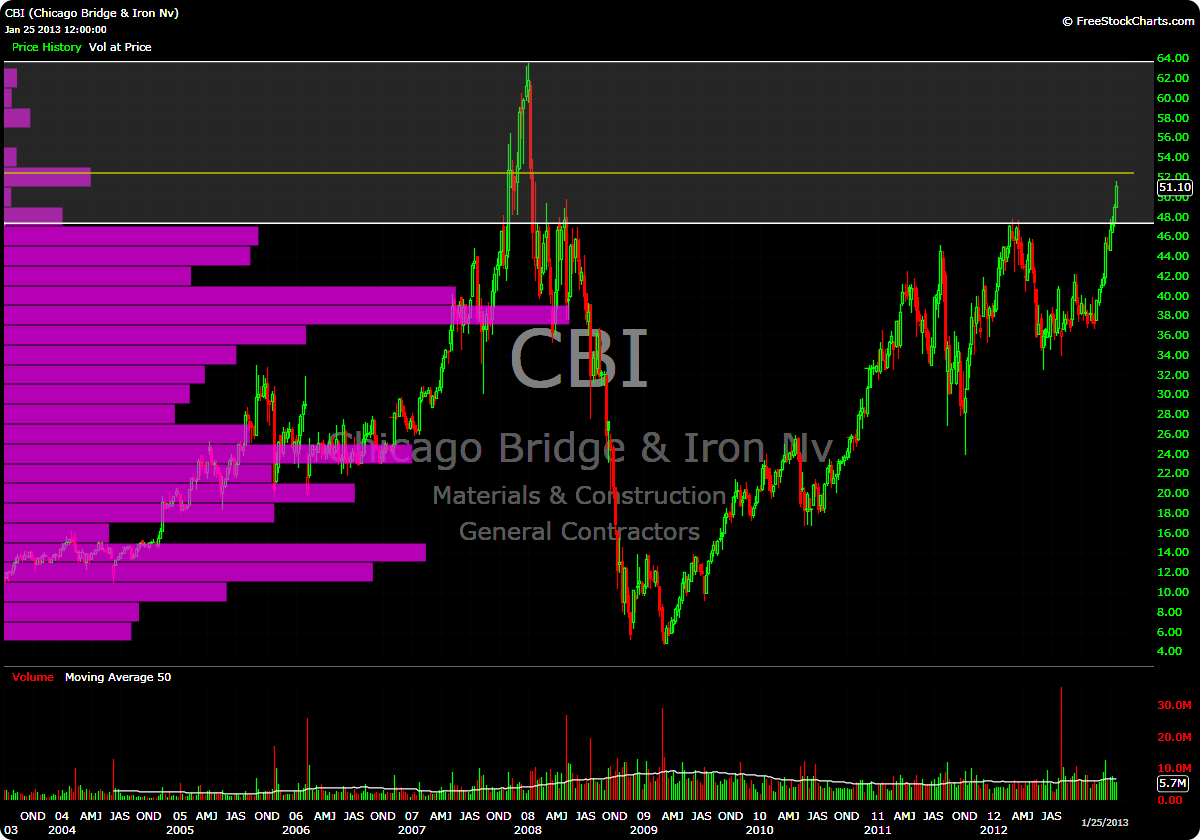
CBI (mentioned here)

RWT (mentioned here)

And WCC

I’d like to wait for a pullback or even a pause to start positions in these, but they are all off and running…and I don’t want to chase.  Therefore I am in a bit of a predicament.

-EM

Watchlist Sector Update

544 views

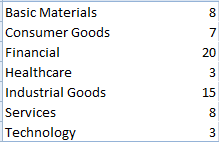
A couple of weeks ago, I posted a breakdown of my watchlist by Sector, Industry and Sub-Industry.  The time has come for an update, first sector counts:

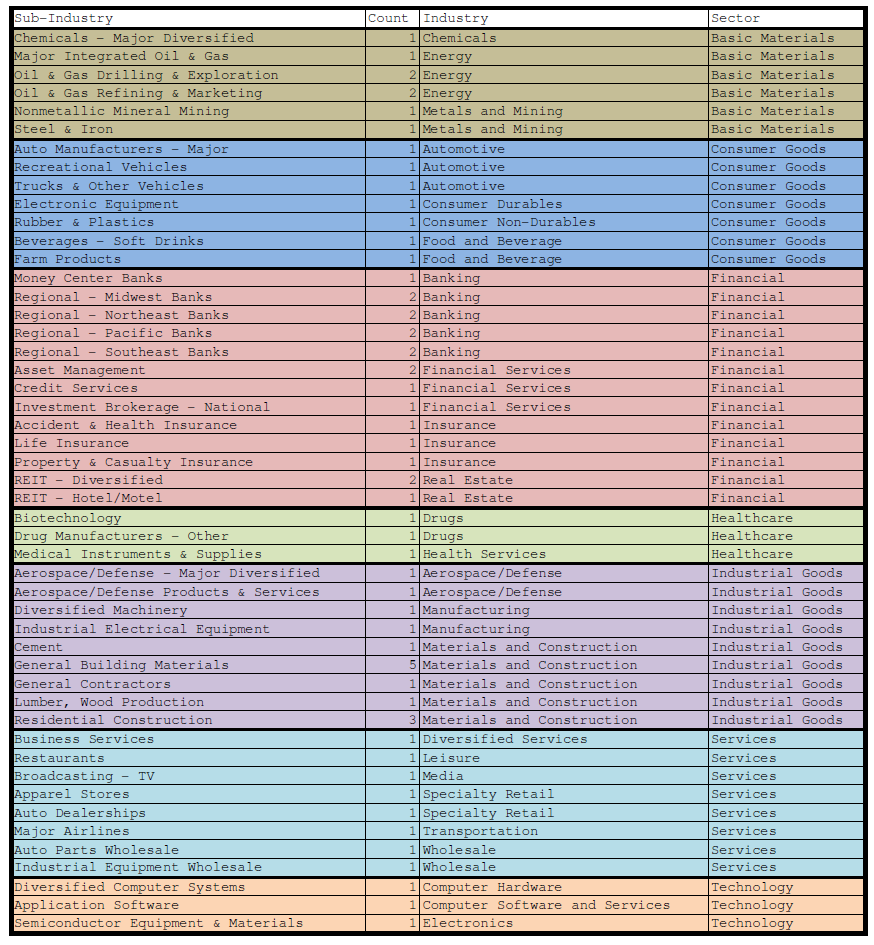
Here is the total breakdown:

Clearly financials still dominate the list, specifically Regional Banks.  Many of those banks have enormous volume voids (thanks to 2008) that I am monitoring.  Industrials have seen a bump in numbers due to the inclusion of many housing related stocks added to the list last Friday.  Aside from that, the landscape is littered with companies from all walks of life (save utilities).

-EM

Using Price by Volume to Define Resistance in PHM

557 views

The other day I posted a watchlist of stocks that I am monitoring following “The Fly’s” bullish call on housing here in the “United Steaks”.  My watchlist was distilled using Price by Volume analysis, and as is the custom, target buy prices were established.

Reader “Narwahl” posed the following question in the comments section:

“How much potential upside before they hit resistance after they’ve reached the volume pocket? Specifically phm.”

Excellent question.

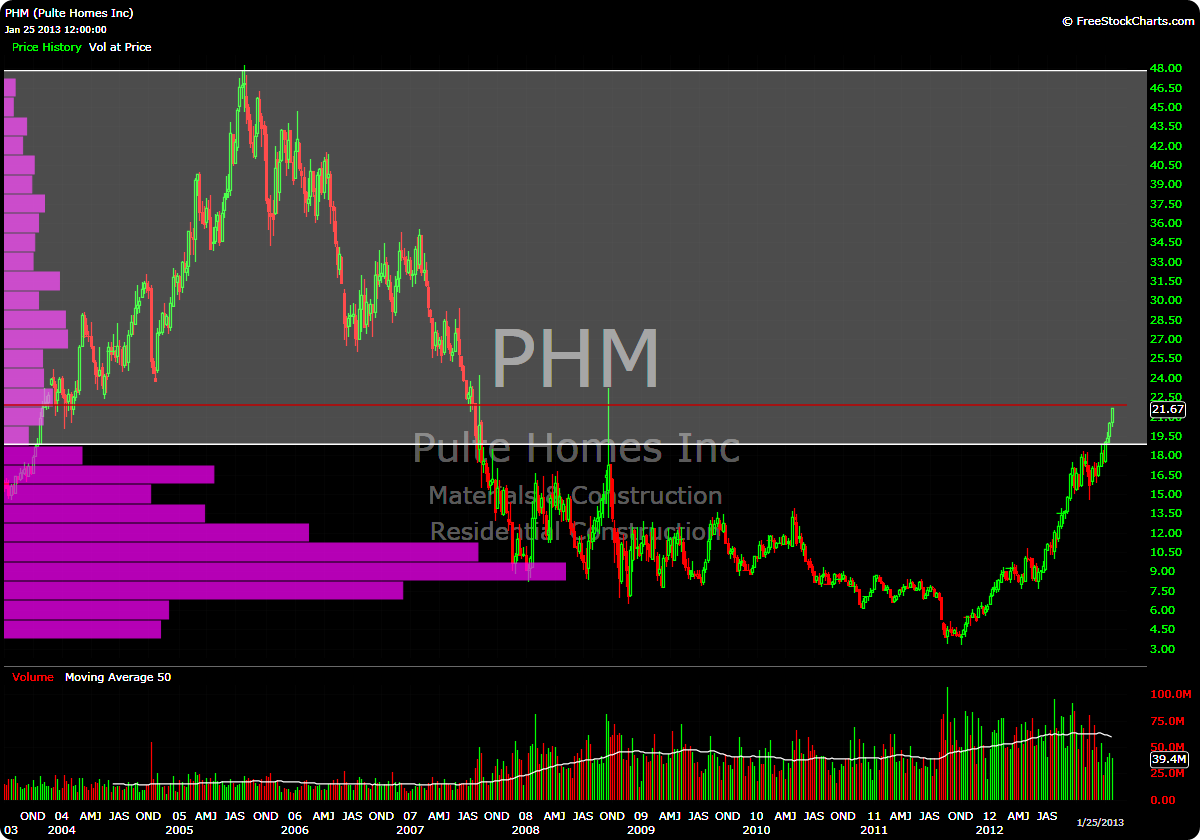
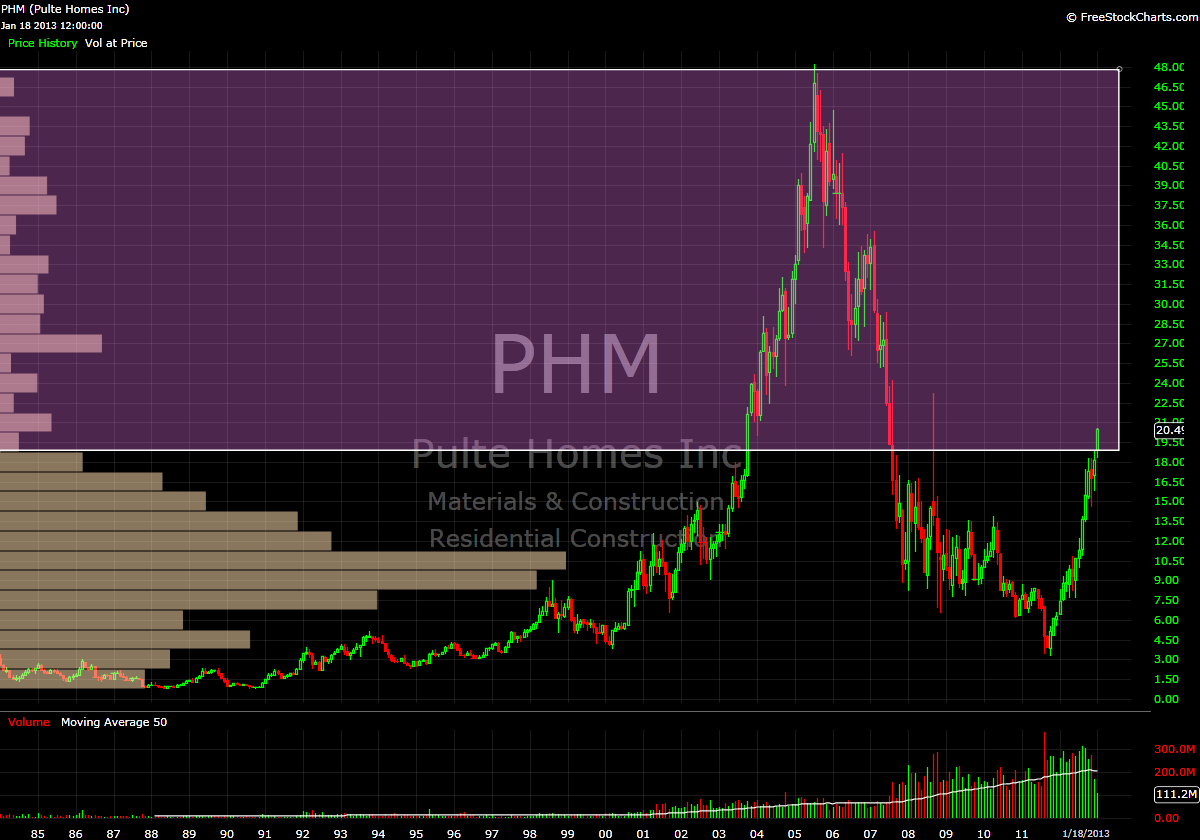
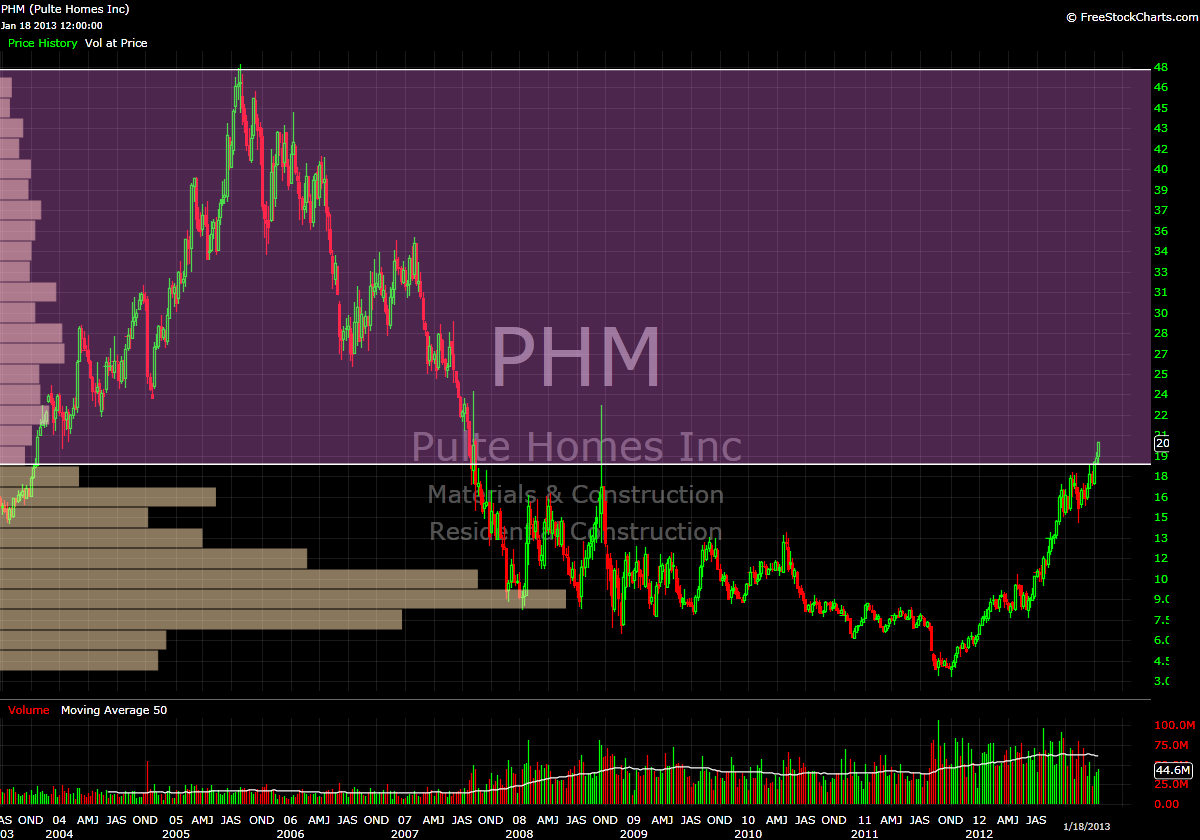
Coincidentally, PHM provides us with an interesting example.  In viewing the charts, there really is not what I would consider to be a traditional “volume pocket”.  A traditional VP moves from a region of high volume nodes into a region of low volume nodes then back into high(er) volume nodes.   Instead, PHM has a near volume “void” from the current price (20.49), all the way to all-time highs, which reside around 48.

Don’t believe me?  Take a look at the monthly and weekly charts:

Since this example is a bit unorthodox, I will try to answer “Narwahl’s” question through hypothesizing what I think these volume profiles signify.

In a ‘normal’ volume pocket scenario, I would typically define “potential upside” as where the volume pocket returns to a heavier volume node in the profile.  One thing that I have come to appreciate about using the volume pocket to analyze price is the ability to gauge a potential price target.  Obviously, this is an ideal circumstance, but by using the volume profile, you can see where, historically speaking, buyers and sellers have reached a state of agreement on price (as evidenced by longer bars on the volume profile).

In a stock like PHM, clearly there is very little in the way of what could be considered proper “value” of the stock from the current price all the way to 48.  From a strictly Price by Volume perspective, there is limited resistance all the way to the top, so when determining my buy point, I set the 2005 high of 48.22 as the top end of my range.

Sure, this may seem like an preposterous proposition, but there were shares of stock that were transacted at that price and every price in between, so simply saying “you’re being ridiculous, it could never return to that level” is, in my opinion, a bit short-sighted.

Remember, in areas with limited volume history, there is little in the way of rational valuation.  There exists a limited supply (historical volume) high demand (momentum).

Nevertheless, from a volume profile perspective, the chop in mid 2007 which found support in the mid 26’s and was rejected around 29.5 would provide a conservative “first target”, but the bump in volume in that region is still minor compared to even the smallest volume bar in the ‘base’ from 3-17.

Lastly, I need to mention: keep in mind that using Price by Volume to define support and resistance is a dynamic process.  As more shares of a stock trade at a certain price the volume profile will change to reflect these transactions.  So, what a volume profile looks like today will likely be very different from what it will look like 1 month, 3 months, 9 months, etc from now.

Bottom line, with my buy point set at 21.90, I am willing to let the price come to me to try and get in on the “meat” of this move.

As always, if you have Questions/comments, feel free to ask, we’re all trying to learn here.

-EM

Housing Watchlist

393 views

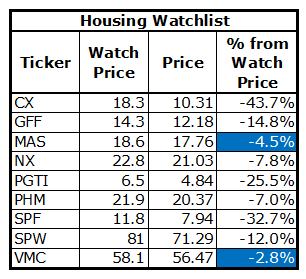
I have finished wading through the list of stocks presented by “The Fly”, and have selected the following for placement on my “volume pocket” watchlist.

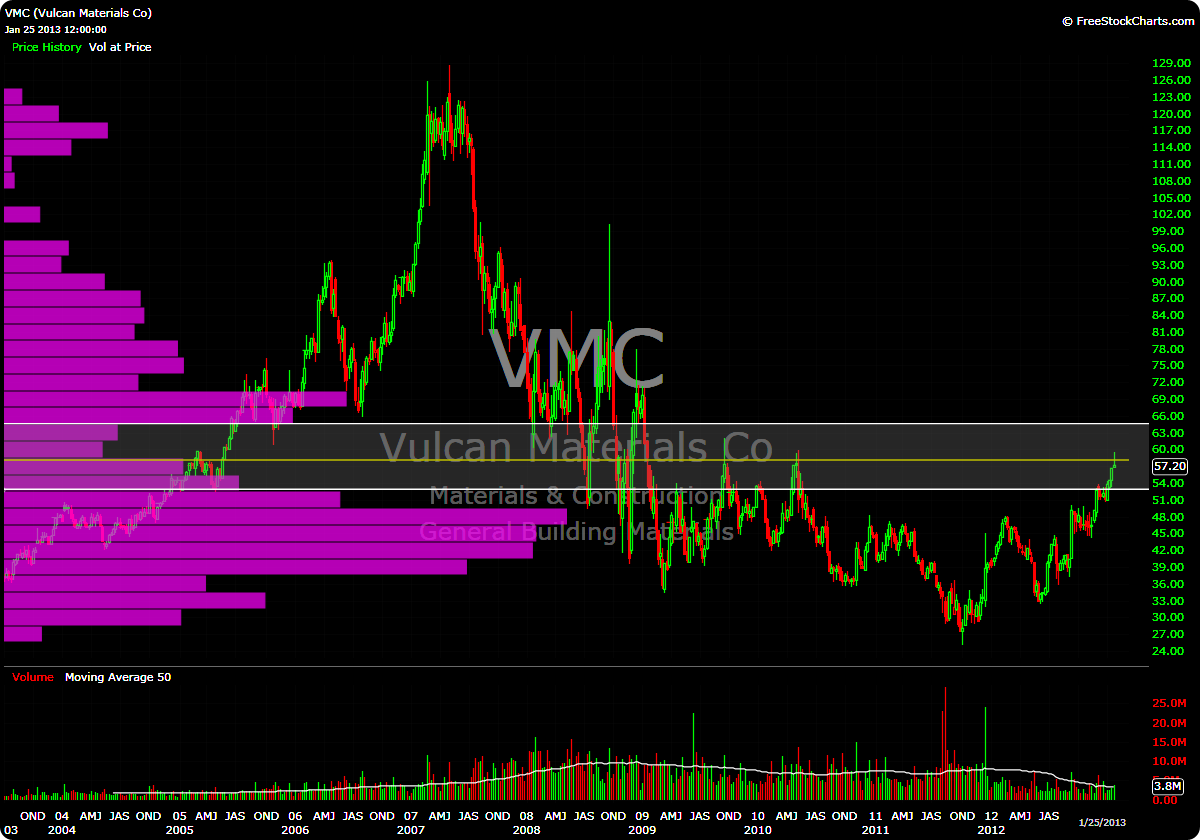
However, for this special occasion, I have created a housing specific watchlist.  As mentioned earlier I have already started a position in VMC, the price indicated below is where I would like to add shares.

I believe it was “Eye-talian Stallion” who commented on “The Fly’s” post about how he was bullish on window makers.  Well, the two that were mentioned were PGTI and NX…and right now I would say that those are two of my favorites among this list.

If the bullish thesis is proven correct, some of these stocks have so much upside it’s ridiculous (that’s also why some are currently so far from potential buy points).  Just when I started to feel complacent about the market a new idea is presented and I have renewed vigor…funny how that works.

Here is the list:

-EM

Belated: Portfolio 01/28/13; A Tad More About $SODA

625 views

Disclaimer: my apologies for the delay on this post.  I had penned what may have been the greatest blog post in the history of man when many of the words were suddenly swallowed by a vat of olive oil (extra virgin, of course) when I pushed the “save post” button last evening (unfortunately the less interesting parts were saved).  Yes, I realize that this information is dated, but wanted to get it out there anyway.

Earlier this evening a Twitter follower named “Southpaw” (I knew I had to be friends with an avatar like that) posed the following question:

As an aside, if you read this blog with any sort of frequency, you recognize how much I enjoy doing reader requests.  If you have a stock you want me to take a look at, feel free to let me know because as far as I’m concerned, we’re all trying to learn here anyway.

Back to the topic at hand: SODA.  In my weekend “Top 10” post, I had SODA as my number one (1) choice.  My top secret scoring system uses an extremely complicated algorithm which should be of no concern to you at this juncture.  With that, let’s take a look at the weekly.

When using PbV to analyze a stock, we need to take into account how much data we have available.  With a stock like SODA that has been public for a little over two years, the volume profile will be characterized and affected by the range of prices.  SODA just happens to have a very large distribution of prices from the low 20’s to almost 80.  With only two years of data and such a large distribution, there are likely to be “voids” somewhere in there.

Clearly buyers and sellers have determined that fair “value” for this stock is somewhere between 32 and 40.

Taking a look at where we are now, SODA does have very little historical volume above 50 (with the exception of around 57 which happens to be the last point of resistance, as signified with the blue arrow).   If price is able to get through this point, it could really run.

To the downside, I would say that 48 is the first (and final, for our purposes, yellow arrow above) point of support.  If price cannot sustain this level, I would go and look for better opportunities.

As for the daily:

We have seen this stock violently pull back, meander sideways for a couple of weeks then go higher once this year already.  I think that if it is indeed forming another base here and breaks free, then the next stop is 57.

As of now, I am going to be very patient with this and let the dust settle.  I have a price in mind where I would like to start a position.  All I have to do is wait in the tall grass for it to come to me.

Bottom line: I’m feeling quite bullish on this stock as long as it can remain above 48.

For the sake of completeness, here an abbreviated portfolio update:

-EM
$SODA? It’s Bubbly, It’s Refreshing

412 views

Mr. Costanza poses a very interesting question.  As EEM continues to infect my portfolio with degeneracy and losses, setups like this are keeping me afloat:

I’ll be looking for a consolidation before jumping in, but this one is right at the top of my list of favorites.

-EM

Watchlist Update

294 views

Lots of moving and shaking happening on the volume pocket watchlist.  I posted this table over a week ago and there were only 4 stocks that were within 5% of my predetermined “price of interest”.

Today we have 13, with two having surpassed that price.  One of these was TPX, which blew out earnings last night and the other was my documented miss in WCC.

Aside from the stocks that are already in my portfolio (highlighted in red), I like the following:

  • ESV on a break of 63, but I’d like to give it a little more room before jumping in.
  • MGA on a break of recent highs around 54.2
  • RWT break of most recent highs around 19.7

-EM

Go Long $TPX and Get a Better Nights Rest

466 views

Colleague Raul3 aka @TwoSmuth alerted me this morning that TPX has entered “the void” (why this was not on my watchlist is beyond me, but the glaring omission has been rectified).

A few weeks ago I did some analysis on the stock and noted that the low volume area measured to about a $15/share.  With a buffer in place to try and avoid getting chopped up on the periphery of the LVN, we are very close to where I would consider starting a position in this stock.

I know that I’m none to enthused about buying at the high end of a +9% day, so I’m going to sit by and wait to see if this one takes a breather before moving higher.  Granted, I may miss some of this initial move; however my “buy point” is at 38.8, so there is still some room to maneuver, and a consolidation here would provide an ideal opportunity for me to start a position.

UPDATE: Raul3 has notified me in the comments that TPX reports after the close today (1/24), so I definitely will be waiting until that smoke clears before making any decisions.

I’ll post the chart from my initial analysis and then a current version:


-EM

MGA MGA MGA!

387 views

Ok, so the title is a pathetic play on Italian-American grandmothers everywhere who overtly try to shove “death strands” (aka pasta) down our throats.

But we aren’t here (today at least) to speak about how foodstuffs made from modern wheat are poisoning our society.  No, I want to talk about Magna International (MGA) and how it is close to flipping from a “watch” to a “buy”.

Yesterday the stock gapped higher only to sell off throughout the session.  I’m okay with that, as this could lead to a much higher probability setup whereby I can initiate a position upon a break of this range that seems to be forming between 53 and 54.

Looking at the weekly shows that over 51 could be considered a low volume area.  Additionally, price stalled just over 54 (much like yesterday) on the attempted rally back in July 2011, which adds a little extra punch to my conviction to get long this stock on a break of this range (should it form constructively).

Should this happen, my target (and position sizing) will be based on a move to the highs from early 2011 around 62.  Should we get there, I will take profits and let whatever I have left ride into the void.

Keep an eye on this one, you know I will be:

-EM

3 Stocks to Watch

432 views

Three stocks have my IB watchlist lighting up like a Christmas tree this morning:

CBI (mentioned here)

RWT (mentioned here)

And WCC

I’d like to wait for a pullback or even a pause to start positions in these, but they are all off and running…and I don’t want to chase.  Therefore I am in a bit of a predicament.

-EM

Watchlist Sector Update

544 views

A couple of weeks ago, I posted a breakdown of my watchlist by Sector, Industry and Sub-Industry.  The time has come for an update, first sector counts:

Here is the total breakdown:

Clearly financials still dominate the list, specifically Regional Banks.  Many of those banks have enormous volume voids (thanks to 2008) that I am monitoring.  Industrials have seen a bump in numbers due to the inclusion of many housing related stocks added to the list last Friday.  Aside from that, the landscape is littered with companies from all walks of life (save utilities).

-EM

Using Price by Volume to Define Resistance in PHM

557 views

The other day I posted a watchlist of stocks that I am monitoring following “The Fly’s” bullish call on housing here in the “United Steaks”.  My watchlist was distilled using Price by Volume analysis, and as is the custom, target buy prices were established.

Reader “Narwahl” posed the following question in the comments section:

“How much potential upside before they hit resistance after they’ve reached the volume pocket? Specifically phm.”

Excellent question.

Coincidentally, PHM provides us with an interesting example.  In viewing the charts, there really is not what I would consider to be a traditional “volume pocket”.  A traditional VP moves from a region of high volume nodes into a region of low volume nodes then back into high(er) volume nodes.   Instead, PHM has a near volume “void” from the current price (20.49), all the way to all-time highs, which reside around 48.

Don’t believe me?  Take a look at the monthly and weekly charts:

Since this example is a bit unorthodox, I will try to answer “Narwahl’s” question through hypothesizing what I think these volume profiles signify.

In a ‘normal’ volume pocket scenario, I would typically define “potential upside” as where the volume pocket returns to a heavier volume node in the profile.  One thing that I have come to appreciate about using the volume pocket to analyze price is the ability to gauge a potential price target.  Obviously, this is an ideal circumstance, but by using the volume profile, you can see where, historically speaking, buyers and sellers have reached a state of agreement on price (as evidenced by longer bars on the volume profile).

In a stock like PHM, clearly there is very little in the way of what could be considered proper “value” of the stock from the current price all the way to 48.  From a strictly Price by Volume perspective, there is limited resistance all the way to the top, so when determining my buy point, I set the 2005 high of 48.22 as the top end of my range.

Sure, this may seem like an preposterous proposition, but there were shares of stock that were transacted at that price and every price in between, so simply saying “you’re being ridiculous, it could never return to that level” is, in my opinion, a bit short-sighted.

Remember, in areas with limited volume history, there is little in the way of rational valuation.  There exists a limited supply (historical volume) high demand (momentum).

Nevertheless, from a volume profile perspective, the chop in mid 2007 which found support in the mid 26’s and was rejected around 29.5 would provide a conservative “first target”, but the bump in volume in that region is still minor compared to even the smallest volume bar in the ‘base’ from 3-17.

Lastly, I need to mention: keep in mind that using Price by Volume to define support and resistance is a dynamic process.  As more shares of a stock trade at a certain price the volume profile will change to reflect these transactions.  So, what a volume profile looks like today will likely be very different from what it will look like 1 month, 3 months, 9 months, etc from now.

Bottom line, with my buy point set at 21.90, I am willing to let the price come to me to try and get in on the “meat” of this move.

As always, if you have Questions/comments, feel free to ask, we’re all trying to learn here.

-EM

Housing Watchlist

393 views

I have finished wading through the list of stocks presented by “The Fly”, and have selected the following for placement on my “volume pocket” watchlist.

However, for this special occasion, I have created a housing specific watchlist.  As mentioned earlier I have already started a position in VMC, the price indicated below is where I would like to add shares.

I believe it was “Eye-talian Stallion” who commented on “The Fly’s” post about how he was bullish on window makers.  Well, the two that were mentioned were PGTI and NX…and right now I would say that those are two of my favorites among this list.

If the bullish thesis is proven correct, some of these stocks have so much upside it’s ridiculous (that’s also why some are currently so far from potential buy points).  Just when I started to feel complacent about the market a new idea is presented and I have renewed vigor…funny how that works.

Here is the list:

-EM

Previous Posts by elizamae