The other day I posted a watchlist of stocks that I am monitoring following “The Fly’s” bullish call on housing here in the “United Steaks”. My watchlist was distilled using Price by Volume analysis, and as is the custom, target buy prices were established.
Reader “Narwahl” posed the following question in the comments section:
“How much potential upside before they hit resistance after they’ve reached the volume pocket? Specifically phm.”
Excellent question.
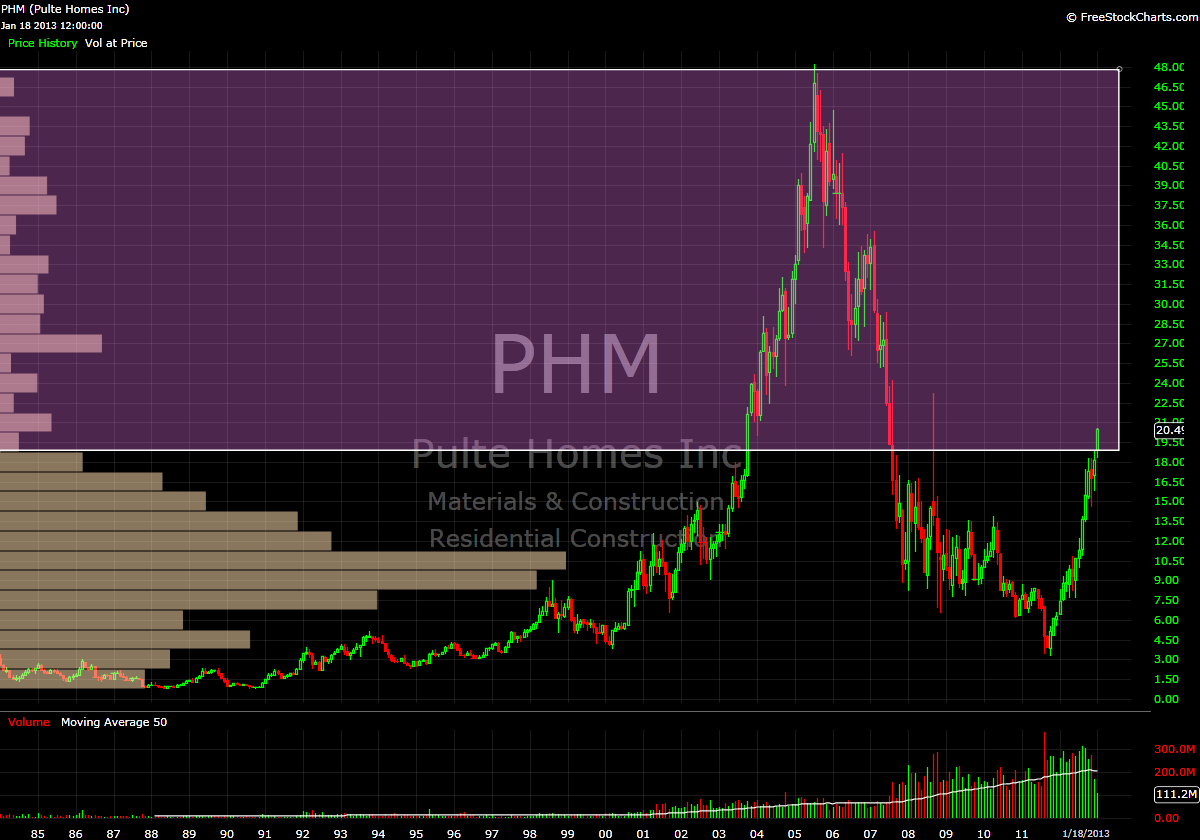
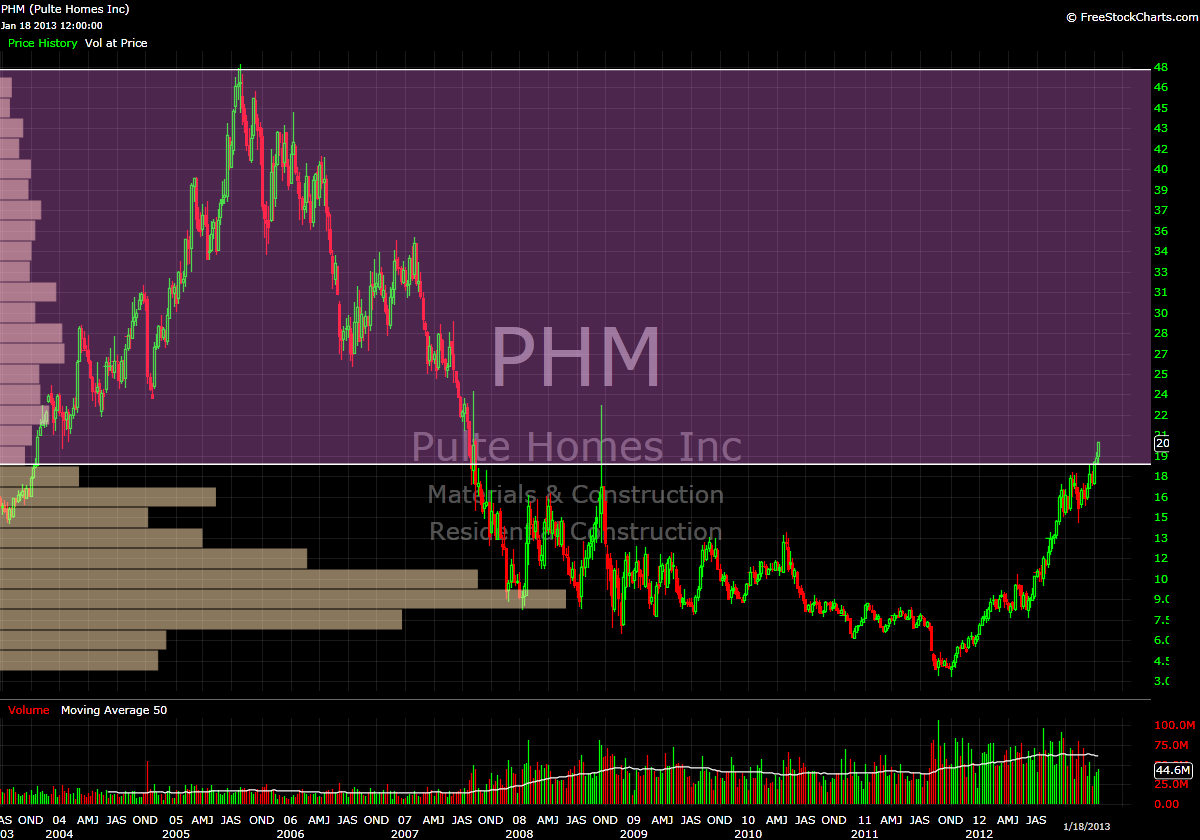
Coincidentally, PHM provides us with an interesting example. In viewing the charts, there really is not what I would consider to be a traditional “volume pocket”. A traditional VP moves from a region of high volume nodes into a region of low volume nodes then back into high(er) volume nodes. Instead, PHM has a near volume “void” from the current price (20.49), all the way to all-time highs, which reside around 48.
Don’t believe me? Take a look at the monthly and weekly charts:
Since this example is a bit unorthodox, I will try to answer “Narwahl’s” question through hypothesizing what I think these volume profiles signify.
In a ‘normal’ volume pocket scenario, I would typically define “potential upside” as where the volume pocket returns to a heavier volume node in the profile. One thing that I have come to appreciate about using the volume pocket to analyze price is the ability to gauge a potential price target. Obviously, this is an ideal circumstance, but by using the volume profile, you can see where, historically speaking, buyers and sellers have reached a state of agreement on price (as evidenced by longer bars on the volume profile).
In a stock like PHM, clearly there is very little in the way of what could be considered proper “value” of the stock from the current price all the way to 48. From a strictly Price by Volume perspective, there is limited resistance all the way to the top, so when determining my buy point, I set the 2005 high of 48.22 as the top end of my range.
Sure, this may seem like an preposterous proposition, but there were shares of stock that were transacted at that price and every price in between, so simply saying “you’re being ridiculous, it could never return to that level” is, in my opinion, a bit short-sighted.
Remember, in areas with limited volume history, there is little in the way of rational valuation. There exists a limited supply (historical volume) high demand (momentum).
Nevertheless, from a volume profile perspective, the chop in mid 2007 which found support in the mid 26’s and was rejected around 29.5 would provide a conservative “first target”, but the bump in volume in that region is still minor compared to even the smallest volume bar in the ‘base’ from 3-17.
Lastly, I need to mention: keep in mind that using Price by Volume to define support and resistance is a dynamic process. As more shares of a stock trade at a certain price the volume profile will change to reflect these transactions. So, what a volume profile looks like today will likely be very different from what it will look like 1 month, 3 months, 9 months, etc from now.
Bottom line, with my buy point set at 21.90, I am willing to let the price come to me to try and get in on the “meat” of this move.
As always, if you have Questions/comments, feel free to ask, we’re all trying to learn here.
-EM


8 Responses to “Using Price by Volume to Define Resistance in PHM”
zzzdoc
Nice article. I have been using price by volume for many years using bigcharts, but data is delayed 15 min. What website are you using to monitor price by volume? Is there one that does it in real-time?
Thank you
zzz
palmbeachtrader
zzzdoc…. try Freestockcharts.com
zzzdoc
Thank you so much!
zzz
elizamae
yeah, as palmbeachtrader said: freestockcharts.com is what I use.
One caveat, I don’t know how much I would trust their data, as I have seen much different quotes from my broker vs. what I was seeing on fsc.
That said, I’m using such large timeframes that the pinpoint accuracy is not an issue for me.
Raul3
Looking at price behavior, I would make $22.00 my first target. Meaning I would need a pullback to make it worth while. Then again I may be working on a shorter timeframe.
If you find the time, I’d love to see how HOV volume profile looks. (I’m long HOV)
elizamae
Re: time frame…yes and no.
I have no problem cutting a trade immediately if it’s a loser. I’m looking to start small and build a large winning position…I don’t care how long it takes, as long as I like what I see.
Narwahl
Thank you for such a thorough response. I’m blown away with the quality of information and analysis you bring to IBC.
elizamae
No problem. I’m glad that you are getting something out of it. My active experience with Price by Volume analysis has basically coincided with my blog hitting the “big time” here…so this is all kind of an grade (sic) experiment and learning experience. I’m trying to simplify my trading, and I feel like this is a good way to keep me patient and raise my awareness. Thanks for reading and contributing.
P.S. Sorry about misspelling your name.