Portfolio 03/18/13

223 views

Busy at work this morning, not much time to write.  I am hoping for the market to come in a bit more here…maybe 1 or 2 days of hectic selling to scare the shit out of “weak handed” market participants only to set up another fantastic buying opportunity.  Keep in mind that the ‘oversold’ buying opportunities that I’m looking for become fewer and fewer as a rally stretches onward, so we have to recognize and take advantage of them when the moment presents itself.  As for me, I’m content with my positioning for the time being.

2013-03-18perf 2013-03-18

-EM

http://youtu.be/p_ywkpVJ624

A Red Flag?

592 views

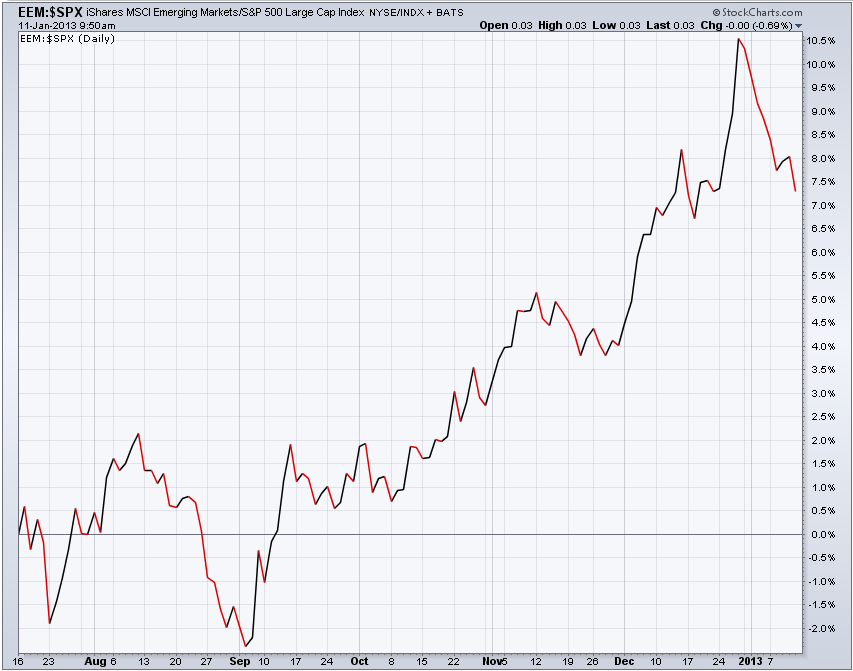
The emerging markets ETF (EEM) has been outperforming the S&P 500 for the better part of the last 6 months.  I have been following these relationships since 2009, and when EEM leads our domestic indices, typically that has led to a more bullish environment.  Here is some visual evidence:

Notice that since the start of 2013, EEM has markedly underperformed.  Now, this is could simply mean that US stocks are gaining strength over those in emerging markets on a short term perspective.  Alternatively, could this be a meaningful divergence that might send stocks lower in the coming weeks/months?

Whatever the consequences, it is something to keep in mind as we continue to grind sideways.

-EM

Counting Cars

399 views

No joke, this is a big part of my job.

Basically, when a developer wants to build on a parcel of land, my job as a Traffic Engineer is to go out and study the ‘intersections of impact’.  A significant part of this process is obtaining turning movement counts at each intersection of interest to determine existing conditions during the AM (7-9), PM (4-6) and Saturday (11-2) “Peak Hours”.

Yes, it is more advanced than sitting there making tally marks on a piece of paper, but the “count boards” that we use are still pretty antiquated devices.  Basically, there are 4 approaches (N-S-E-W) with buttons for three movements in each direction (left, through, right) and one for pedestrians.  Every car that performs a certain action I push the button that denotes that action.

Sometimes there isn’t much traffic at all and I even have time to read a book.  Other times, shit gets hectic.  The closest thing I can relate it to is playing “Rock Band” or “Guitar Hero”.  The cars just keep on coming and I have to do my best to try and pay attention and document everything.   Today was/will be one of those days.

Anyway, we use this data to project (based on growth rates) how the traffic will grow when the development is complete and (usually) 5 years after that.  Then we add in the traffic that the land use typically generates and can (somewhat reliably) predict how the development will impact the traffic in the area.

Fascinating stuff, I know (well, it actually is to me…but I’m a dork, so…).

Unfortunately, the downside is this keeps me away from my computer for most of the day; therefore my ability to blog and monitor the market is limited.  In the meantime, it doesn’t appear that I am missing much anyway…other than the market continuing to rest and potentially giving me some opportunities to buy.

Until we meet again.

-EM

Status Update: Digesting Nicely

349 views

I have spent the morning sitting here mixing in some work on Excel and AutoCAD while observing the market calmly digest recent gains.

A common desire of the mind is to make money every day in the stock market, so it’s natural to get a little discouraged when witnessing a bunch of red littering one’s portfolio performance.

I have spent the past few years trying to sprint through the market…making short-term trades to try and bang out some quick profits.  Sometimes it worked, sometimes it did not…but the constant stress in addition to the fear of losing a profitable trade always had me “sashaying” in and out of stocks without regard for their longer-term prospects.

In 2013, I’m abandoning the short-term approach and looking for longer term positions; therefore I need to learn to embrace these inevitable days of red.

I believe the stocks that I own and am watching are going higher.  Maybe not today, hell, maybe not even this week…but eventually, yes.  If not, I’ll cut them loose and move on to the next idea.  Nevertheless, a bit of rational selling is what many of these names require to present me with a more ‘comfortable’ entry point.

Currently on watch: AFG ASGN ATML CBI CLMT ESV GPI HXL KKD SODA TROW VR

-EM

Keep SODA on Watch

618 views

The maker of in-home “death kits” aka. homemade soda makers SodaStream International (SODA), looks poised to move much higher in the coming weeks.

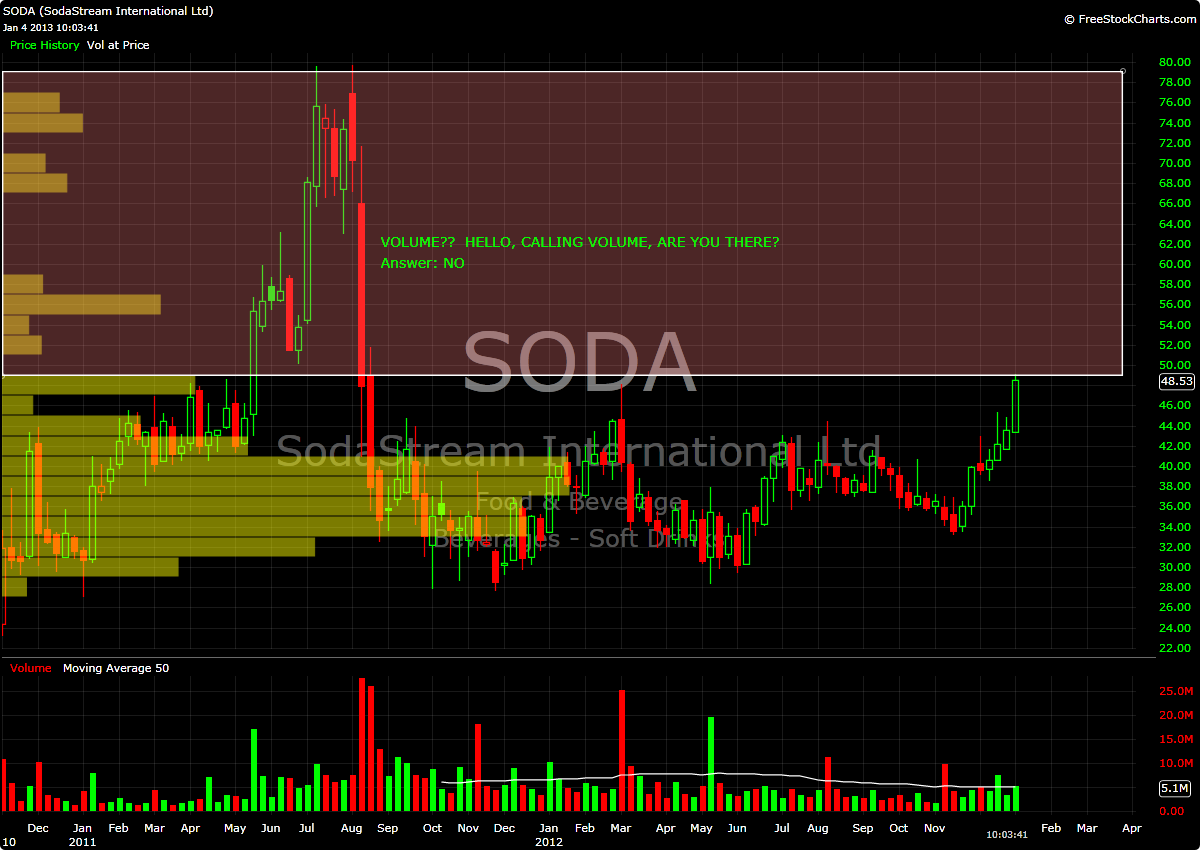
If you are keeping up with my watchlist, you know that I am keeping an eye on the 49.00/share level.  The past two days, the stock has attempted to make a move higher through this level, but has been rebuffed both times…I kind of like that.

As with just about every stock I’m watching right now, this really ‘feels’ overextended and could use a few days (or a week or two) to cool off.  If an “orderly consolidation” can take shape between 47 and 49, I may look to start a position on a clean break above the aforementioned price of 49.

Here is why I think it has a chance to run:

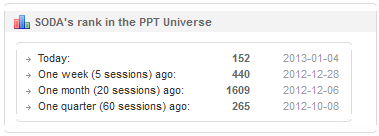
The PPT also loves this stock, look, it’s been hovering around the Top 5-10% of companies for at least a quarter:

-EM

Attn: Short Sellers of First Solar

747 views

Warning: you soon may be summoned to the city square.

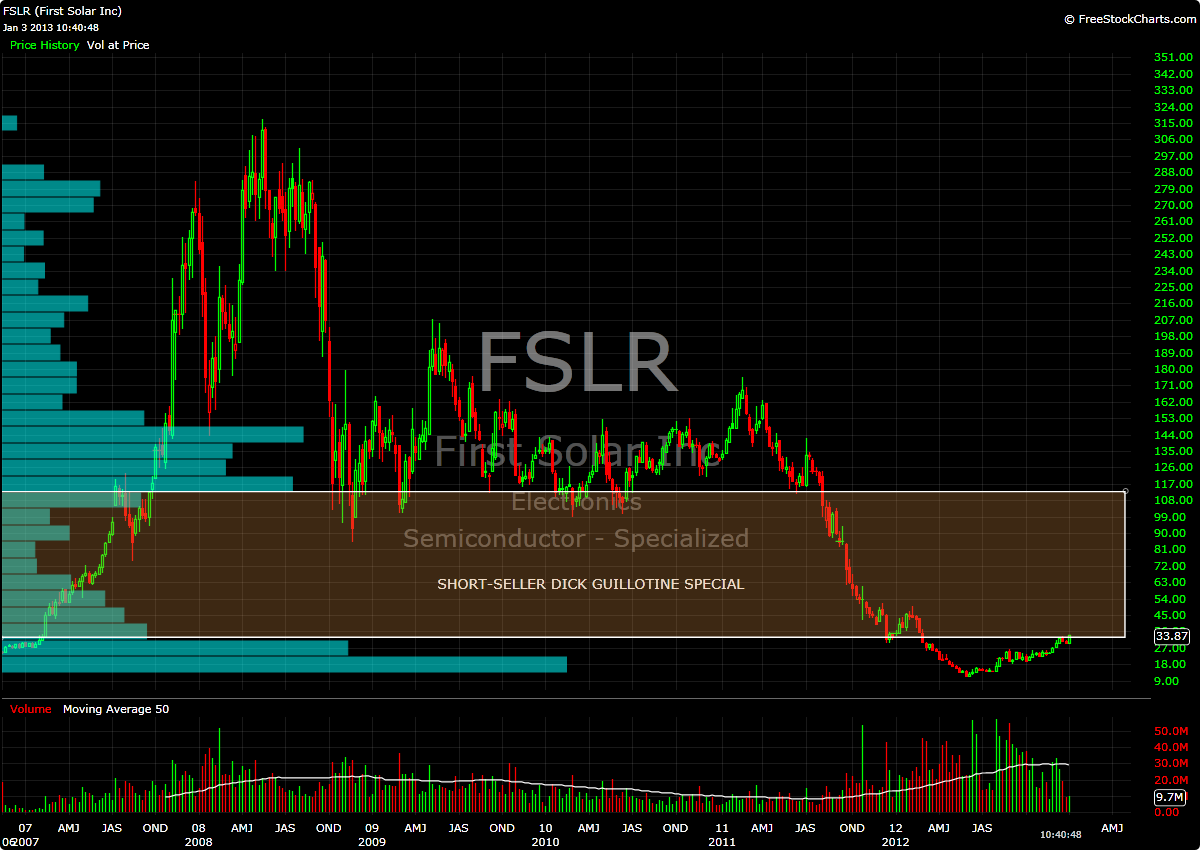
I know that it has been ‘en vogue’ to bash the living shit out of solar power companies these past 2 years (and, rightfully so, mind you), but money always flows toward momentum.  Earlier RC noted that the Solar ETF TAN continues to populate the upper reaches of ETF performance…showing either a continued short squeeze or what could be actual, legitimate buying.

In closing, if you are short FSLR I post this chart as caution, as your penis may soon be removed from your person:

-EM

HXL: an Example

494 views

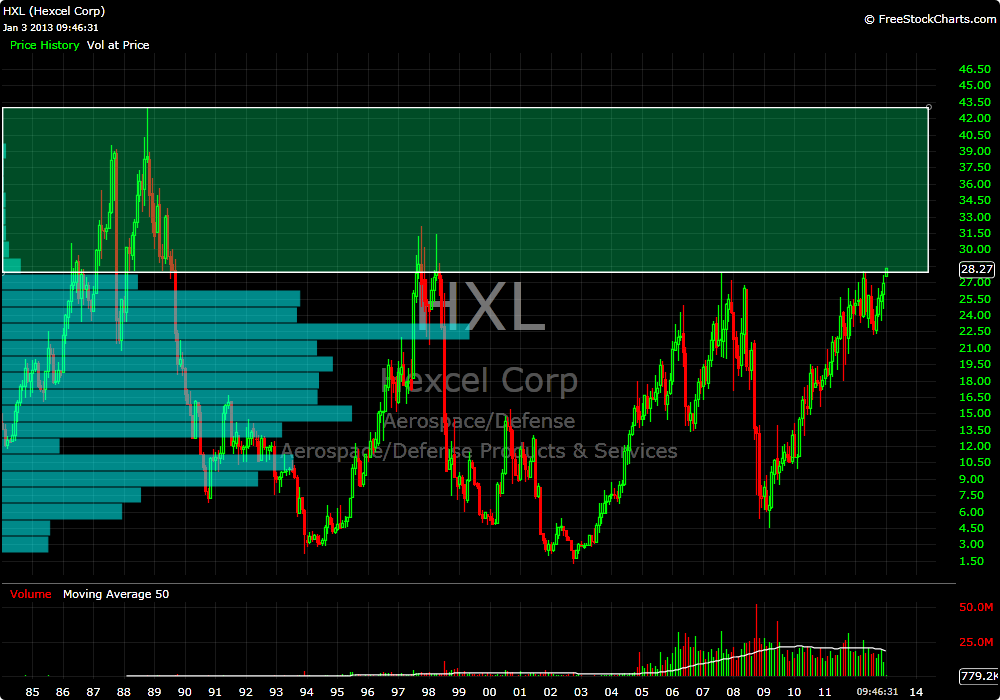
Shares of Hexcel Corp (HXL) have crossed the 28 threshold that I had identified on my watch list.  Let’s take a look at why I have focused on this as an area of interest.  In this case, I went to the monthly chart, which takes us all the way back to 1984 (rejoice Detroit Tigers fans!).

Using this timeframe gives us almost 30 years of price and volume data…you can clearly see that there isn’t a whole lot in the way of potential resistance above 28.  Again, keep in mind that this doesn’t mean resistance will not form in this area, but that, currently, it doesn’t exist.

Drilling down to the daily chart shows that this stock has been surging higher the past few days.  Instead of trying to chase into this area, I want to wait for a consolidation/pullback to assess how the stock behaves.

Clearly there is significant support/congestion under 28, so any pullback that remains around/above that level will signal a good opportunity to buy.

Then again, this thing could rocket straight to 32, leaving me in the dust.

-EM

WGO is in the Void

481 views

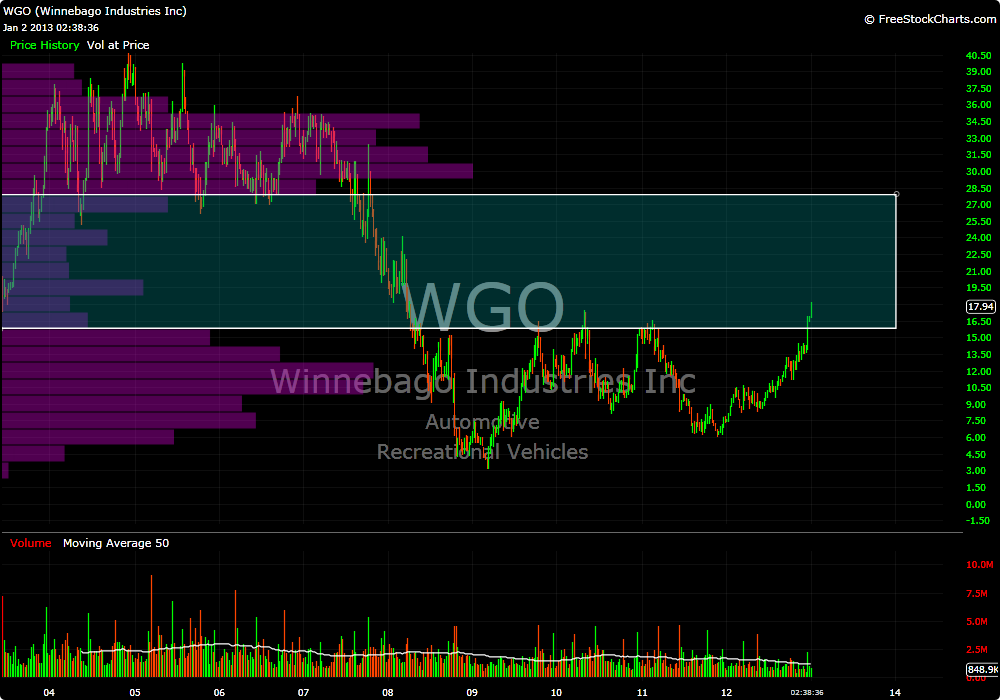
My portfolio sports a 1/4 position in Winnebago Industries (WGO).  Looking at a daily chart would lead one to believe that this stock is racing to new highs.  Zoom out to the weekly and an entirely different picture comes into focus:

Over the weekend, I took notice of this stock (initially because of a very high ranking by The PPT) making a very strong move into the “volume pocket” on the weekly.  Here is where it appears that Price by Volume analysis can be a very powerful tool.

The weekly chart contains almost 9.5 years worth of price and volume data.  You can clearly see that there was significantly less buying and selling going on in the highlighted area.  With this in mind, one can deduce that there is likely to be limited resistance to buying thrusts throughout some of, if not all of this area.

Does this mean we are going to 28 in a straight line?  Of course not.

The most challenging part of this analysis is that the PbV bars are truly dynamic and this pocket could disappear should price stall in this region.  Simply put, I am merely trying to identify a “path of least resistance”.

Patience is key here, but ideally, my plan is to add shares upon consolidating price action in this range and ride a progressively larger position all the way to the top of the pocket around 28.

-EM

Portfolio Update: Buying CTB, FSS

539 views

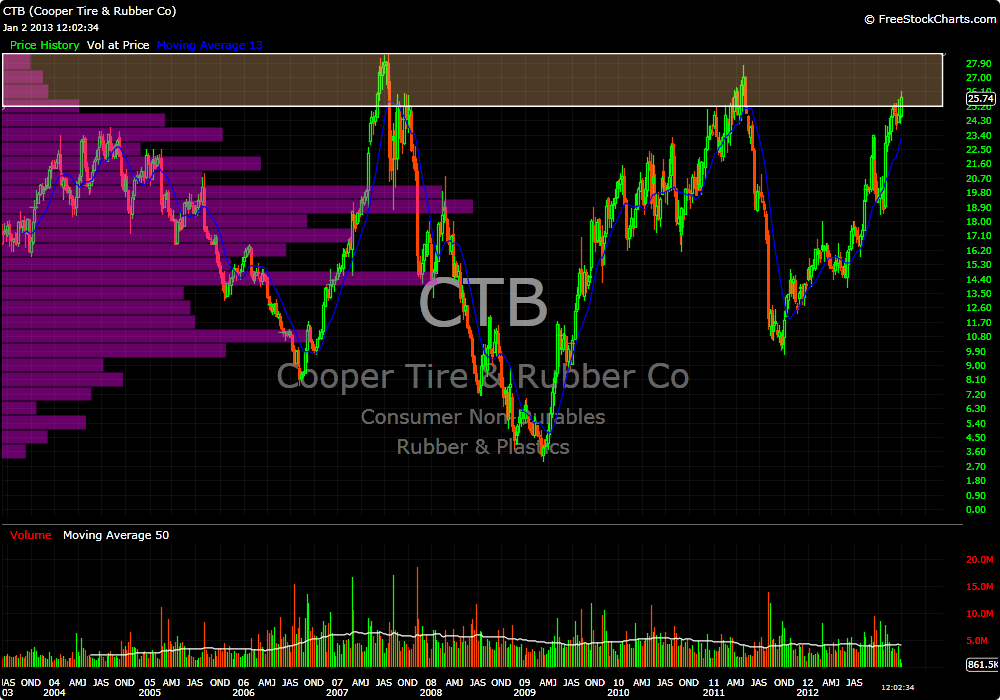
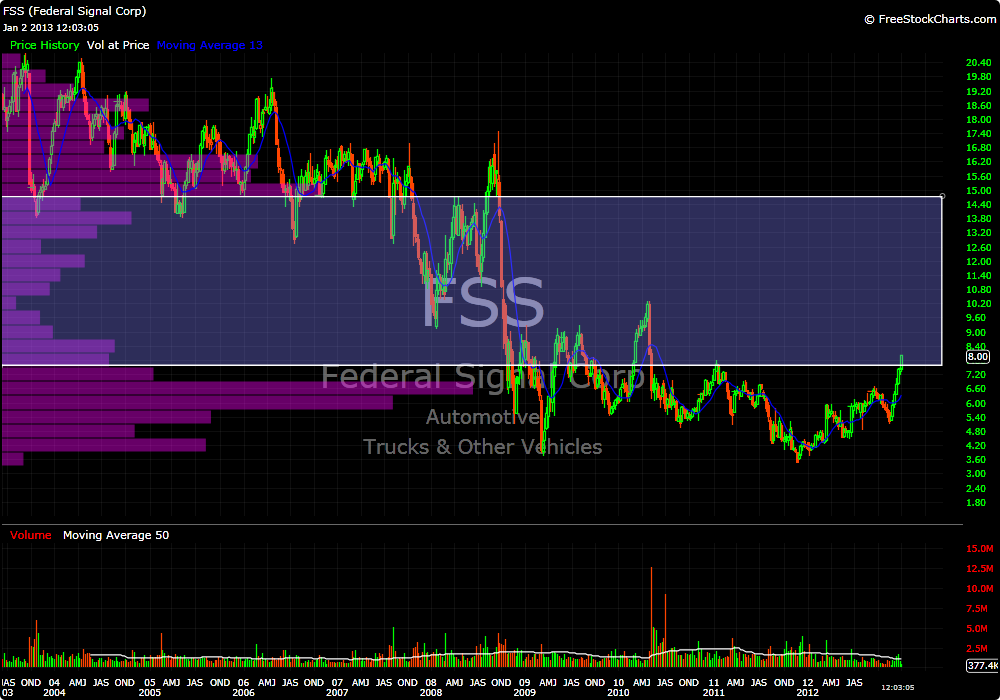
I opened 1/4 positions in both CTB and FSS this morning as both have entered thinly traded regions on longer-term timeframes.  See for yourselves:

CTB

FSS

Coincidentally these are both plays off of my prediction that 2013 will see unexpected strength in the Automotive Manufacturing industry.

-EM

Portfolio Buy: EEM

450 views

In an effort to have a portion of my assets move in concert with the market, at the close today, I will be buying a 30% stake in EEM.

Long story made very short: I have a scoring system that I use to determine the “top” index ETF (chosing from SPY, DIA, QQQ, IWM, MDY, EEM and SHY).  This system also produces a signal which I denote as “green” or “red”.  When “green”, I rebalance funds once per month to the top rated ETF.  If it is “red”, well, that is a different story for another time.

For the purposes of this post, what you need to know is that the signal is currently “green” and EEM is CRUSHING the other ETF’s…so that is where my money is going.

UPDATE: Order filled at 44.33

-EM

Portfolio 03/18/13

223 views

Busy at work this morning, not much time to write.  I am hoping for the market to come in a bit more here…maybe 1 or 2 days of hectic selling to scare the shit out of “weak handed” market participants only to set up another fantastic buying opportunity.  Keep in mind that the ‘oversold’ buying opportunities that I’m looking for become fewer and fewer as a rally stretches onward, so we have to recognize and take advantage of them when the moment presents itself.  As for me, I’m content with my positioning for the time being.

2013-03-18perf 2013-03-18

-EM

http://youtu.be/p_ywkpVJ624

A Red Flag?

592 views

The emerging markets ETF (EEM) has been outperforming the S&P 500 for the better part of the last 6 months.  I have been following these relationships since 2009, and when EEM leads our domestic indices, typically that has led to a more bullish environment.  Here is some visual evidence:

Notice that since the start of 2013, EEM has markedly underperformed.  Now, this is could simply mean that US stocks are gaining strength over those in emerging markets on a short term perspective.  Alternatively, could this be a meaningful divergence that might send stocks lower in the coming weeks/months?

Whatever the consequences, it is something to keep in mind as we continue to grind sideways.

-EM

Counting Cars

399 views

No joke, this is a big part of my job.

Basically, when a developer wants to build on a parcel of land, my job as a Traffic Engineer is to go out and study the ‘intersections of impact’.  A significant part of this process is obtaining turning movement counts at each intersection of interest to determine existing conditions during the AM (7-9), PM (4-6) and Saturday (11-2) “Peak Hours”.

Yes, it is more advanced than sitting there making tally marks on a piece of paper, but the “count boards” that we use are still pretty antiquated devices.  Basically, there are 4 approaches (N-S-E-W) with buttons for three movements in each direction (left, through, right) and one for pedestrians.  Every car that performs a certain action I push the button that denotes that action.

Sometimes there isn’t much traffic at all and I even have time to read a book.  Other times, shit gets hectic.  The closest thing I can relate it to is playing “Rock Band” or “Guitar Hero”.  The cars just keep on coming and I have to do my best to try and pay attention and document everything.   Today was/will be one of those days.

Anyway, we use this data to project (based on growth rates) how the traffic will grow when the development is complete and (usually) 5 years after that.  Then we add in the traffic that the land use typically generates and can (somewhat reliably) predict how the development will impact the traffic in the area.

Fascinating stuff, I know (well, it actually is to me…but I’m a dork, so…).

Unfortunately, the downside is this keeps me away from my computer for most of the day; therefore my ability to blog and monitor the market is limited.  In the meantime, it doesn’t appear that I am missing much anyway…other than the market continuing to rest and potentially giving me some opportunities to buy.

Until we meet again.

-EM

Status Update: Digesting Nicely

349 views

I have spent the morning sitting here mixing in some work on Excel and AutoCAD while observing the market calmly digest recent gains.

A common desire of the mind is to make money every day in the stock market, so it’s natural to get a little discouraged when witnessing a bunch of red littering one’s portfolio performance.

I have spent the past few years trying to sprint through the market…making short-term trades to try and bang out some quick profits.  Sometimes it worked, sometimes it did not…but the constant stress in addition to the fear of losing a profitable trade always had me “sashaying” in and out of stocks without regard for their longer-term prospects.

In 2013, I’m abandoning the short-term approach and looking for longer term positions; therefore I need to learn to embrace these inevitable days of red.

I believe the stocks that I own and am watching are going higher.  Maybe not today, hell, maybe not even this week…but eventually, yes.  If not, I’ll cut them loose and move on to the next idea.  Nevertheless, a bit of rational selling is what many of these names require to present me with a more ‘comfortable’ entry point.

Currently on watch: AFG ASGN ATML CBI CLMT ESV GPI HXL KKD SODA TROW VR

-EM

Keep SODA on Watch

618 views

The maker of in-home “death kits” aka. homemade soda makers SodaStream International (SODA), looks poised to move much higher in the coming weeks.

If you are keeping up with my watchlist, you know that I am keeping an eye on the 49.00/share level.  The past two days, the stock has attempted to make a move higher through this level, but has been rebuffed both times…I kind of like that.

As with just about every stock I’m watching right now, this really ‘feels’ overextended and could use a few days (or a week or two) to cool off.  If an “orderly consolidation” can take shape between 47 and 49, I may look to start a position on a clean break above the aforementioned price of 49.

Here is why I think it has a chance to run:

The PPT also loves this stock, look, it’s been hovering around the Top 5-10% of companies for at least a quarter:

-EM

Attn: Short Sellers of First Solar

747 views

Warning: you soon may be summoned to the city square.

I know that it has been ‘en vogue’ to bash the living shit out of solar power companies these past 2 years (and, rightfully so, mind you), but money always flows toward momentum.  Earlier RC noted that the Solar ETF TAN continues to populate the upper reaches of ETF performance…showing either a continued short squeeze or what could be actual, legitimate buying.

In closing, if you are short FSLR I post this chart as caution, as your penis may soon be removed from your person:

-EM

HXL: an Example

494 views

Shares of Hexcel Corp (HXL) have crossed the 28 threshold that I had identified on my watch list.  Let’s take a look at why I have focused on this as an area of interest.  In this case, I went to the monthly chart, which takes us all the way back to 1984 (rejoice Detroit Tigers fans!).

Using this timeframe gives us almost 30 years of price and volume data…you can clearly see that there isn’t a whole lot in the way of potential resistance above 28.  Again, keep in mind that this doesn’t mean resistance will not form in this area, but that, currently, it doesn’t exist.

Drilling down to the daily chart shows that this stock has been surging higher the past few days.  Instead of trying to chase into this area, I want to wait for a consolidation/pullback to assess how the stock behaves.

Clearly there is significant support/congestion under 28, so any pullback that remains around/above that level will signal a good opportunity to buy.

Then again, this thing could rocket straight to 32, leaving me in the dust.

-EM

WGO is in the Void

481 views

My portfolio sports a 1/4 position in Winnebago Industries (WGO).  Looking at a daily chart would lead one to believe that this stock is racing to new highs.  Zoom out to the weekly and an entirely different picture comes into focus:

Over the weekend, I took notice of this stock (initially because of a very high ranking by The PPT) making a very strong move into the “volume pocket” on the weekly.  Here is where it appears that Price by Volume analysis can be a very powerful tool.

The weekly chart contains almost 9.5 years worth of price and volume data.  You can clearly see that there was significantly less buying and selling going on in the highlighted area.  With this in mind, one can deduce that there is likely to be limited resistance to buying thrusts throughout some of, if not all of this area.

Does this mean we are going to 28 in a straight line?  Of course not.

The most challenging part of this analysis is that the PbV bars are truly dynamic and this pocket could disappear should price stall in this region.  Simply put, I am merely trying to identify a “path of least resistance”.

Patience is key here, but ideally, my plan is to add shares upon consolidating price action in this range and ride a progressively larger position all the way to the top of the pocket around 28.

-EM

Portfolio Update: Buying CTB, FSS

539 views

I opened 1/4 positions in both CTB and FSS this morning as both have entered thinly traded regions on longer-term timeframes.  See for yourselves:

CTB

FSS

Coincidentally these are both plays off of my prediction that 2013 will see unexpected strength in the Automotive Manufacturing industry.

-EM

Portfolio Buy: EEM

450 views

In an effort to have a portion of my assets move in concert with the market, at the close today, I will be buying a 30% stake in EEM.

Long story made very short: I have a scoring system that I use to determine the “top” index ETF (chosing from SPY, DIA, QQQ, IWM, MDY, EEM and SHY).  This system also produces a signal which I denote as “green” or “red”.  When “green”, I rebalance funds once per month to the top rated ETF.  If it is “red”, well, that is a different story for another time.

For the purposes of this post, what you need to know is that the signal is currently “green” and EEM is CRUSHING the other ETF’s…so that is where my money is going.

UPDATE: Order filled at 44.33

-EM

Previous Posts by elizamae