iBankCoin
Joined Mar 28, 2014
35 Blog Posts

Market Forecast – Upwards Climb?

The markets have been erratic over the past week and it’s no surprise given the news flow.  I’ve had my head on a constant swivel this past week, playing defense and attempting to not get blindsided.  Presidents Day has provided me with an extra day to take a deep breadth, soak in all the relevant information and update the forecast.

Working off of my last forecast (click here) I will provide an update and then briefly discuss the risks and rewards playing out in our financial markets.

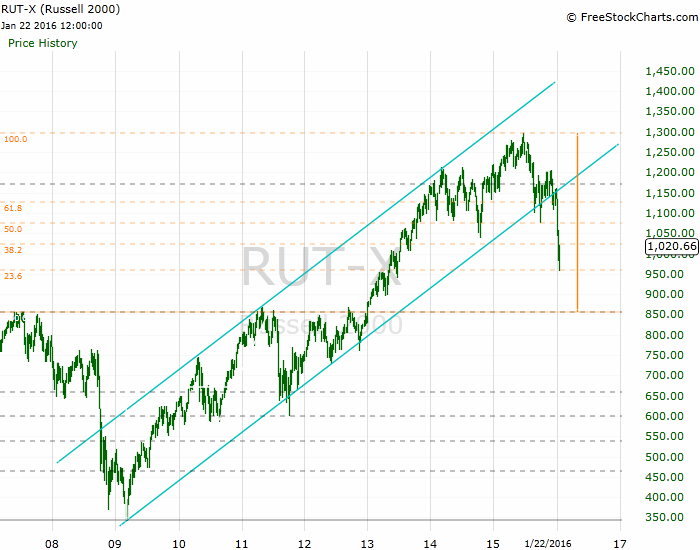
As you know, I am currently keying off of the Russell 2000 Index and still believe we will hit the 2007 highs of around $850 by this summer (at the latest).  Last week we briefly broke through support at around $960 before reversing rather quickly.  Refer to the chart below:

RUT-X_02152016

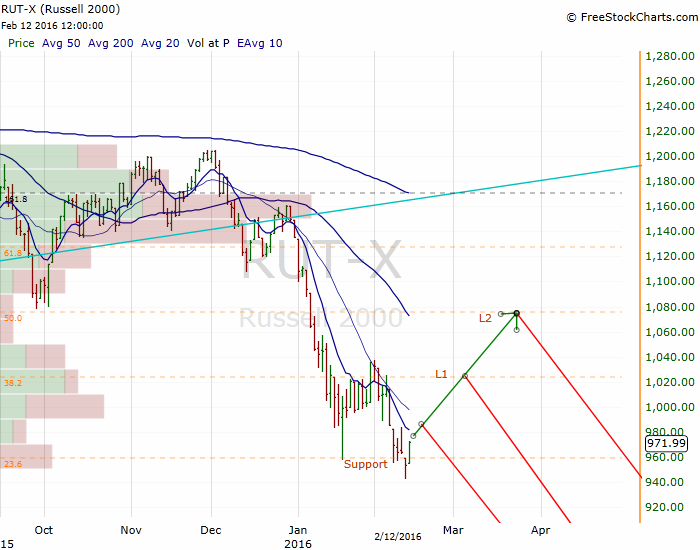
Now that there’s numerous market participants caught short (including myself), there is increased risk of the market bouncing higher before reversing and continuing the primary downtrend.  I will cover my short exposure above $984 and let my long hedges run while the market bounces.  I expect equities to reverse near $1024 on the Russell (and possibly even as high as $1077 – but I give that less probability).  Refer to ‘L1’ and ‘L2’ in the chart above.

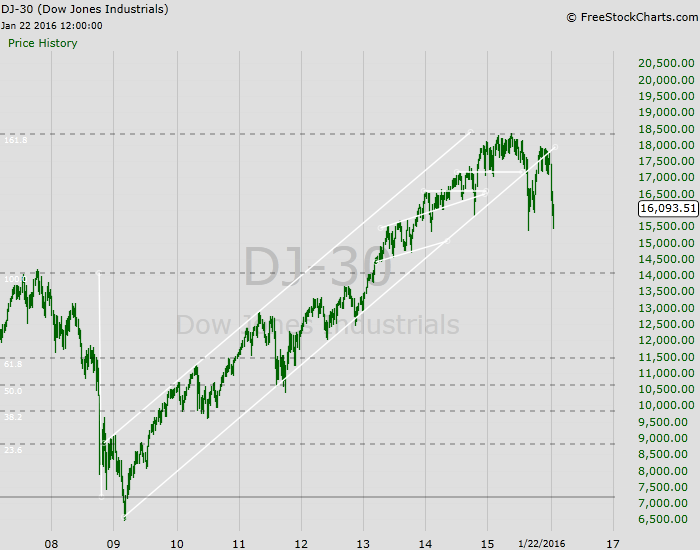
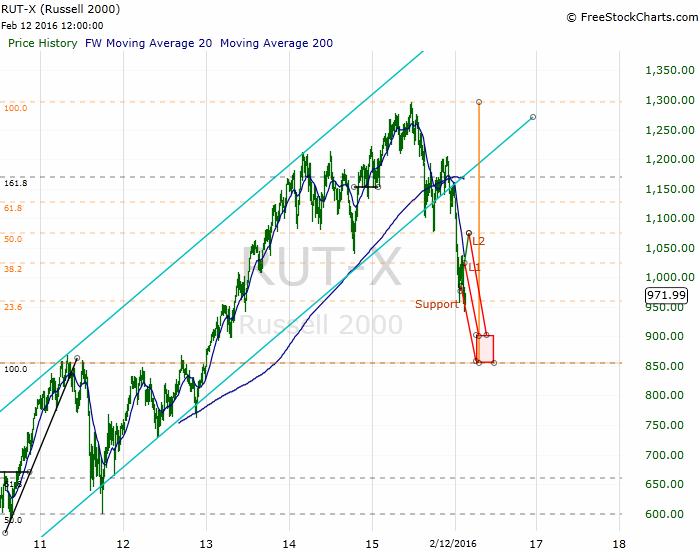
The long term chart is below:

RUT-X_02152016_LT

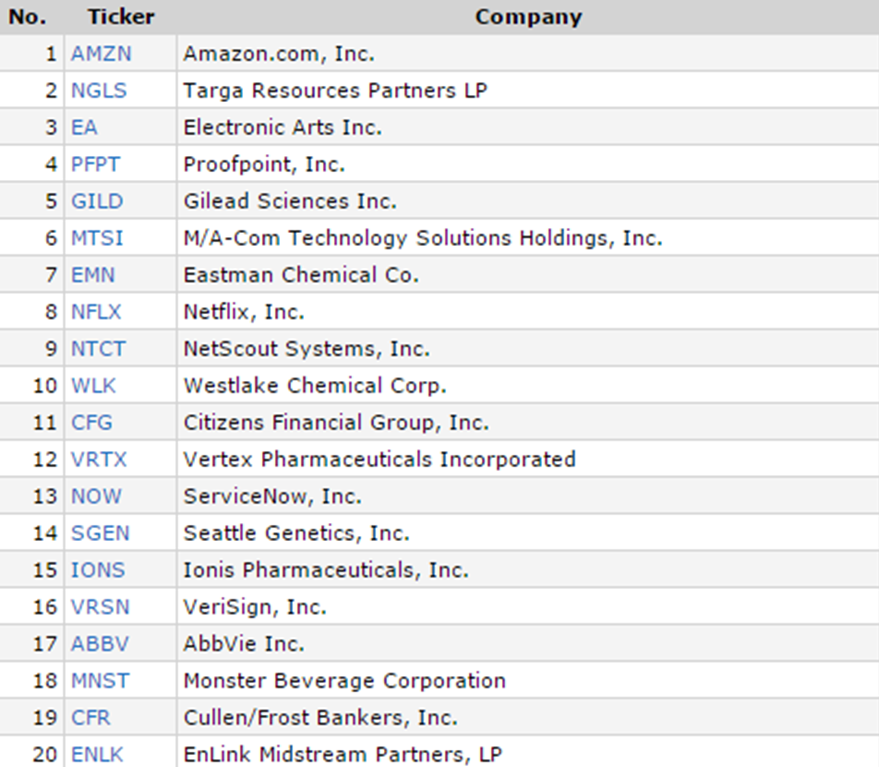
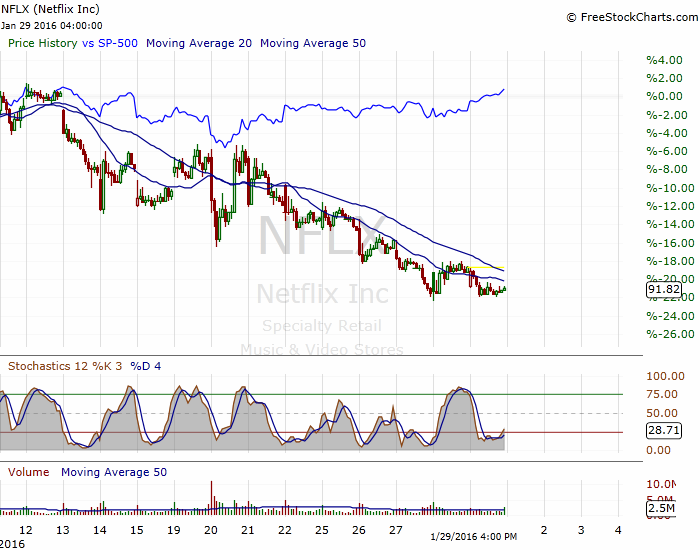
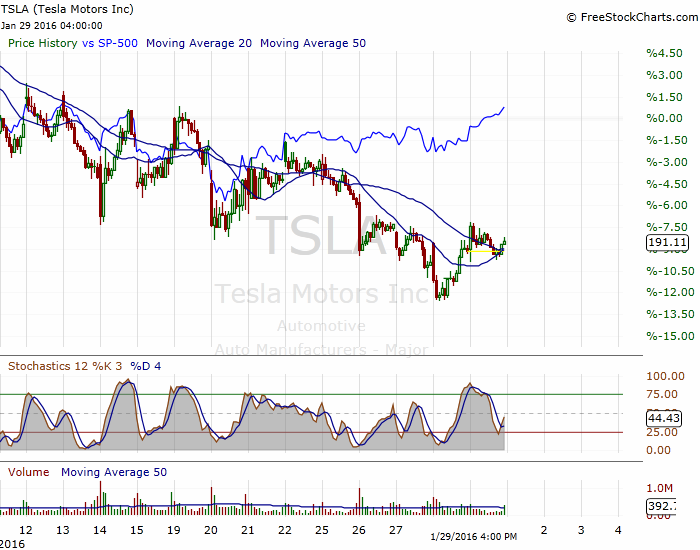
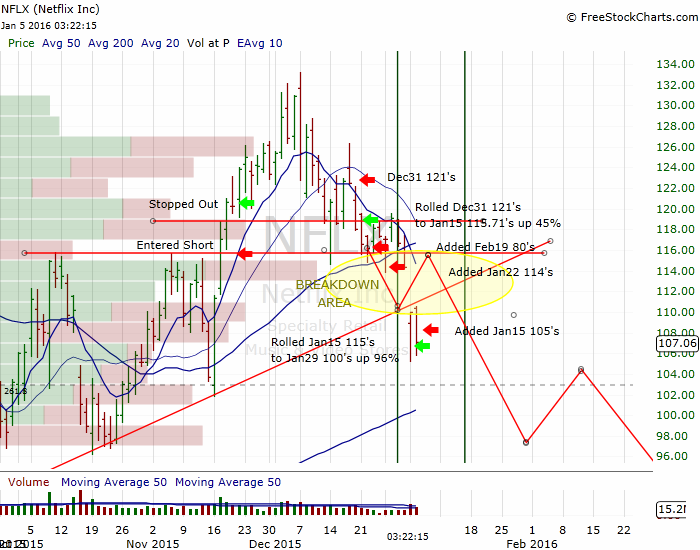
Once it’s clear that one of the above scenarios is playing out, I will jump all over the short ideas I’ve discussed already – and I’ve added a few new names below.  When the time is right I will discuss which ones I’m focusing on in a follow-up post:

  1. NFLX
  2. TSLA
  3. EA
  4. BAC
  5. MON


Regarding the rest of the financial landscape, I think it’s important to understand what the central banks are trying to accomplish.  Neil Howe possibly put it best and I’ll paraphrase:

Central banks are trying to pry the extra cash out of peoples pockets with negative interest rates.

They’re trying to get you to spend your money!  They desperately need inflation.  Removing cash currency under the guise of illegal activity is simply another maneuver to gain control over the economic levers.  If we can’t horde cash, then the negative interest rate policy (NIRP) will have more of an effect.  I’m sure the iBankCoin readership realizes this.

I’m trying to figure out how to 1) safeguard myself from this development and 2) position myself to prosper from it.  Gold seems obvious at this juncture, but I don’t feel comfortable chasing it.

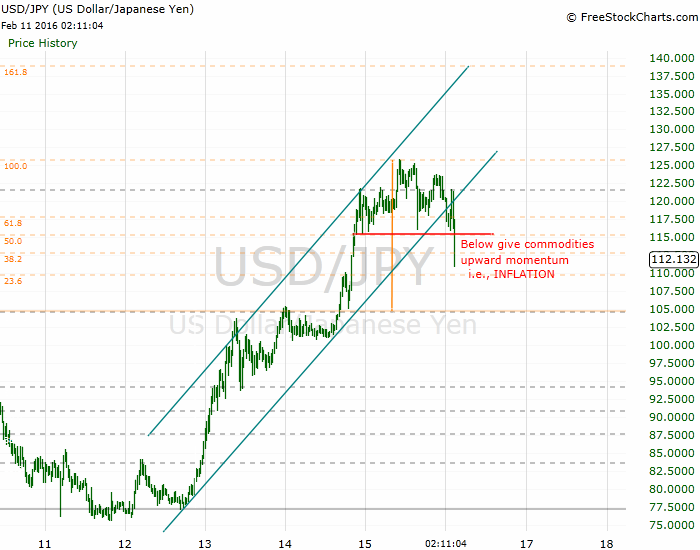
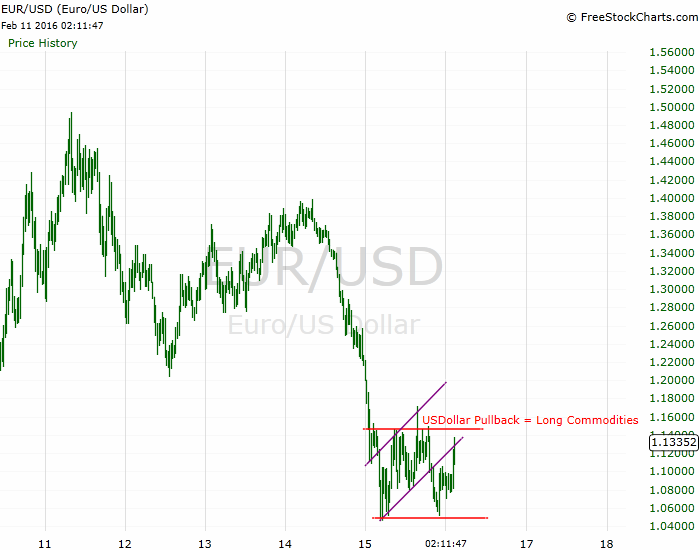
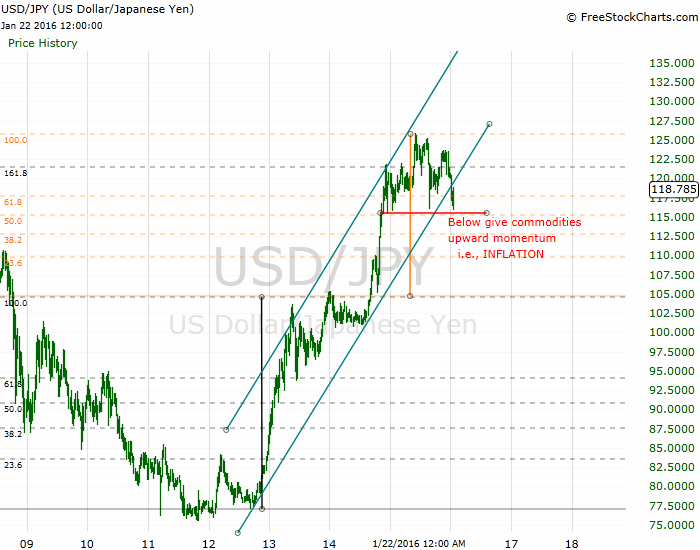
I’m leaning toward simply shorting the Japanese Yen and/or the Nikkei.  I think there’s a chance the USD/JPY currency cross and the Nikkei correlation breaks down – is it possible for them both to go down?  Last week’s carry trade unwind has me sitting on the sidelines.  I also think shorting the Euro (EUR/USD) could be a compelling idea, now that it’s had a pullback.  However, I don’t have a lot of conviction yet.

The question remains: is what we are seeing in Japan (and Europe) going to be what plays out here in the US if/when the economy rolls over??

I’d love to hear what you think and I encourage you to post a comment below.

And follow me on Twitter @dyer440

Comments »

Currencies and Oil Weakness

In early December 2015 I warned not to touch commodities until specific currency levels were breached on the USD/YPY and EUR/USD crosses.  For reference: Calling All Degenerate Oil Gamblers!!.

I was specifically referring to crude oil and energy related exposure.  That was back when everyone was calling for a bottom in crude every other day.  I remained short energy exposure and it generally worked out.  Now it’s time to revisit those currency levels because the Yen Carry Trade is unwinding.  This has led many to question what the hell is going on – including myself.

From my article:

Stay away from Long Oil exposure (and commodities in general) until:

1) The USD/JPY cross falls below 115.50, AND

2) The EUR/USD cross trades above  1.148

The USD/JPY level has been breached due to the unwind, the EUR/USD has not (yet):

USDJPY_02112016

EURUSD_02112016


The interesting thing to note regarding oil and energy is the decoupling from US Dollar correlation.  I believe this is a testament to the weakness in crude oil and energy related names.

On the other hand, it may be time to look at non-energy related commodities.  Is this the turn?  Is inflation (or US Dollar devaluation) on our doorstep?  If you’re listening to the story Gold is telling, you may be inclined to think so.  Instead of chasing gold higher, I’ve got a better idea.

Here’s the Trade:

Continue shorting oil & gas related companies and derivatives, I like these two:

  • $USO
  • $UNG

I would also stay short energy related equities.  I would recommend one or two but I no longer have an edge in any of them specifically now that $COP cut their dividend (as I warned multiple times here).

So here’s what is happening: the  oil & gas companies in the US are pumping whatever they can simply to bring in cash flow.  The cash is not returning a positive return on their initial investment, but at least it’s returning cash – which these companies desperately need to pay their bills (and notes).  Bottom line is they are NOT cutting production, they cant.

They’re in a financially engineered negative feedback loop.

The Saudi’s will not come to the rescue.  I’ve given you their script already, here.

Good luck out there, and follow me on Twitter @dyer440

Comments »

Keep Your Cool

I’ll be honest, I’m swinging for the fences with the ideas and setups I trade and discuss here.  I’m using a lot of leverage and hoping to be compensated for the risk.  It’s basically a big psychological game of chicken against my own fear and greed and various other emotions that all occur when winning and losing money.  That’s my version of trading in a nutshell.

In order to bear the psychological strain I like to plan ahead and work in some contradictory research just in case all of my best laid plans go to hell.  If I feel like I have too much one sided exposure I want to be able to quickly deploy a few ideas contrary to my primary thesis – as a hedge.

As you probably know, my forecast is for more blood, basically a test of the 2007 high’s on the Russel 2000 Index before we see a nice bounce in equities.  In this article I’m going to share how I’m planning for the eventual bounce by monitoring which companies are holding up well.  As I mentioned in my last article (with a horrendous cover photo much to Le Fly’s displeasure) I discussed buying strength and selling weakness: One Weird Trick to Pick Stocks!!

In a similar fashion to the exercise in that article, I find it valuable to evaluate companies that are trading UP in a hugely DOWN tape.  These are the companies that I will go long either for a bounce, or to hedge my short exposure.

Therefore, I ran another screen using the following metrics:

  • +Mid-sized market cap. (over $2bln)
  • Average Volume over 1M
  • Optionable and Shortable
  • Price over $5
  • Priced above 200 day simple moving average
  • and most importantly: Price UP

I then removed the Utilities and Gold companies (which may honestly be good buys here) and the Oil & Gas companies.  Remember, I’m not going long commodity exposure until this happens.

The results included about 25 companies that I then scanned for 2 qualities: 1) Solid Charts, and 2) Option liquidity.  The last part is qualitative and everyone will have their own opinions, likes and dislikes.  Note: option liquidity is important; there’s probably only around 250 companies with enough option volume to have tradeable bid/ask spreads – which substantially shrinks the universe of possibilities.

Here’s the results (in no particular order):

  1. Allstate Corp. (ALL) – Financial
  2. Altria Group Inc. (MO) – Consumer Goods
  3. Comcast Corp. (CMCSA) – Services
  4. Lockheed Martin Corp. (LMT) – Industrial Goods
  5. Raytheon Co. (RTN) – Industrial Goods
  6. Verizon Communications, Inc. (VZ) – Technology
  7. AT&T Inc. (T) – Technology

So Here’s the Trade:

Going forward, I’ll monitor these names for continued relative strength.  If I think the market is going to turn or I need a hedge simply to reduce the psychological stress, I’ll go long one or more of those companies – following some sort of structured plan.

I’ve provided two examples below.  The first is Raytheon (RTN) – refer to the long term chart first, then the short term structured setup:

RTN_LT_02072016

RTN_02072016

Pretty simple here – enter on a break of the green line, scrap the idea on a break of the red line.

Next up is Lockheed Martin (LMT) – long term, then short term:

LMT_LT_02072016

LMT_02072016

Same idea – enter on strength (green line), scrap it on weakness (red line).

As an aside, I’ve been trying to come up with long term “investor” type ideas.  If I had a lot of money to manage I’d be focusing on three areas:

  1. Military/Defense Spending
  2. Health Care
  3. Water

I’m still researching these areas, and it’ll be a future article topic, but I’m glad my screen turned up some companies from these sectors.

Last note: Monday is extremely important, the markets are hovering on short term support.  If we break down below it there should be a significant flush.  So sharpen your swords and put on your best armor Monday morning, it should be interesting.

Follow me on Twitter @dyer440.


Comments »

One Weird Trick to Pick Stocks!!

Here’s a hint… when the market has a bull’s on parade rally, and that stock you own doesn’t go up – that’s SUPPLY (people are selling).

Conversely, when the market craps the bed and that stock you’ve been meaning to buy doesn’t go down – that’s DEMAND (people are buying).

I’m a strong advocate for buying strength and selling weakness.  Let the price action tell you what to do next.

Here’s the trick: you want to start accumulating shares in the companies that don’t go down on red market days.  You may not catch the latest momentum stock bouncing, but you also don’t run as much risk in catching more downside.  In the same sense, if that momentum stock doesn’t bounce along with the market on a huge up-day, what do you think might happen if the bounce reverses?  That’s right, you’ll be stuck holding too much risk, and with no demand in sight you’ll be one of the weak hands chasing the bid/ask lower in a desperate attempt to sell.

Therefore, given my intermediate term market forecast which you can read here: Market Forecast – More Blood, and given the bounce in equities last week, specifically Friday, I ran a screen for stocks down on Friday:

Finviz_screen

Nothing fancy here folks, but that is a good list of short candidates.

Now, if you’ve read any of my articles you probably know that I’m a huge Netflix bear (Reminder – Stick to the Plan!!, F-U Money, and Crazy for Netflix??) and for full disclosure I’ve got most of my account leveraged in NFLX puts.  So I’m happy it made the cut.

This screen has turned up another gem of a short in my opinion – and that’s Gilead Sciences Inc. (GILD).  The biotech sector has shown significant weakness lately, and in my opinion you can use GILD as a play on more weakness.  I’m also short Tesla Motors (TSLA) which was green on Friday but has been under performing since we bottomed last week (so it qualifies in my mind).

Here’s the Trade:

If these companies continue to underperform the overall indices, start to build short positions.  If (when) the market shows it’s hand and hit’s the wall of supply waiting overhead, you’ll already be positioned for it and have an edge.  This strategy works well to compliment long positions you may already have in your portfolio.

Let’s take a look at the supply gap for the three companies I’ve mentioned:

GILDvsSPX_01312016 NFLXvsSPX_01312016 TSLAvsSPX_01312016

Notice in the charts above where the overall market bounced on Jan. 20th; these companies then continued to trade lower.  If/when the market gives up those gains, it’s easy to imagine the ugliness to come for these three names.

Now, when the market does get ugly again, run the same screen – but for companies trading green in a sea of red.  I think you can make a living trading with this one simple technique. Remember to always buy strength and sell weakness.

Follow me on Twitter @dyer440 to see how I play it (never perfect, but always honest).


Comments »

Market Forecast – More Blood

The January rout has shown this years hand early.  Most have been punched in the face and are now bloody and bruised.  The two day bounce in equities has provided momentary respite however, I believe it may be short lived.  The supply waiting for the current dip buyers is enormous, and it will further shock the uneasy hands to the sidelines.

First up, the Russel 2000; while technically a work of art, it has been a great way to gauge the market.  The target is the 2007 top around $850.  The current dead-cat bounce we’re experiencing should not go above $1077 or I am wrong.  More likely it will reverse around $1040, then head lower to $850, which is -16.7% from current levels:

RUT_01242016


Next, the Dow 30; dust off your “Dow 14,000” hats from 2007 because we are headed back to those levels (a 13% pullback from here).  The good news is we will likely bounce from there sometime in Q2:

DJ30_01242016


So the bottom line for equities is this, prepare for the bounce to end and the downtrend to resume.  The downside targets are the former 2007 top levels.

On the bright side however, I believe the rest of the world is more screwed than the US.  Take Europe for example; the Europe 350 Index ($IEV) has not been holding up well.  Another -17% appears in the cards – somewhere around the $31 level – perhaps more before 2016 is over:

IEV_01242016


For homework I will refer you to the Japanese Nikkei – talk about ugly.  That may be the best short of them all, especially if you enjoy taking on “whatever it takes” Central Bankers.

Now, where it gets trickier is bonds.  Could bonds also pull back in the face of an equity correction?  I don’t think so, but the zero-boundary for rates is a natural wall – until the Fed changes the playing field again.  Refer to the 7-10 Yr. Treasury Bond ($IEF) chart below:

IEF_01242016


Will that trend line hold, and more importantly, what does it imply about our world if it doesn’t?

Lastly, I will touch on currencies.  I first presented the USD/JPY and the EUR/JPY crosses in my article Calling All Degenerate Oil Gamblers!! last December.  Some of you thought those levels were apparently too far-fetched to be approached anytime soon…

I’ll therefore leave you with an update to the USD/JPY chart:

USDJPY_01242016


Is the US Dollar rally coming to an end?  Or is this simply a healthy pullback?  Will the Fed reverse course, causing the dollar to also reverse course – which would trigger my currency levels?

I try to picture a world that the charts are suggesting.  For example: equities pulling back to 2007 levels, bonds breaking decade long up-trends, currencies suggesting the US Dollar rally may be over (at least in Yen terms), Europe is screwed, Japan is more-so screwed.

This is all just food for thought at this point.  I welcome your thoughts/comments below.  Follow me on Twitter @dyer440.

Comments »

BTFD Conditioning

The markets have changed in character.  The BTFD crowd is having to deal with recency bias this morning year.  During the market run-up every pullback saw immediate investor demand to get “in”, resulting in a rapid V-shaped recovery.  Once the market bounced everyone chased it higher and higher.  Now, much like Pavlov’s dog, everyone is conditioned to buy the dip.

Notice your own conditioning.  

conditioning

Being net-short I have noticed that I’ve been extremely fearful of a rip-your-face-off rally (due to my own conditioning).  However, we have seen a consistent amount of supply hitting the tape this year during setups that until recently would have led to multi-day rallies.

This is the sign of the bear.

In my opinion it’s time to put away the toys like the FANG stocks, or the Biotech names; use them for speculation only.  If you’re not into shorting, it’s time to play the capital preservation game.

Shorting has gotten a bad rap lately; I’ve heard commentators describe ‘how hard it is’, and how ‘it’s a losing game’.  Give me a break.  Learn to use options so that you can only lose what you have put at risk, then give it a go.  At the very least you can employ an inverse ETF into your portfolio when the S&P 500 breaks under it’s 200 day moving average on a weekly closing basis.

The bottom line is that you should have noticed a change in how the markets are trading.  The typical setup over the past few years is no longer working.  Notice your biases and trade smaller until you have a feel for the market.

If the S&P 500 cannot get above 1,950 we are in a bear market.  I hate how it sounds, but that’s my “level”.

Follow me on Twitter @Dyer440

Comments »

GET OUT OF $COP

ConocoPhillips will have to cut their dividend, there’s no if’s and but’s about it.  If you have any faith in their management, you have to believe they would not chose to take on MORE debt just to pay out $3.6 Billion over the next year.

I understand CFO Jeff Sheets declared recently that the company’s “top priority is the dividend.”  Those are the type of statements that make me cringe as an investor!  Think about it, some “experts” believe that half the oil and gas industry may go bankrupt.  If I’m a long term investor of COP, I want the company’s ongoing viability to be the CFO’s top priority.

COP has an earnings announcement on Feb. 4, 2016.  Given the extraordinary circumstances playing out in the energy markets, I think it’s reasonable for them to back down on this issue.  Who would blame them?

Expect a dividend cut.

So Here’s the Trade:

I told you in a recent post that the $42 level was key, depending on how the overall market bounces.

Well, equities bounced yesterday and COP rallied up near the $42 level ($41.82 is close enough for me), see the chart below:

COP_01152016

That is a 30 minute chart.  The grey line is the $42 level.  The arrows are my numerous maneuverings (red = adding to shorts, green = skimming off profits).

Bottom Line: if you want some short energy exposure – COP is the play as long as it is sub-$42.

Follow me on Twitter @dyer440

Comments »

Coal Will Stay Underwater

I expected Arch Coal’s Ch. 11 Bankruptcy to signal the bottom in the coal market.  I was wrong however and here’s why:

If Arch can continue operating as usual without neither lien holders nor bankruptcy courts requiring them to sell assets, then zero coal comes off the market (at least for a while).  Arch is currently flooding the market with cheap coal in order to keep cash flows rolling in.

Take their Leer Mining Complex for example, they are exporting metallurgical coal in the low $40’s per ton; I think they are taking $20-30 losses on each ton of coal sold at these prices.  In the process they are driving the rest of the industry down the toilet with them.  Nobody can produce deep coal with positive returns at those prices.

Therefore it’s simply a financial engineering game between the lenders, courts, accountants, and cash flowing assets.  Eventually, they will have to stop selling coal at those prices.  But until someone makes them stop, the coal sector will not find a bottom.

The same thing is happening in the Oil and Gas industry… each company is waiting for the other to drown in debt.  Meanwhile, as long as cash is rolling-in albeit with negative returns on capital they can attempt to stay afloat – breathing air through one of those skinny flexible straws!

Blow-through-straw-300x211

Stay away from these energy producers – they are in a race with each other to the bottom.  The prices of the underlying commodities will not bounce until the supply comes off the market.  The only savior is bankruptcy courts and lien holders taking a hard line and demanding asset sales.

Comments »

The Grandmaster of Oil: Ali Al-Naimi

Saudi Arabia is playing chess while everyone else is sitting at home watching reality TV and occasionally playing with themselves.  The Saudi Oil Minister Ali Al-Naimi is kicking your ass and you probably didn’t even know it – until right now.  Here’s how he’s done it so far:

Step 1: Accumulate a horde of US Dollars.

Step 2: Show the World who’s really in control of the oil market.  His words in December 2014:

We want to tell the world that high-efficiency producing countries are the ones that deserve market share.

Crude Oil Prices subsequently collapse.

Step 3: Tell the rest of OPEC to pound sand.

Crude continues it’s plunge.

Step 4: Sell back US Dollars… wait whut!?  – Yep, that was a hedge.  Remember, they’re playing chess.   Meanwhile, guys like Harold Hamm scrap their hedges.

CEO of Continental Resources Hamm enters the courthouse for divorce proceedings in Oklahoma City


Step 5: “Shut them Haters Up”

Sorry I had to.  You should play that in the background while you read the rest; the Grandmaster of Oil is willing to go full Gangsta!

There’s a lot of “Haters” out there.  They believe Saudi Arabia is having huge budgetary issues and that they’ll soon have to give-in and forego this effort to bankrupt the rest of the worlds oil production.  The Grandmaster of Oil told us in the interview I referenced above that it doesn’t matter!!

The interviewer asked him, almost pleadingly, “But you have announced that you will have a budgetary deficit?”

His response:

A deficit will occur…. We have no debt. We can go to the banks. They are full. We can go and borrow money, and keep our reserves. Or we can use some of our reserves.

Go to the banks huh?  How would they do that?  What would that look like?

Well now we know.  It looks like this: Open the Saudi Arabian stock market up to foreign investors (see here), then IPO the biggest company on the planet (see here).  That’s Gangsta!

Bottom line, they won’t stop until there are mass casualties – they can’t stop – the future of their kingdom depends on it.  Now that hopefully you finally realize the non-Saudi petroleum producers are screwed…

Here’s the Trade:

Stay Short ConocoPhillips (COP).

I already gave you this one back in early November 2015, see my post Commodity Not-So Super Cycle.  It remains my favorite energy short, reason being simply because they haven’t cut their dividend yet (as I discussed in the article).

Here’s the chart, the red arrow points to where I handed you free money.  The green line was my original price target ($42):

COP_01102016


Depending on when equities bounce this week (if they bounce), I think COP either blows right through $42, or bounces off of it.  Use the $42 level as resistance or support whichever the case.  For example, if we blow through $42, short it again once it bounces back to that level.  Conversely, if we bounce and COP is near $42, wait for it run – once this cold fish gets tired of running, re-short it.  It’ll be well below $42 once they cut that dividend!

Good luck.  Follow me on Twitter: @dyer440


Comments »

REMINDER!! – Stick To The Plan:

The hardest part of the trading game is sticking to a strategy.  Short term-ism is pervasive is our culture and more so in finance.  Therefore, I’ve provided a quick reminder of what is working below:

First and most importantly, Netflix – the chart below has my original forecast along with the various maneuvering I’ve done:

NFLX_01052016


NFLX target = anywhere in the $60’s.  Refer to the previous posts here and here.

Next up is the Visa vs. American Express pair.  Refer to the original post here.

This pair has worked out well and we haven’t been stopped out of either leg of it, which I hope continues.  Either way however, this is a great trade setup in order to pivot with the market either up or down.  I really like the short on AXP here:

AXP_01052016


Regarding commodities – which I have beaten to death – literally (shorting) and figuratively, I believe value investors are putting money to work in these sectors to begin 2016 (especially oil & gas).  This should have the effect of holding them up relative to the underlying commodities. I therefore favor shorting the commodities over the equities right now.

However, keep in mind the currency trigger levels I pointed out here.  If/when those break it’ll be time to get long commodities again – as inflation perhaps finally wakes from it’s slumber.

Currencies are volatile these days (huge understatement).  I’m beginning to believe that Crude Oil is the dog wagging the proverbial US Dollar tail – and not the other way around.  The FX flows due to the crude trade are simply massive.  For example, since Q3 2014 the Saudi Arabian Monetary Agency’s reserves in foreign securities have declined by $71 billion! Reference

These could be are the capital flows causing the US Dollar to rally.

Good luck out there.  I’ll have another trade setup later this week, but for now “Stick to the Plan”.


Comments »