I recently gave a presentation on the Natural Gas market at work and I think it could be beneficial to iBankCoin readers. The following is a summary of the talk and I’ve used some of the graphs/charts from my slides in this article.
Natural Gas prices are currently at historical lows mostly due to the shale fracking boom. The low prices are driving a number of factors that are leading to increased consumption, mainly LNG exports and Coal to Gas power fuel switching derived from new environmental regulations on coal fired power plants. The net result has been increased production and also increased consumption. We are in an era of seemingly cheap fossil fuels and the utilization of cheap natural gas has been dramatic:
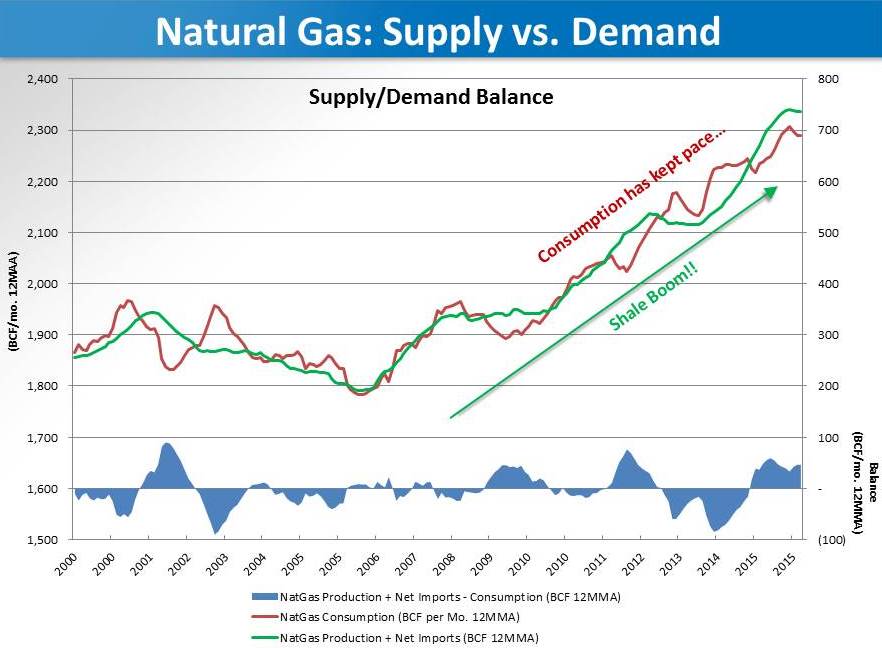
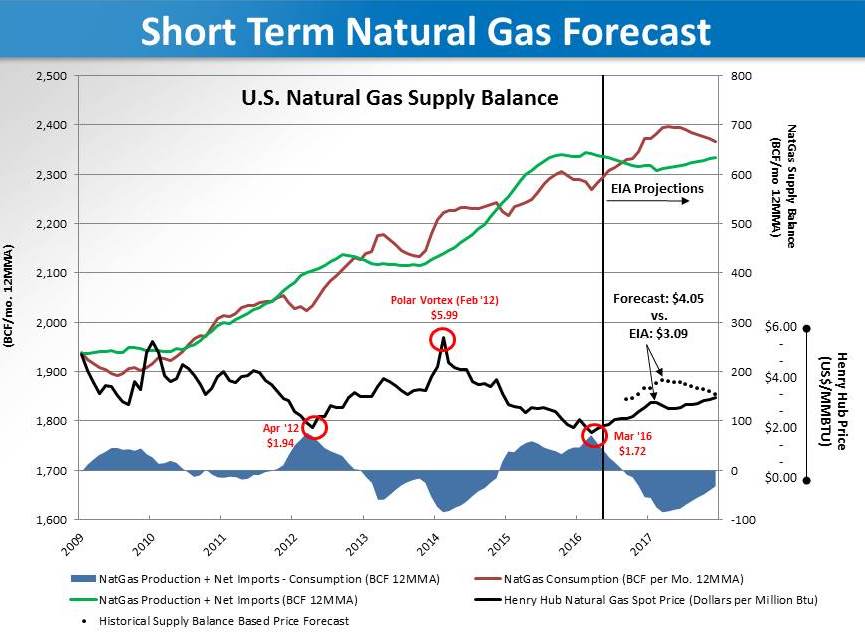
The supply/demand balance is very well correlated to prices and I’ve used the relationship between the two time series to establish a forecast for prices through 2017, refer to the chart below. As you can see from the chart, the EIA has projected demand to outpace supply for most of 2017 which should lead to higher prices:
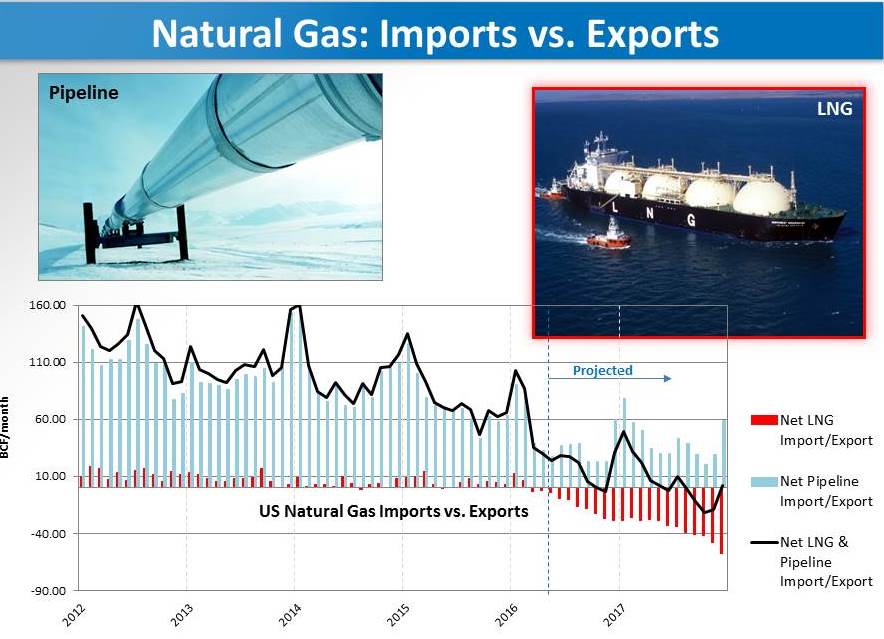
The U.S. is historically a net importer of natural gas from Mexico and Canada however, the situation is changing due to the abundance of production from the shale boom. The net affect on the natural gas supply/demand balance moving forward will be impacted by increased LNG exports and pipeline exports. It’s often overlooked that pipeline flows in certain areas have actually reversed.
By the end of 2017, the import/export volumes should be about even; by 2018 the EIA has projected the U.S. to be a net exporter of natural gas, see below:
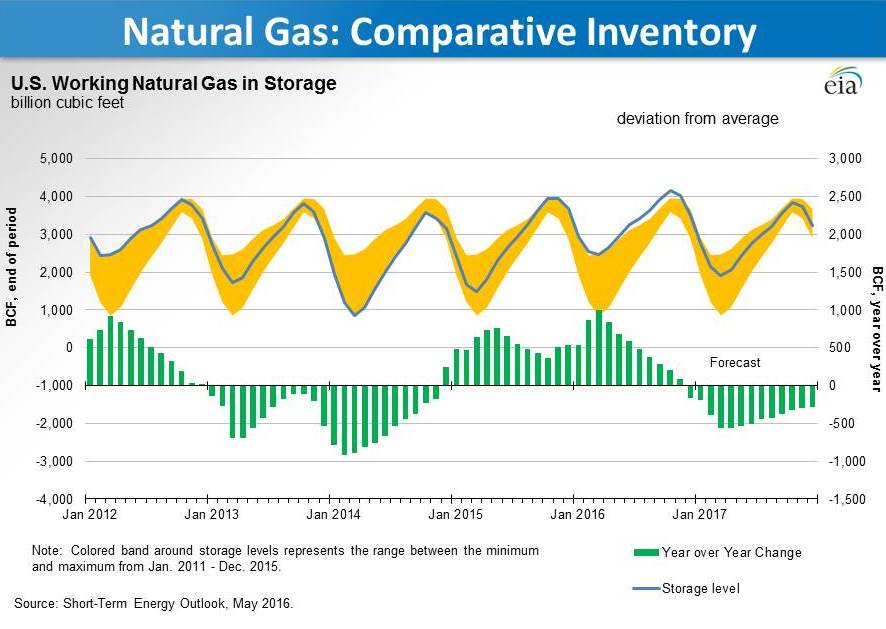
Another way of looking at future natural gas prices is to use the year over year inventory levels. As you can see from the EIA’s chart below (which I modified), the natural gas inventory levels are drawn down each winter predominately due to home heating usage; once spring comes around the inventories are built back up. Inventory levels are currently above their 5 year averages due to the very mild 2015-2016 winter. It appears the EIA used an average winter next year and estimated average draws on natural gas storage.
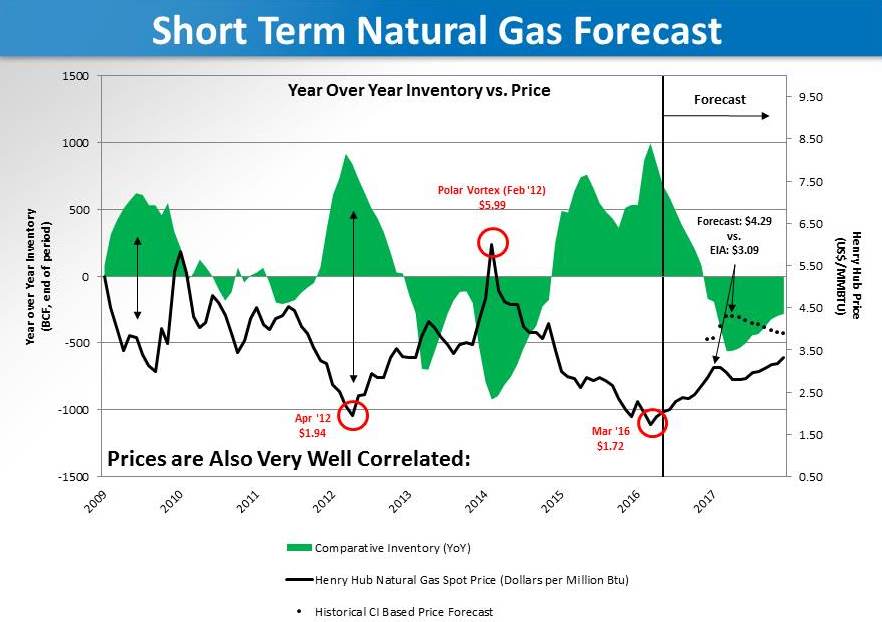
Similar to the supply/demand balance shown above, we can use the year over year inventory levels to project future natural gas prices (albeit with different inputs). As you can see below, inventory projections suggest prices well above $4 (MMBTU):
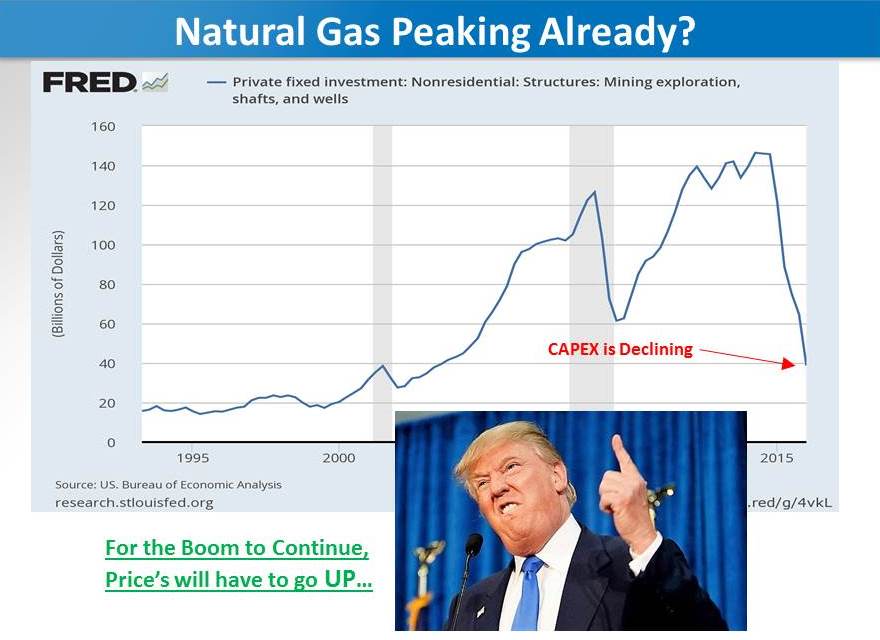
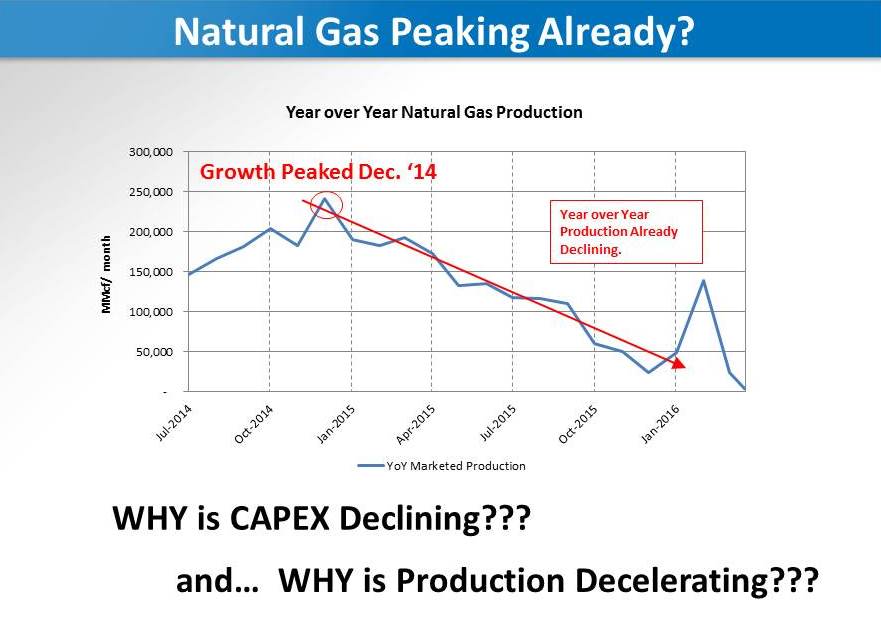
Although the technological advancements in the shale fracking space have led to cost savings, the practice is still very capital intensive. Steep decline curves result in a hamster wheel effect of spending CAPEX on drilling and stimulating well fields, followed by more spending in order to keep production growing. Once the CAPEX is cutoff, it’s only a matter of time until production levels decelerate year over year and eventually decline.
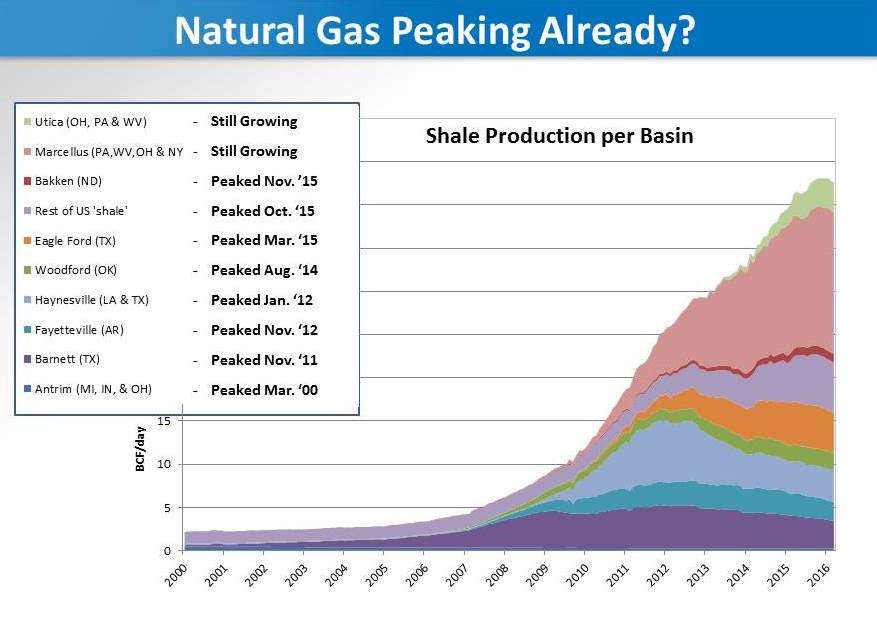
I believe we are currently in the deceleration phase and the natural gas production figures will soon begin to decline. Most of the shale basins have already witnessed peak production. I don’t think they are in terminal decline per se, only that additional capital will have to be spent in order for production levels to rebound. Overall, CAPEX in the energy sector has fallen dramatically and it appears the period of easy money is over.
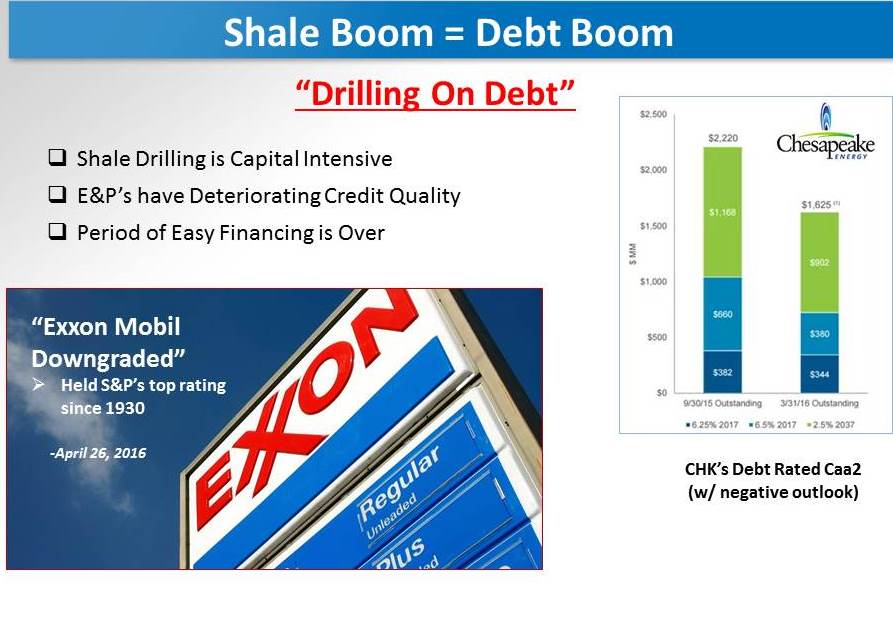
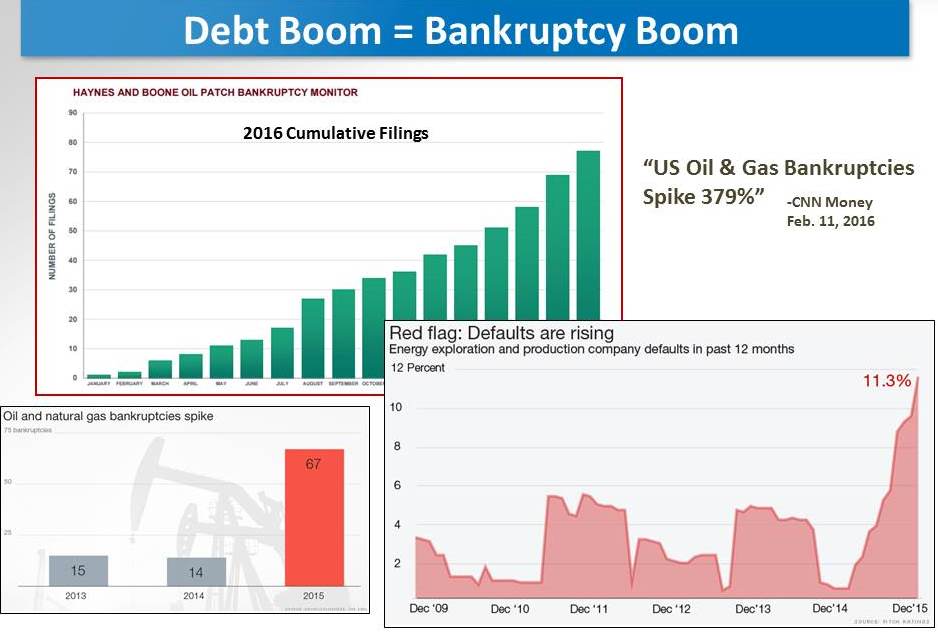
The Shale Boom was built on the back of a Debt Boom. Easy money from the Fed’s multiple rounds of QE combined with increases in fracking technology led companies to believe a real energy revolution was taking place. E&P companies levered-up their balance sheets and boom towns were created form south Texas to North Dakota. This story has played out many times historically… the Debt Boom turns into a Bankruptcy Boom as prices fall dramatically due to oversupplied markets.
Energy companies across the board are seeing debt downgrades and deteriorating credit quality. The period of easy financing is over. In order for additional capital to be allocated to new energy investments, prices for these commodities will have to be higher than they are today; ROI’s will demand it.
As you can see, without additional spending the shale boom may be over. The problem is, most project continued growth through 2040 with prices below $5 (MMBTU) for the entire period! I think these estimates are absurd, refer below for the EIA’s natural gas production projections without the Clean Power Plan:
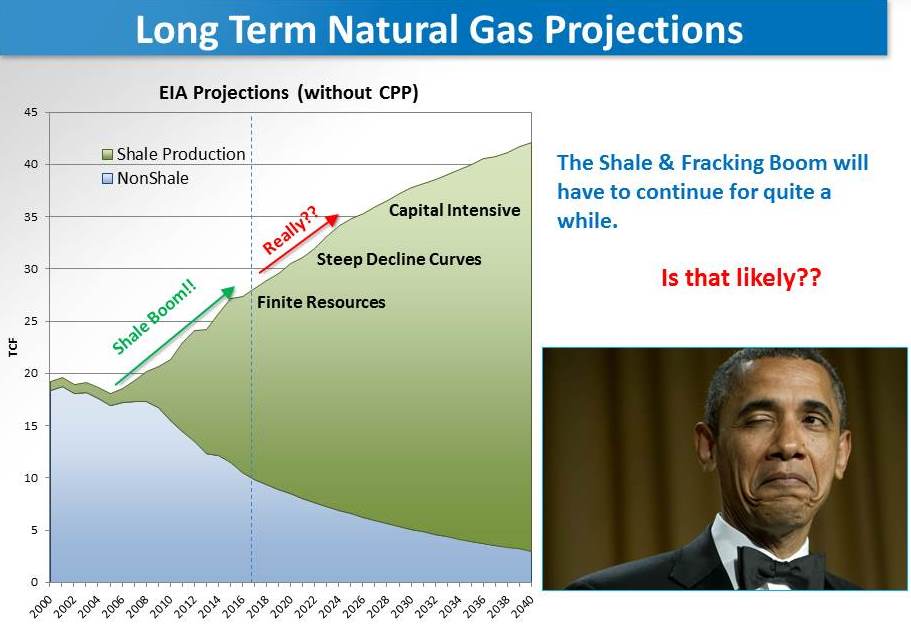
In summary, the EIA projects prices will rise above $3 per MMBTU sometime next winter. My own work suggests natural gas prices will reach the $4.00-4.30 range.
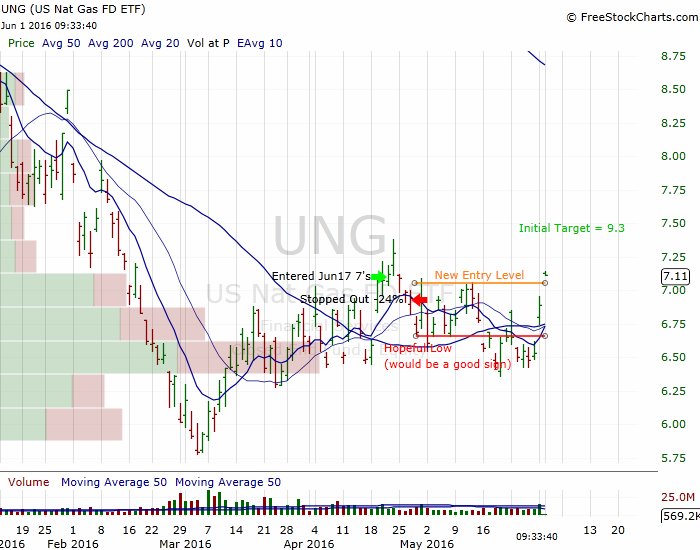
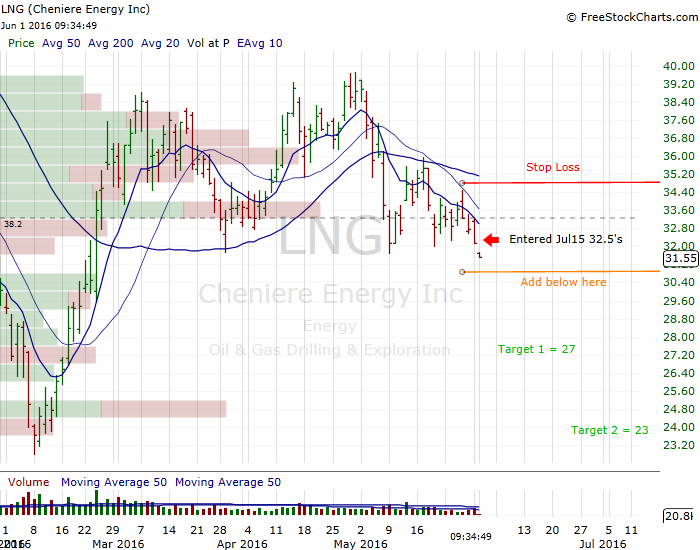
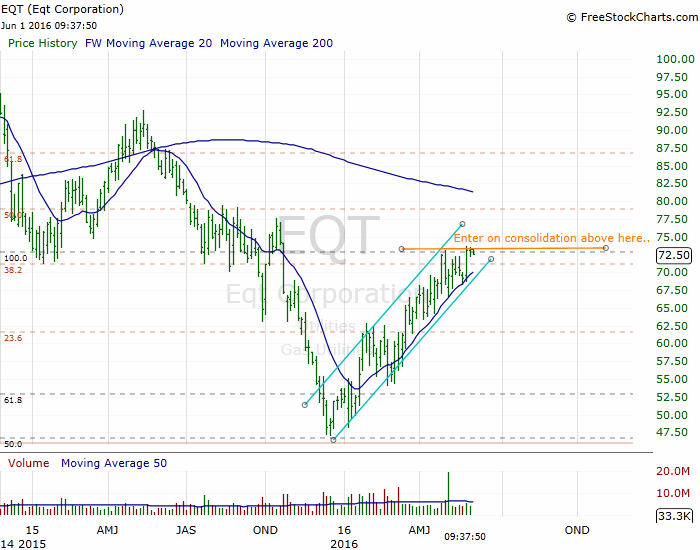
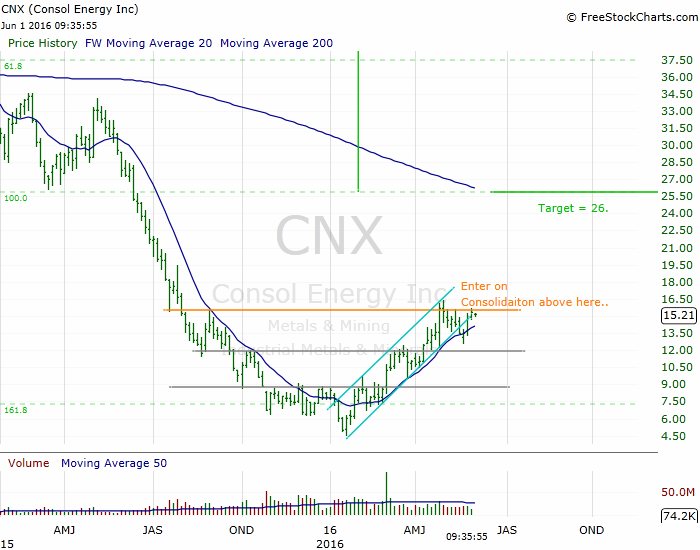
Whether in the E&P space or even in the coal sector, there will be opportunities to profit from a rise in natural gas prices. I will do a follow-up article on potential investments stemming from this idea, so stay tuned.
Please feel free to share your thoughts in the comments below and follow me on Twitter @dyer440.
Comments »
