iBankCoin
Home / Tag Archives: usd/jpy

Tag Archives: usd/jpy

Monetary Divergence

The primary driver in today’s markets are the various Central Banks and their desperate attempts to stimulate inflation of any kind within their economies.  I believe we can view the markets through the lens of Central Bank policy and the associated market movements, and gain some insight into potential outcomes.  Hopefully this will provide some actionable trading and/or investing setups.

Issue #1: The elephant in the room in the Federal Reserve; they are in a tightening posture and I believe markets are underestimating the number (and possible dates) of future rate hikes.  On the other hand you have the rest of the world’s Central Banks, seemingly dead-set on doing whatever it takes to stimulate their economies.  This is despite the fact that each action becomes less and less effective.

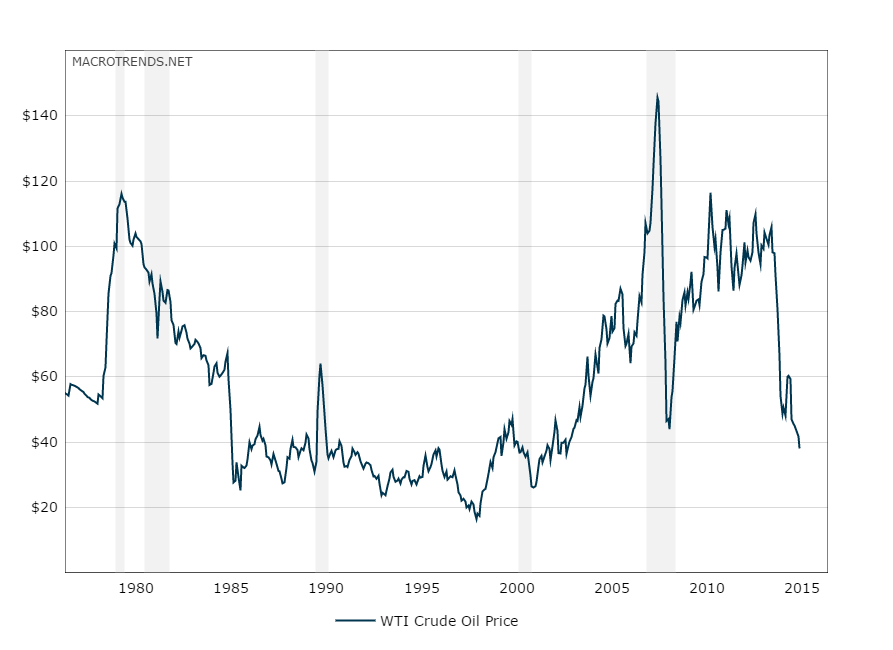
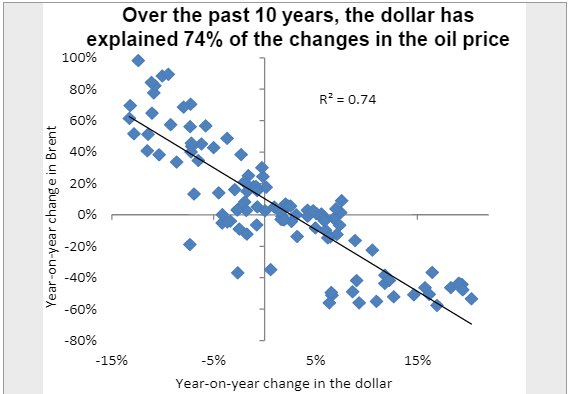
Issue #2: We have the commodity markets, most of which are showing the characteristics of having potentially bottomed.  For example, crude oil is up something like 45% since it’s lows earlier this year.  It could simply be a short covering rally, but every bottom starts out that way.  I’ve said it before (here), in order for the commodity complex to demonstrate a sustained rally, one that perhaps leads to the next up-cycle, the U.S. Dollar needs to pull back against the rest of the worlds currencies.

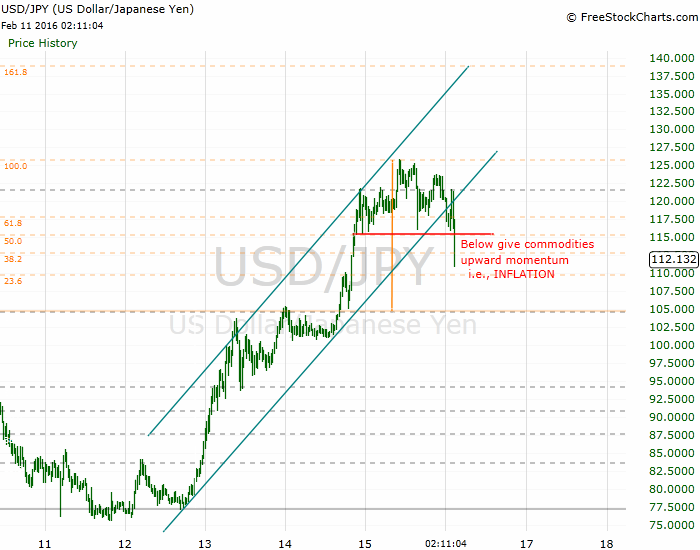
Given that the above two issues are definitely related, what should we expect moving forward?   Let’s take a look at the currency trigger levels from my previous post:

USDJPY_03092016


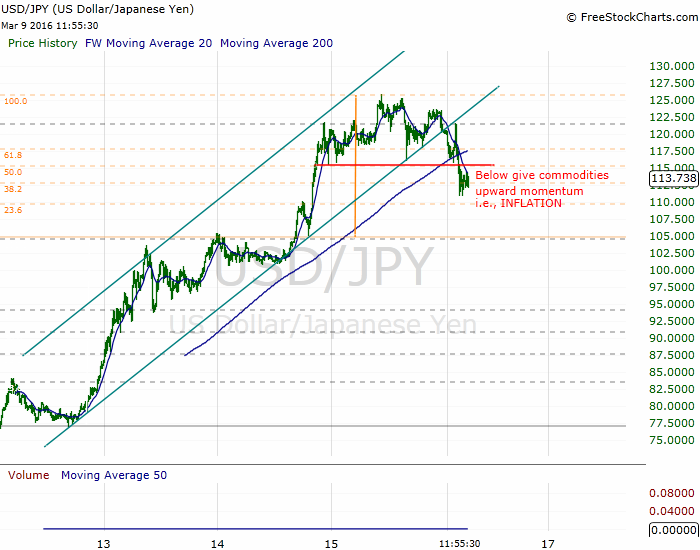
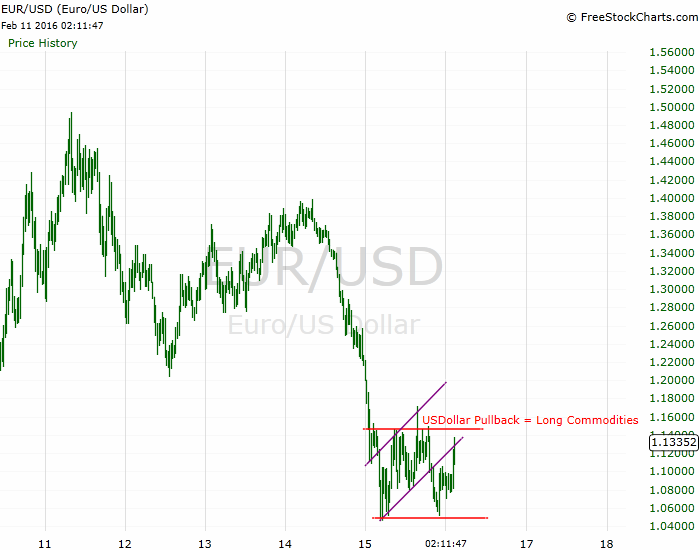
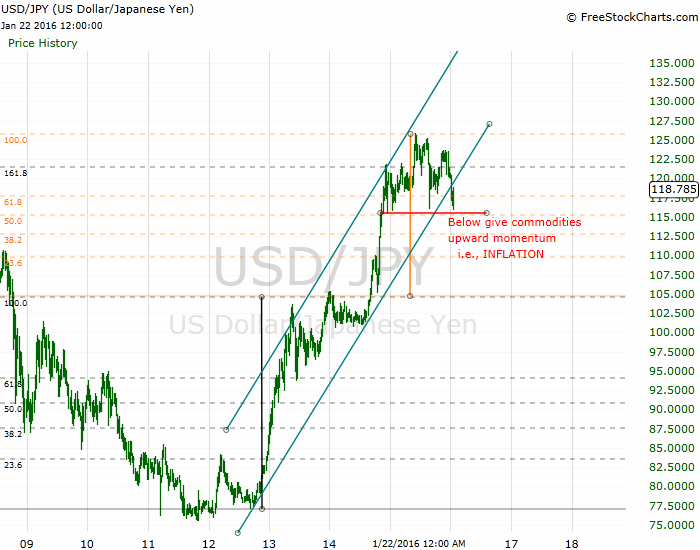
Taken by itself, the USD/JPY cross trigger level of 115.50 was a good signal to buy commodities for a bounce; oil bottomed 2 days later.  However, I recommended waiting for the EUR/USD cross to confirm the move, and I suggested using a trigger level of 1.148.  See below:

EURUSD_03092016


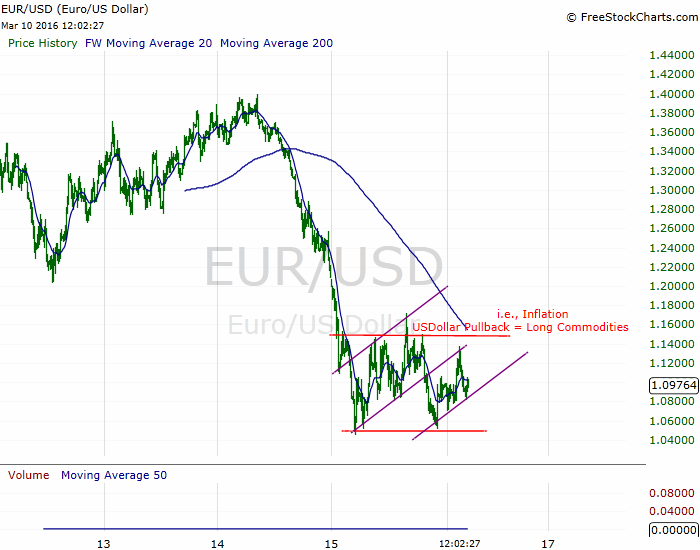
To date, it’s not even close.  My recommendation is therefore NOT to play crude oil or any of the other growth (inflation) driven commodity on the long side, at least until both trigger levels are breached.

If the European Central Bank’s bazooka somehow disappoints, this situation could turn on a dime.  However, I think it’s more likely that Central Banks will continue with their current postures: the Fed tightening while everyone else eases.  Furthermore, I believe the U.S. economy is the proverbial last man standing, meaning we are stronger relative to the rest of world.

This is important, it implies that all of the Central Bank posturing is perhaps “correct” on a global scale (i.e. relative to everyone else).  For example, if the U.S. economy is stronger than the rest of the world, perhaps the Fed should be in a tightening posture.  Likewise, if the Japanese (or European) economy is struggling, they probably should be easing.

In summary, I expect the U.S. Dollar to outperform other currencies.  Why?  Because, if the Fed is raising rates and the U.S. economy is outperforming (on a relative basis), the U.S. Dollar will outperform.  Growth commodities should therefore either pull back from current levels or languish into a trading range.  Either way, they do not represent a good risk/reward long at this point in time.

So Here’s the Trade:

Short the banks – the risk is the Fed will guide to further tightening (or even raise rates in March).

Short the EUR/USD – divergent policies will continue and the performance of each economy will also continue to diverge (U.S. > Eurozone).

Short any of the insolvent Oil & Gas companies that are up over 30% in the past two weeks – research their bonds, find the ones that are due soon – these companies are at risk of default.

Follow me on Twitter @dyer440


Comments »

Market Forecast – Upwards Climb?

The markets have been erratic over the past week and it’s no surprise given the news flow.  I’ve had my head on a constant swivel this past week, playing defense and attempting to not get blindsided.  Presidents Day has provided me with an extra day to take a deep breadth, soak in all the relevant information and update the forecast.

Working off of my last forecast (click here) I will provide an update and then briefly discuss the risks and rewards playing out in our financial markets.

As you know, I am currently keying off of the Russell 2000 Index and still believe we will hit the 2007 highs of around $850 by this summer (at the latest).  Last week we briefly broke through support at around $960 before reversing rather quickly.  Refer to the chart below:

RUT-X_02152016

Now that there’s numerous market participants caught short (including myself), there is increased risk of the market bouncing higher before reversing and continuing the primary downtrend.  I will cover my short exposure above $984 and let my long hedges run while the market bounces.  I expect equities to reverse near $1024 on the Russell (and possibly even as high as $1077 – but I give that less probability).  Refer to ‘L1’ and ‘L2’ in the chart above.

The long term chart is below:

RUT-X_02152016_LT

Once it’s clear that one of the above scenarios is playing out, I will jump all over the short ideas I’ve discussed already – and I’ve added a few new names below.  When the time is right I will discuss which ones I’m focusing on in a follow-up post:

  1. NFLX
  2. TSLA
  3. EA
  4. BAC
  5. MON


Regarding the rest of the financial landscape, I think it’s important to understand what the central banks are trying to accomplish.  Neil Howe possibly put it best and I’ll paraphrase:

Central banks are trying to pry the extra cash out of peoples pockets with negative interest rates.

They’re trying to get you to spend your money!  They desperately need inflation.  Removing cash currency under the guise of illegal activity is simply another maneuver to gain control over the economic levers.  If we can’t horde cash, then the negative interest rate policy (NIRP) will have more of an effect.  I’m sure the iBankCoin readership realizes this.

I’m trying to figure out how to 1) safeguard myself from this development and 2) position myself to prosper from it.  Gold seems obvious at this juncture, but I don’t feel comfortable chasing it.

I’m leaning toward simply shorting the Japanese Yen and/or the Nikkei.  I think there’s a chance the USD/JPY currency cross and the Nikkei correlation breaks down – is it possible for them both to go down?  Last week’s carry trade unwind has me sitting on the sidelines.  I also think shorting the Euro (EUR/USD) could be a compelling idea, now that it’s had a pullback.  However, I don’t have a lot of conviction yet.

The question remains: is what we are seeing in Japan (and Europe) going to be what plays out here in the US if/when the economy rolls over??

I’d love to hear what you think and I encourage you to post a comment below.

And follow me on Twitter @dyer440

Comments »

Currencies and Oil Weakness

In early December 2015 I warned not to touch commodities until specific currency levels were breached on the USD/YPY and EUR/USD crosses.  For reference: Calling All Degenerate Oil Gamblers!!.

I was specifically referring to crude oil and energy related exposure.  That was back when everyone was calling for a bottom in crude every other day.  I remained short energy exposure and it generally worked out.  Now it’s time to revisit those currency levels because the Yen Carry Trade is unwinding.  This has led many to question what the hell is going on – including myself.

From my article:

Stay away from Long Oil exposure (and commodities in general) until:

1) The USD/JPY cross falls below 115.50, AND

2) The EUR/USD cross trades above  1.148

The USD/JPY level has been breached due to the unwind, the EUR/USD has not (yet):

USDJPY_02112016

EURUSD_02112016


The interesting thing to note regarding oil and energy is the decoupling from US Dollar correlation.  I believe this is a testament to the weakness in crude oil and energy related names.

On the other hand, it may be time to look at non-energy related commodities.  Is this the turn?  Is inflation (or US Dollar devaluation) on our doorstep?  If you’re listening to the story Gold is telling, you may be inclined to think so.  Instead of chasing gold higher, I’ve got a better idea.

Here’s the Trade:

Continue shorting oil & gas related companies and derivatives, I like these two:

  • $USO
  • $UNG

I would also stay short energy related equities.  I would recommend one or two but I no longer have an edge in any of them specifically now that $COP cut their dividend (as I warned multiple times here).

So here’s what is happening: the  oil & gas companies in the US are pumping whatever they can simply to bring in cash flow.  The cash is not returning a positive return on their initial investment, but at least it’s returning cash – which these companies desperately need to pay their bills (and notes).  Bottom line is they are NOT cutting production, they cant.

They’re in a financially engineered negative feedback loop.

The Saudi’s will not come to the rescue.  I’ve given you their script already, here.

Good luck out there, and follow me on Twitter @dyer440

Comments »

Market Forecast – More Blood

The January rout has shown this years hand early.  Most have been punched in the face and are now bloody and bruised.  The two day bounce in equities has provided momentary respite however, I believe it may be short lived.  The supply waiting for the current dip buyers is enormous, and it will further shock the uneasy hands to the sidelines.

First up, the Russel 2000; while technically a work of art, it has been a great way to gauge the market.  The target is the 2007 top around $850.  The current dead-cat bounce we’re experiencing should not go above $1077 or I am wrong.  More likely it will reverse around $1040, then head lower to $850, which is -16.7% from current levels:

RUT_01242016


Next, the Dow 30; dust off your “Dow 14,000” hats from 2007 because we are headed back to those levels (a 13% pullback from here).  The good news is we will likely bounce from there sometime in Q2:

DJ30_01242016


So the bottom line for equities is this, prepare for the bounce to end and the downtrend to resume.  The downside targets are the former 2007 top levels.

On the bright side however, I believe the rest of the world is more screwed than the US.  Take Europe for example; the Europe 350 Index ($IEV) has not been holding up well.  Another -17% appears in the cards – somewhere around the $31 level – perhaps more before 2016 is over:

IEV_01242016


For homework I will refer you to the Japanese Nikkei – talk about ugly.  That may be the best short of them all, especially if you enjoy taking on “whatever it takes” Central Bankers.

Now, where it gets trickier is bonds.  Could bonds also pull back in the face of an equity correction?  I don’t think so, but the zero-boundary for rates is a natural wall – until the Fed changes the playing field again.  Refer to the 7-10 Yr. Treasury Bond ($IEF) chart below:

IEF_01242016


Will that trend line hold, and more importantly, what does it imply about our world if it doesn’t?

Lastly, I will touch on currencies.  I first presented the USD/JPY and the EUR/JPY crosses in my article Calling All Degenerate Oil Gamblers!! last December.  Some of you thought those levels were apparently too far-fetched to be approached anytime soon…

I’ll therefore leave you with an update to the USD/JPY chart:

USDJPY_01242016


Is the US Dollar rally coming to an end?  Or is this simply a healthy pullback?  Will the Fed reverse course, causing the dollar to also reverse course – which would trigger my currency levels?

I try to picture a world that the charts are suggesting.  For example: equities pulling back to 2007 levels, bonds breaking decade long up-trends, currencies suggesting the US Dollar rally may be over (at least in Yen terms), Europe is screwed, Japan is more-so screwed.

This is all just food for thought at this point.  I welcome your thoughts/comments below.  Follow me on Twitter @dyer440.

Comments »

Calling All Degenerate Oil Gamblers!!

Since everyone seems itching to get long oil exposure – being the degenerate gambler myself – I’m going to share with you my own “trigger signals” for commodities in general.  First of all however, a bit of a history lesson:

crude-oil-price-history-chart-2015-12-09-macrotrends

The Oil crash during the Great Recession of 2008-9 was followed-up by a huge rebound as central banks around the world went all-in on various stimulus measures.

This has led some of you to have recency bias.  So first of all I would say:

Check your age, and bias at the door of this casino before entering.

Secondly, I believe the current Oil crash to be primarily a result of Saudi Arabia posturing, and the Saudi’s have played this game before.  Who remembers the mid 1980’s?  I don’t, I was under 5 at the time but I’m from Louisiana and my dad worked off-shore for Schlumberger (he got laid off).  Now I live in Houston and the old-timers here still talk about it.  They like to say:

Last one leaving Houston, please turn off the lights.

Anyway, it’s part of my life history – sort of a mythology of the time period.

After OPEC took the stance that they were going to capture market share – they didn’t stop pumping until everyone else was in real pain.  There’s no reason to expect the Saudi’s to change the playbook this time around.

If you were trying to bottom pick energy exposure back in the mid-80’s you had a tough time of it; there were 3 waves up in price, each followed by another collapse.  The rout finally ended when everyone gave up, then crude prices languished for a decade before anyone made real money in the space.

Now, most of you realize that commodities priced in US Dollars are therefore correlated to the US Dollar.   Did you know that over the past 10 years, they are 74% correlated on an annual basis?  One of my favorite Twitter follows (@TheEuchre) shared this:

@TheEuchre_oilprice_usd


My “trigger signals” on the commodity space are therefore currency related.  I don’t think you can overlook the currency impact if you are speculating on Oil or Oil related exposure.

I like to view the US Dollar in two ways, in USD/JPY and EUR/USD, as opposed to simply the US Dollar Index by itself.  I think there is more detail to be gleaned from it that way, and it provides more confirmation when both pairs signal the same thing.

So Here’s the Trade:

Stay away from Long Oil exposure (and commodities in general) until:

1) The USD/JPY cross falls below 115.50, AND

2) The EUR/USD cross trades above  1.148

Refer to the charts and levels below:

USDJPY_12092015


EURUSD_12092015


Sure, you might miss out on the first 15% of the move, but you may just save yourself from sleepless nights monitoring futures and more importantly, the huge opportunity costs associated.  There are opportunities out there that offer better risk/reward scenarios, so stay out of long energy exposure until the coast is clear.

Better yet, stay short; refer to the following posts for ideas:


Comments »