iBankCoin
Joined Mar 28, 2014
35 Blog Posts

“F-U MONEY”

Only a few times per year do you get a shot at making F-U Money.  I think we have such a setup for 2016 here, and I’ve written about it before (which didn’t pan out), but the upside is such that it could pay to take another look.

IF we have a moment where the market wake’s up to reality I think Netflix (NFLX) could see a 50% pullback.

Doing some research I came across this David Einhorn gem:

NFLX changed its story and pushed its promises into the distant future, with grand hopes for the decade starting in 2020. It transitioned from being a company judged by how much it earns into a company judged by how much it spends. Whether the spending proves successful won’t be known during the investment horizon of most NFLX shareholders.

Here’s the link to Greenlight Capitals Q2 Letter.

Einhorn hasn’t done that well in 2015, but I largely agree with him in regards to NFLX and the market in general, specifically this quote:

In today’s market, the best performing stocks are companies with exciting stories where accountability is in the distant future.

You can easily add Tesla Motors (TSLA) to the list of companies with exciting stories, blowing through tons of money, and lacking any accountability.

However, if you’d like your shot a F-U Money it doesn’t come without risk.  That’s how finance works; it’s not the person with the largest work ethic, or the best of intentions, it’s the person willing to risk hard earned capital using insane leverage in a low probability scenario.  Even if you get the setup and price direction correct, you won’t make F-U Money unless you have the patience to hold onto the trade, even when you’re up 500% – you’ve got to go for the jugular in order to make F-U Money.  It’ll take some brass balls to pull it off…

So Here’s the Trade:

Go SHORT NFLX using way out-of-the-money (OTM) Put Options on a break down through the $110 level, refer to the chart below:

nflx_12212015

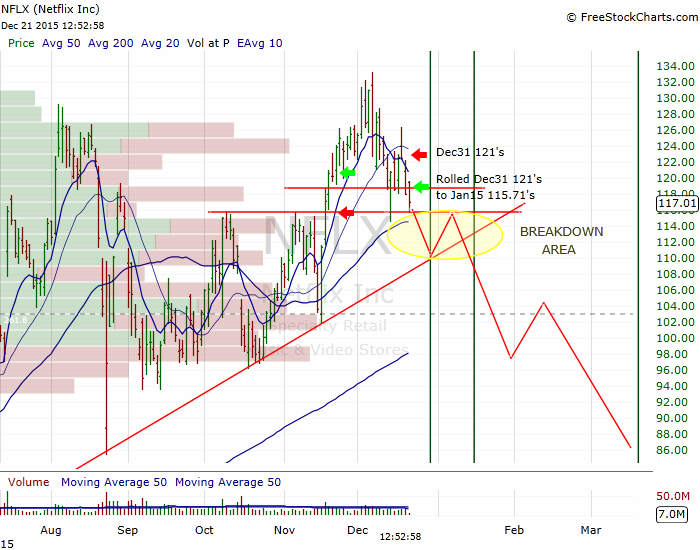
I’m currently in this trade; I’ve recently rolled some Dec. 31 121 puts to Jan. 15 115.71’s.  On a break through the horizontal resistance at today’s low $115.7, and the trend line resistance rising up towards that level, I will be fully locked and loaded with OTM puts. Price target is anywhere in the $60’s.

I’ll probably start with February puts using the 70 strike, with the goal of around 2,000% profits.

This sort of thing isn’t for everybody.  I will follow-up with the setup for TSLA once the price action becomes clearer.

Comments »

Hold Onto Your JNK!!

The high yield credit markets are freezing up, and it’s not good news for distressed companies that are in desperate need of refinancing.   In a “normal” situation, a distressed company could simply refinance their upcoming debt obligations in order to try and manage their way out of a tough situation.

jnk_12212015

Note: I’ve had a bearish market bias since the first “Oh Shit Level” was breached, see above.

Right now assets are being practically given away in order to simply shed huge liabilities.  Take Cliffs Natural Resources (CLF) for example.  They are losing probably $19 per ton mined at their remaining Oak Grove and Pinnacle coal complexes (around -$3.2MM per month).  In addition, they have >$330 million in outstanding liabilities owed to the United Mine Workers of America (UMWA) union (which increases by approx. $15MM per year).  I’m not even sure what the environmental liabilities are, but they also exist.

Keep in mind, these coal complexes are regarded as some of the best metallurgical coal mines in the United States, but who on Earth is going to buy them!?  Better yet, who could finance it?

So, CLF’s will have to basically give these assets away in order to shed the liabilities, it makes sense for them in the current environment, but I bet they wish the credit markets would give them a lifeline so they could wait out the global growth slowdown…

I bring up CLF’s simply as an example.  It could of been Chesapeake Energy (CHK) which has huge exposure to the worst natural gas play (Haynesville Shale) all while nat-gas prices are at lifetime lows.  Insert any frac sand producer, oil & gas producer, or miner around – access to easy credit is drying up.

Which means bankruptcies will happen sooner than anticipated.

I don’t have any particular trade for this post, more of a warning that if you are bottom fishing in commodity related equities, be very careful and do your homework as to the guidance these companies have offered in regards to their debt refinancing plans.  What they were planning only 2-3 months ago may not be possible in the current environment.

Ask yourself what that could mean in regards to their solvency!  And more importantly, your investing capital.

If any of you know of companies planning (hoping) to refinance soon, please comment below.  We can make this a Bankruptcy Watch-list comment section.  Feel free to tee off:

Comments »

FED HEDGE

It’s finally here.  Perhaps the most important  financial week since probably 2011, when central banks around the world made coordinated efforts to “ease strains in financial markets“.  I remember that week clearly; unfortunately I was heavily short equities as markets looked like they were about to roll-over hard.  Instead, during a post Thanksgiving food coma, I had to rush to cover my put options and settled with heavy losses.

Lessons learned: don’t underestimate Central Bank power to save markets and don’t underestimate market participants reactions to Central Bank intervention.

From where I stand, it seems like the markets are currently trying to test the Fed’s resolve. Are they really “data dependent” or, are they S&P 500 dependent?  If the market sells off into Tuesday (Dec. 15 – the day FOMC members meet), will they decide to pull the trigger? If they do, what’s their narrative going forward?  And finally, how will markets react?

I’ll give you 3 scenarios, and then try to frame some trades around this big binary event.  Keep in mind, no one really knows how this will play out.

Scenario 1; No Hike (< 20% probability):

If the Fed fails to raise rates, equities will sell off in a tantrum!  US Dollar top will be in. Bonds will rally as yields go lower (perhaps negative if recession approaches).

Scenario 2; Dovish Hike (35% probability):

If the Fed raises rates then employs a dovish narrative for their guidance moving forward, equities should be appeased and I would expect a move higher to end the year.  The US Dollar top could be in, but it’ll depend more on economic data.  Rates will adjust slightly and their reaction will provide a key tell moving forward.

Scenario 3; Hawkish Hike (45% probability):

A Fed rate hike along with a narrative to get the Fed Funds Rate to a 2% target would be extremely hawkish.  Expect volatility; participants will be pleased that Fed communication finally matches their actions however, the expectation of multiple rate hikes in 2016 will not bode well.  I’d expect an initial positive reaction, followed by a sell off during Yellen’s speech – this is the most likely scenario.  The US Dollar will have further positive momentum going forward, i.e., “more of the same”.  Bonds will adjust, perhaps rapidly depending on how hawkish the narrative is.

Alright, so having some likely scenarios helps to provide a dose of clarity, but probable outcomes don’t typically equate to great trade setups.

Low probability events produce large returns on capital.

So Here’s the Trade:

Take 50% of a speculative amount of capital, enough to hedge the positions you’re carrying into Wednesday (Dec. 16.) and:

Go Long Gold (GLD) and

Go Long Bonds (TLT)

IF the US Dollar is down on Wednesday, post Yellen’s speech, deploy the remaining 50% by doubling down on GLD and TLT.

Let me explain.  If the US Dollar is down on the news it means either Scenario 1 or 2 is playing out… and the world’s reserve currency has likely topped (in my opinion).  This is a low probability call that the Fed is tired of being the only Central Bank not easing, and that they’re going to begin shifting the narrative from talking the dollar up, to talking it down.  It’ll be like slowly turning an aircraft carrier around (it may take time), but I can easily imagine a world where the Fed is trying it’s best to devalue the dollar and create some inflation at any cost – especially if we’re in for more growth deceleration in 2016.

This will likely mean negative US interest rates.  Janet Yellen has even discussed this possibility in November!

Alternatively, if the low probability trade doesn’t work out, and it’s “more of the same”, my trade from Yell Laughing at Commodities should work.

Regarding equities, I’ve provided a structured trade idea in the article The Perfect Pair.  This paired trade should provide the opportunity to pivot with the market once equities settle on a direction.

At the very least I’ve laid out some considerations which should help get the your own ideas flowing ahead of this event.


Comments »

Calling All Degenerate Oil Gamblers!!

Since everyone seems itching to get long oil exposure – being the degenerate gambler myself – I’m going to share with you my own “trigger signals” for commodities in general.  First of all however, a bit of a history lesson:

crude-oil-price-history-chart-2015-12-09-macrotrends

The Oil crash during the Great Recession of 2008-9 was followed-up by a huge rebound as central banks around the world went all-in on various stimulus measures.

This has led some of you to have recency bias.  So first of all I would say:

Check your age, and bias at the door of this casino before entering.

Secondly, I believe the current Oil crash to be primarily a result of Saudi Arabia posturing, and the Saudi’s have played this game before.  Who remembers the mid 1980’s?  I don’t, I was under 5 at the time but I’m from Louisiana and my dad worked off-shore for Schlumberger (he got laid off).  Now I live in Houston and the old-timers here still talk about it.  They like to say:

Last one leaving Houston, please turn off the lights.

Anyway, it’s part of my life history – sort of a mythology of the time period.

After OPEC took the stance that they were going to capture market share – they didn’t stop pumping until everyone else was in real pain.  There’s no reason to expect the Saudi’s to change the playbook this time around.

If you were trying to bottom pick energy exposure back in the mid-80’s you had a tough time of it; there were 3 waves up in price, each followed by another collapse.  The rout finally ended when everyone gave up, then crude prices languished for a decade before anyone made real money in the space.

Now, most of you realize that commodities priced in US Dollars are therefore correlated to the US Dollar.   Did you know that over the past 10 years, they are 74% correlated on an annual basis?  One of my favorite Twitter follows (@TheEuchre) shared this:

@TheEuchre_oilprice_usd


My “trigger signals” on the commodity space are therefore currency related.  I don’t think you can overlook the currency impact if you are speculating on Oil or Oil related exposure.

I like to view the US Dollar in two ways, in USD/JPY and EUR/USD, as opposed to simply the US Dollar Index by itself.  I think there is more detail to be gleaned from it that way, and it provides more confirmation when both pairs signal the same thing.

So Here’s the Trade:

Stay away from Long Oil exposure (and commodities in general) until:

1) The USD/JPY cross falls below 115.50, AND

2) The EUR/USD cross trades above  1.148

Refer to the charts and levels below:

USDJPY_12092015


EURUSD_12092015


Sure, you might miss out on the first 15% of the move, but you may just save yourself from sleepless nights monitoring futures and more importantly, the huge opportunity costs associated.  There are opportunities out there that offer better risk/reward scenarios, so stay out of long energy exposure until the coast is clear.

Better yet, stay short; refer to the following posts for ideas:


Comments »

The Perfect Pair

American Express Co. (AXP) and Visa Inc. (V) are two companies that do very similar things, yet they are on two very different trajectories.  I’ll keep it simple here, and provide you with a potential setup for the intermediate term.

I write about it a lot – because it really is all that matters – after Fed Day (Dec. 16), equities are either going to break out, or break down.  There will be some whipsaws at first but by mid January I think the market will have settled on a direction.  We have been consolidating all year, and equities are either poised for a move higher, or building a top for a subsequent move lower.  No one knows which way it’s going to break, but we will soon find out.  Small investors like me (and I’m assuming you, the reader, as well) have three options on how to deal with this binary setup:

  1. Keep your portfolio mostly intact, cross your fingers and see how your current positioning and bias plays out.
  2. Go to mostly cash and jump in once the narrative becomes clear and prices confirm which way is correct.
  3. Develop a structured setup for the event, one where you’ll be mostly hedged (albeit with potential alpha), but one in which you can quickly pivot in order to catch the direction.

Obviously, I’m going to describe a structured setup using American Express and Visa.

So Here’s the Trade:

Go Long Visa (V) and Short American Express (AXP)

Use the same amount of capital for each leg of this paired trade.  Both sides display plenty of upside (or downside re AXP).  Over the intermediate term, V should continue to outperform AXP regardless of what the Fed does and how the market reacts, so this paired trade would work without the big binary event on the horizon, see below:

Visa vs AXP

While Visa continues the long term trend upwards toward $100, American Express has put in a solid looking head and shoulders topping pattern:

axp_12072015


What makes this a fascinating setup for me is that if you incorporate stop loss levels into each leg of the trade, you will in effect automatically pivot with the market.  For example, on the long V leg, use a stop of $74.50; don’t stay in the trade below that level.  For the short AXP leg, use a stop of $73.50; don’t stay in the trade above that level.

If/when the overall market breaks out, you may be stopped out of the AXP short position but you can continue to ride the trend in Visa up with the market (most likely outperforming it).

Conversely, if/when the overall market breaks down, you may be stopped out of the V long position, but you will probably outperform the market on the downside in the AXP short.

Additionally, there is a small chance that both sides of this trade continue to work (avoiding stop levels), regardless of the overall market direction.


Comments »

Manufacturing Getting Railed

The Railroad stocks are quietly taking it like Peter Frampton in this picture.  Have a quick look at their poor relative performance:

Rail Correlation


I’m not going to get into Dow Theory here, but as I’ve mentioned before (Blame the Weather), industrial production and manufacturing (along with retail sales) are often leading indicators that a recession could be approaching.  The counterpoint argument is that the US economy is more of a services economy now and industrial production is a small percentage of the overall picture, something like 17%.  Perhaps this explains why ISM Manufacturing data has become a poor forecasting tool, see below:


ISM Manufacturing


Nevertheless, if you’d like some earnings exposure – albeit to the downside – I’d like to present two companies whose earnings have peaked and are now decelerating:

  • Kansas City Southern (KSU)
  • Union Pacific Corp (UNP)

In addition, they have both formed decent topping patterns, technically speaking:

ksu_12032015


unp_12032015


I don’t recommend chasing these down today however, I suggest we keep our eye on the sector.  This is a long term idea; it will take most of 2016 to play out – if it plays out.  Both of these setups are implying around a 25-30% payout, so there’s plenty of meat left on the bone, so to speak.  Lets let patience prevail here and perhaps wait until the picture is more clear post Fed day (Dec. 16).  Stay tuned.

Comments »

Yell Laughing At Commodities

As commodities continue to crash and pundits continue picking bottoms, you will do well by paying special attention to currencies.  If you haven’t noticed by now, everything is correlated to currencies at the moment.  Since we’re all currency traders now, it’s important to understand what is happening, and what the possibilities of it continuing to happen are.

First of all, if you haven’t read my article Fed Trade School, do it now.  I described what’s happening, and provided a strategy that continues to work (it’s not too late to put it on, or add to it, by the way).

Now, we are approaching a big binary event – an inflection point if you will: Fed Day, Dec. 16.  The market will read it one of two ways, in my view:

  1. “One and Done”; the Fed raises rates and then attempts to reverse the narrative of additional rate increases.
  2. “Fed 2% Target”; the Fed raises rates and then provides some narrative on how they will approach their 2% rate target.

After today’s speech, the odds favor the “Fed 2% Target” outcome, which will result in more of the same.  Meaning, the US Dollar will continue to outperform global currencies, and I will continue yell laughing at commodities as they crash, see below:

Currency Correlation


Most big research firms have suggested that equities are only in for modest single digit gains in 2016.  As you can see in the chart above, the S&P 500 is stuck in the middle of what’s happening to currencies and commodities worldwide.  Therefore, if you plan on outperforming in 2016 – I think you need more currency exposure.

So Here’s the Trade:

Part 1: If the Fed narrative is hawkish and they lay out their path to a 2% target, go long the following currency ETF’s:

  1. ProShares UltraShort Yen (YCS)
  2. ProShares UltraShort Euro (EUO)

Part 2: Go short your favorite commodity exposed countries via some of the following ETF’s:

  1. Russia (RSX)
  2. India (INDY)
  3. Canada (EWC)
  4. S. Africa (EZA)
  5. Chile (ECH)
  6. Brazil (EWZ)
  7. China (FXI)

Part 1 or Part 2 will work on it’s own, but both parts paired together will work very well – especially if worldwide growth continues to slow down throughout 2016.

If you’d prefer more direct commodity exposure,  I have recommended shorting ConocoPhillips (COP), and Anadarko Petroleum (APC), here and here.  I still like those ideas and for full disclosure I am still in those positions.

Comments »

Blame The Weather!!

It’s seems fashionable to blame the weather for your woes lately.  I suggest you run – not walk – from any CEO or economist claiming the weather has disrupted their forecast.  It gets hot every summer and cold every winter, and weather forecasters predicted a warmer than usual start to this winter more than 3 months ago (due to El Nino).  It’s simply a pathetic excuse for doing a poor job.

The retail sales numbers coming out are a real warning flag in my opinion.  The US economy is basically in a manufacturing recession and the only thing keeping GDP positive lately has been consumer and government spending.

When doing macro analysis on the US economy I tend to review the following four indicators:

  1. Industrial Production
  2. Real Income
  3. Nonfarm Employment
  4. Real Retail Sales

Historically, Industrial Production and Real Retail Sales are leading indicators whereas Real Income and Nonfarm Employment tend to lag.  Review the following chart from dshort.com for example:

Big-Four-Indicators-Since-2000


Industrial Production has experienced two consecutive months of declines (Sept. & Oct.) and Real Sales has had one (Oct.).  My point is that we may be at a tipping point in the US Economy.  If retail sales continue to roll over (as the recent earnings suggest they will), we could be looking at a disappointing Q4 2015 – and they are already blaming the warmer than normal start to winter.  What happens if we see another disappointing first quarter, are they then going to blame the cold weather just like they’ve done the past two years!?  This could get ridiculous, and it’ll be a warning sign that recession approaches.

Here’s the Trade:

If the economy is rolling over, you will need to hedge your portfolio.  Furthermore, if the holiday sales narrative is going to be negative all of December, it’s a good idea to hedge the yearly melt-up in the overall market.  I’m going to use the SPDR S&P Retail ETF (XRT) to accomplish these goals.  XRT has been lagging the overall market since we bottomed in September, refer to the SPY comparison (blue line) in the chart below:

xrt_11302015

Short XRT today using the $46 (ish) level as a stop (red line), with a price target in the $42 area (green line).  I believe this provides a good risk/reward scenario in addition to hedging any longs in your portfolio (perhaps for seasonality purposes).

Comments »

OPEC Is Dead

OPEC is dead.  Saudi Arabia rules the oil markets all by themselves and they are THIS close to hearing the sweet tones of the the final death knell to all their competitors.

Houston, we have a problem.

The pain is coming to an Oil and Gas producer near you, all it will take now is a little more time… If crude prices stay down below $50 for another 6 months I anticipate bankruptcies – which has been the Saudi goal all along.  Even the IEA expects weak demand and over-supply to last through 2016 (see their November report here).

This is the perfect storm of commodity collapse:

  1. Declining Demand
  2. Already over-supplied markets
  3. Strengthening US Dollar
  4. Saudi Arabia in control

For signs of oil bottoming, the very first thing you need is for the narrative out of Saudi Arabia to reverse.  I’m not talking about the kind of one-liner that came out this morning:

“Perhaps it would be fitting here to mention the role of the Kingdom of Saudi Arabia in the stability of the oil market, and its continued willingness and prompt, assiduous efforts to cooperate with all oil producing and exporting countries, both from within and outside OPEC, in order to maintain market and price stability”

Frankly, that’s weak sauce and the markets know it.  The second thing you need is global economic growth to help the demand side.  Finally, you need some production destruction; not a declining rig count – I’m talking about fracking bankruptcies, oil sand bankruptcies, more offshore projects shelved, etc.  The icing on the cake will be a weakening US Dollar.

Right now, the supply imbalance is GETTING WORSE, see below:

Crude Surplus


So Here’s the Trade:

Use any strength in the oil and gas sector to short it.  My two favorites are currently ConocoPhillips (COP) as I detailed in Commodity Not-So Super Cycle, and Anadarko Petroleum (APC).

Technically, APC has been resting above resistance which was first established in August at around $58.50.  The strength today (currently trading at $60) makes a good entry point to short APC.  Add to the position when resistance breaks, use a stop level of around $63 to limit your risk.  Refer to the chart below:

APC_11232015

Comments »

Everyone Has A System

Now that I’ve provided my short strategy, and disclosed that my bias at the moment is to be net short, it’s probably time to share my long strategy.  Here’s where I like utilizing a “system”; some type of algorithmic approach that doesn’t share any bias or emotional baggage which limits us mere humans in so many of our endeavors.

My system is simply an agglomeration of numerous technical metrics using a weighted point system for each.  I’d like to add fundamental metrics to it one day, but what the hell – I’ve been busy.  The system ranks each sector and stock in the S&P 100, and uses intermarket analysis to compare each sector and stock to each other sector and stock within the index.  It’s proprietary and one day I’ll publish my website and make truckloads of money similar to Le Fly.

Until then, here’s the sector rankings:

  1. Information Technology
  2. Consumer Discretionary
  3. Financials
  4. Telecommunications
  5. Industrials
  6. Materials
  7. Consumer Staples
  8. Energy
  9. Health Care
  10. Utilities

Nothing surprising there, but what I like to do is then evaluate the top ranked companies in each of the top 5 ranked sectors:

  1. Information Technology: MSFT, GOOG, FB, ACN
  2.  Consumer Discretionary: AMZN, HD, DIS
  3.  Financials: V, BK, JPM
  4.  Telecommunications: None
  5.  Industrials: GE, RTN, LMT, BA

Now I try to fit the current market “narrative” into what makes sense for the above sectors and companies to continue to outperform.  That being said, Financials and Industrials stick out.  The current narrative is that the Fed is going to raise rates; that will continue to provide a lift for the Financials.  Industrials are an easy choice given the power and political might of the military industrial complex, and the war escalations in light of recent events.

Check out the long term chart for Visa (V):

V_wkly_11182015


Visa looks destined for $100.  That’s a good one for the long term portfolio in my opinion.

In regards to Industrials, each of the companies listed above have done well, but I favor Boeing’s (BA) chart, see below:

BA_wkly_11182015


Here’s the Trade:

If equities close above the recent highs of approx. 2067 (SPX), my short bias is probably wrong.  I will then trim the short positions that aren’t working, and go long Visa and Boeing to hedge my overall portfolio for a probable melt-up into either Fed Day (Dec. 16), or the end of the year.

As I type this post, we are at 2066 and change (SPX), I will employ this strategy if we close with any strength today.

Comments »